Article
Printed in Brazil - ©2012 Sociedade Brasileira de Química0103 - 5053 $6.00+0.00
A
*e-mail: [email protected]
Determination of Ecstasy Components in Human Urine by Gas Chromatography
using a Dispersive Liquid-Liquid Microextraction Procedure
Hossein Ali Mashayekhi*,a and Mohammad Rezaeeb
aDepartment of Chemistry, Tonekabon Branch, Islamic Azad University, Tonekabon, Iran
bYoung Researchers Club, North Tehran Branch, Islamic Azad University, Tehran, Iran
Um método novo foi desenvolvido para pré-concentração e determinação de compostos de ecstasy, 3,4-metilenodioxiamfetamina (MDA), 3,4-metilenodioximetilamfetamina (MDMA), 3,4-metilenodioxietilamfetamina (MDEA) e 3,4-metilenodioxipropilamfetamina (MDPA), em amostras de urina utilizando microextração líquido-líquido dispersiva (DLLME) e cromatografia gasosa com detector por ionização em chama (GC-FID). O método foi baseado na formação de gotículas de um extratante orgânico em soluções preparadas utilizando água, solvente orgânico imiscível (CS2) dissolvido
em solvente dispersor miscível em água (acetona). A fase orgânica, que extraiu MDA, MDEA, MDMA e MDPA da solução da amostra preparada, foi separada por centrifugação. Parâmetros que afetam a eficiência da extração foram investigados e otimizados. Sob condições ideais, as linearidades do método foram 1,0-500 µg L-1 para MDEA e MDPA e 2,5-500 µg L-1 para MDA e MDMA. Os limites de detecção
(LOD, S/N = 3, razão sinal ruído) foram no intervo de 0,3 a 0,8 µg L-1. O método foi aplicado com
sucesso na determinação de analitos em amostras de urina.
A new method was developed for preconcentration and determination of ecstasy compounds, 3,4-methylenedioxyamphetamine (MDA), 3,4-methylenedioxymethylamphetamine (MDMA), 3,4-methylenedioxyethylamphetamine (MDEA) and 3,4-methylenedioxypropylamphetamine (MDPA), in urine samples using dispersive liquid-liquid microextraction (DLLME) and gas chromatography (GC) with flame ionization detection (GC-FID). The method was based on the formation of tiny droplets of an organic extractant in prepared sample solution using water, immiscible organic solvent (CS2) dissolved in water-miscible organic disperser solvent (acetone).
The organic phase, which extracted MDA, MDEA, MDMA and MDPA from the prepared sample solution, was separated by centrifugation. Parameters affecting extraction efficiency were investigated and optimized. Under the optimum conditions, linearities of the method were 1.0-500 µg L-1 for MDEA and MDPA and 2.5-500 µg L-1 for MDA and MDMA. The limits of
detection (LODs, S/N = 3, signal-to-noise ratio) were in the range from 0.3 to 0.8 µg L-1. The
method was successfully applied to the determination of analytes in urine samples.
Keywords: dispersive liquid-liquid microextraction, ecstasy, amphetamine, urine samples, gas chromatography
Introduction
Amphetamines and other related derivatives are powerful stimulants of the central nervous system, often misused by recreational users. A chronic abuse of amphetamines often leads to hallucinations and psychosis, as well as to
dysphoria and depression upon withdrawal.1 Therefore,
their dosage in biological matrices, especially in urine, remains a big challenge for analytical chemists. For many years, immunoassays were largely applied to the dosage of
amphetamine and related drugs.2 However, such methods
are not specific enough and positive results have always to be confirmed by a second more specific technique.
Consequently, several gas3,4 and liquid5 chromatographic
liquid-liquid extraction (LLE) and solid-phase extraction
(SPE) have been proposed for the clean up step frequently.6,7
LLE involves multiple time-consuming steps and requires large volumes of organic solvent which costs high and is dangerous to environment and human. Although SPE requires less solvent and shorter preparation time than LLE, SPE and its cartridges are also rather expensive. Both above processes involve manipulation of samples, and therefore, they will be subject to human errors. In order words, any clean-up procedure may cause partial loss of analyte and consumption of labor, time and cost. Solid-phase microextraction (SPME) integrates sampling, extraction, concentration and sample introduction into a single step and offers a simple, solvent free alternative to traditional methods for sample preparation. SPME for determination of amphetamine and methamphetamine in urine
has been used.8,9 However, SPME is also expensive, its fiber
is fragile and has limited life-time and sample carry-over can
be a problem.10
Dispersive liquid-liquid microextraction (DLLME) was
introduced by Rezaee et al.11 in 2006. In this method, a
cloudy solution is formed when an appropriate mixture of extraction and disperser solvents is injected into an aqueous sample containing the analytes of interest. The surface areas between extraction solvent and sample solution are infinitely large initially. Therefore, the extraction equilibrium can be achieved quickly. After extraction, phase separation is performed by centrifugation and the enriched analyte in the sedimented phase is determined by chromatographic or spectrometric methods. Due to its advantages such as simplicity, fast analysis, low cost and high extraction efficiency, the method has been applied for
the determination of trace analytes in various samples.12-18
In the present work, it is used the DLLME technique and GC-FID for the simultaneous determination o f 3 , 4 - m e t h y l e n e d i o x y a m p h e t a m i n e ( M DA ) , 3,4-methylenedioxymethylamphetamine (MDMA), 3,4-methylenedioxyethylamphetamine (MDEA) and 3,4-methylenedioxypropylamphetamine (MDPA) in urine. Different parameters affecting the extraction process were studied and optimized in detail. The recommended method was successfully employed to determine target analytes in urine. To our knowledge, it is the first time the coupling of DLLME with GC for the determination of these ecstasy compounds in urine samples has been performed.
Experimental
Chemicals and reagents
All chemicals were of analytical reagent grade. Stock solutions of MDA, MDEA, MDMA and MDPA (Salars,
Como, Italy) were prepared in methanol at a concentration
of 1 mg mL-1 and stored at –18 ºC. Working solutions of
standards at suitable concentrations were prepared every day from the stock solution. Carbon disulfide, carbon tetrachloride, chloroform and chlorobenzene as extraction solvents and acetone, acetonitrile and methanol as disperser solvents were obtained from Merck Company (Germany). Also, sodium chloride was purchased from Merck. The water used was purified by an Aqua Max-Ultra Youngling ultra-pure water purification system (Korea).
Apparatus
A gas chromatograph (Agilent GC-7890) equipped with a split/splitless injector system and flame ionization detector was used for separation and determination of the target analytes. Ultra pure helium gas (99.999%, Air products, UK) was passed through a molecular sieve and oxygen trap (Crs, USA), and it was used as carrier gas with a flow rate
of 2 mL min-1. The injection port was held at 260 ºC and
operated in the splitless mode for 1 min then split valve was opened and split ratio of 1:5 was applied. Separation was
carried out on a DB5, 25 m × 0.32 mm i.d. and 0.25 µm film
thickness from SGE (Victoria, Australia) capillary column. The oven temperature was kept at 80 ºC for 2 min and
then increased to 200 ºC at the rate of 8 ºC min-1, and then
increased to 260 ºC at the rate of 30 ºC min-1 and was held
for 2 min. The FID oven temperature was maintained at 280 ºC. Hydrogen was generated by hydrogen generator (OPGU-2200S, Shimadzu) for FID at a flow rate of
40 mL min-1. The flow of air (99.999%, Air products) for
FID was 400 mL min-1.
Dispersive liquid-liquid microextraction procedure
The pH value of a 5.0 mL of prepared sample solution
was adjusted to 10 with 1.0 mol L-1 NaOH and the solution
was placed in a 10 mL glass test tube with conical bottom. 1.0 mL of acetone (disperser solvent) containing 30.0 µL of
CS2 (extraction solvent) was injected rapidly into the sample
solution by using a 2.5 mL syringe. A cloudy solution (water,
acetone and CS2) was formed in the test tube. In this step, the
analytes were extracted into the very fine droplets of CS2 in
a few seconds. After centrifugation for 3 min at 3000 rpm, the extraction solvent was sedimented at the bottom of the
conical test tube (about 5.0 ± 0.1 µL). The volume of 2 µL
of organic solvent was injected into GC-FID instrument.
Experimental-optimization parameters
such as the kind and volume of extraction and disperser solvents, the pH value of sample solution were studied and optimized. Preconcentration factor (PF) and extraction recovery (ER) as analytical responses were calculated based on the following equations:
(1)
(2)
where, PF, Csedimented and C0 are the preconcentration
factor, analyte concentration in the sedimented phase and initial analyte concentration in the sample, respectively;
ER (%), Vsedimented and Vsample are the extraction recovery,
volume of the sedimented phase and volume of the sample,
respectively. Csedimented is calculated from a suitable direct
injection calibration curve.
Selection of the extraction solvent
The selection of extraction solvent is a critical factor in DLLME. The extraction solvent must be immiscible with water, higher density than water and have high
extraction capability for analytes. In our work, CHCl3, CCl4,
C6H5Cl and CS2 were used as extraction solvents to analyze
the effect of the solvent on extraction efficiency. A set of sample solutions was studied by using 1.0 mL of acetone containing different volumes of extraction solvents to achieve about 5.0 µL volumes of settled phase, accordingly,
45.0, 13.0, 12.0 and 30.0 µL volumes of CHCl3, CCl4,
C6H5Cl and CS2 were selected, respectively. As shown in
Figure 1, CS2 possessed the highest extraction recovery as
compared with other extraction solvents.
Selection of the disperser solvent
For DLLME method, disperser solvent must be miscible in both water and the extraction solvent. Therefore, methanol,
acetonitrile and acetone were tested as disperser solvents. The experiments were performed using 1.0 mL of each disperser
solvent containing 30.0 µL of CS2. The results illustrated in
Figure 2 indicate that the variation of extraction recovery with different disperser solvent is not remarkable. Thus, acetone was chosen as the disperser solvent for subsequent experiments because of low cost and toxicity.
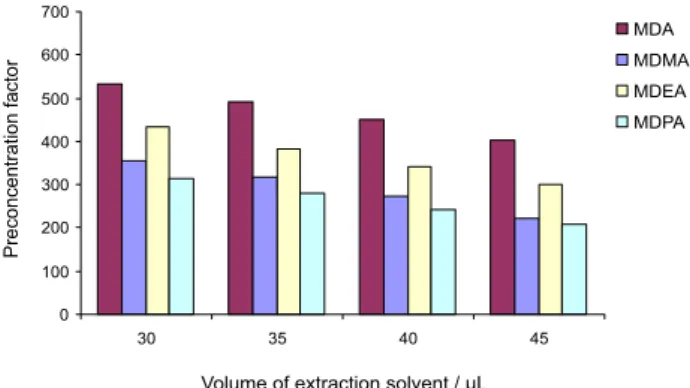
Effect of the extraction solvent volume
To evaluate the effect of the extraction solvent volume on the extraction efficiency, a constant volume (1.0 mL) of
acetone containing different volumes of CS2 (30.0-45.0 µL
at 5.0 µL interval) was subjected to the same DLLME procedures. As shown in Figure 3, the preconcentration factor decreased on increasing the volume of extraction solvent because the volume of the settled phase was
increased with the increase of CS2 volume. On the basis of
these results, 30.0 µL of CS2 was selected for subsequent
experiments.
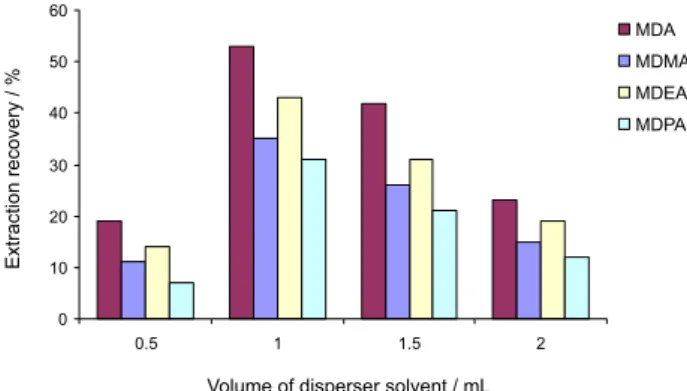
Effect of the disperser solvent volume
To achieve a constant volume of settled phase (5.0 µL), the volume of disperser and extraction solvents should
Figure1. Effect of type of extraction solvent on the extraction efficiency. Extraction conditions: sample volume of 5.0 mL, disperser solvent (acetone) volume of 1.0 mL, extraction solvent volumes of 45.0 µL for CHCl3, 12.0 µL for C6H5Cl, 13.0 µL for CCl4, 30.0 µL for CS2 and analyte concentration of 100 µg L-1.
Figure 2. Effect of type of disperser solvent on the extraction efficiency. Extraction conditions: sample volume of 5.0 mL, disperser solvent (acetone, acetonitrile and methanol) volume of 1.0 mL, extraction solvent (CS2) volume of 30.0 µL and analyte concentration of 100 µg L-1.
Figure 3. Effect of the extraction solvent (CS2) volume on the
also be changed simultaneously. To obtain the optimized volume of disperser solvent, various experiments were performed by using different volumes of acetone (0.5, 1.0, 1.5 and 2.0 mL) containing 28.0, 30.0, 35.0 and 40.0 µL
CS2, respectively. As can be seen from Figure 4, the
extraction efficiency gradually increased with increasing disperser solvent, up to 1.0 mL, but decreased with higher volumes. It may be due to that at low volume, acetone
cannot disperse CS2 properly and cloudy solutions were not
formed completely, and at high volumes, the solubility of analytes in water increased. So, 1.0 mL acetone was chosen as optimum volume.
Effect of the pH of sample solution
Obviously, pH value was the key parameter for sample solution affecting both the extraction efficiency and DLLME selectivity. The sample solution must be adjusted to a desired pH value in which the analytes were uncharged, thus the uncharged molecular form analytes were extracted
into CS2 droplets effectively. The pH of samples was
adjusted with 1 mol L-1 of NaOH to ensure that the neutral
molecular forms of the analytes are present prior to the performing of the microextraction step. The effect of sample pH was tested in the pH range from 8 to 12. The results show that the extraction recoveries of analytes were maximized at pH 10 and then slightly decreased. Thus, pH 10 was selected as the optimum value.
Influence of extraction time
The extraction time is defined as an interval time started after dispersion and ended just before centrifugation. The effect of time on the extraction efficiency was examined in the range of 0-20 min. The results show that the extractiontime has no significant effect on the extraction efficiency of the analytes. It was revealed that the contact surface area between extracting solvent and sample solution
Figure 4. Effect of the disperser solvent (acetone)volume on the extraction recovery of analytes obtained from DLLME. Extraction conditions: sample volume of 5.0 mL, disperser solvent (acetone) volumes of 0.5, 1.0, 1.5 and 2.0 mL, extraction solvent (CS2) volumes of 28.0, 30.0, 35.0 and 41.0 µL and analyte concentration of 100 µg L-1.
was infinitely larger and equilibrium state was achieved after a few seconds. The comparison of equilibrium time of the proposed method and some other reported microextraction
methods8,9 for the extraction of the target analytes indicates
that this novel method has a very short equilibrium time as compared to the other extraction methods. Therefore, in further experiments, the centrifugation was carried out just after the dispersion process.
Salt addition
The effect of increasing the ionic strength of the sample was evaluated by adding NaCl (0-8%, m/v) into the sample solution. DLLME experimental conditions were the same as those described before. Plot of preconcentration factor
vs. ionic strength is shown in Figure 5. It is clear that
by increasing NaCl%, the volume of sedimented phase increased because of the decrease in solubility of the extraction solvent in the presence of salt. Preconcentration factor decreased because of increasing in the volume of sedimented phase (Figure 5). Therefore, further experiments were done without addition of salt.
Results and Discussion
Quantitative analysis
In order to proceed with the current evaluation of the proposed DLLME technique, linearity, limit of detection (LOD) and repeatability were investigated under optimized conditions. The performance of the developed procedure is summarized in Table 1. The
calibration curves were linear in the range 2.5-500 µg L-1
for MDA and MDMA and 1.0-500 µg L-1 for MDEA and
MDPA with correlation coefficients (r2) ranging from
0.9968 to 0.9998. The preconcentration factors were
from 314 to 532. LODs (S/N = 3, signal-to-noise ratio)
were in the range from 0.3 to 0.8 µg L-1. Such detection
sensitivity suggests a high potential for monitoring the target analytes on urine samples by DLLME-GC. RSDs (relative standard deviations) obtained after five consecutive extractions of analytes were calculated to be from 6.6 to 9.3%. Extraction recovery (%) and precisions
(%) at 5.0, 50 and 200 µg L-1 are listed in Table 2 for
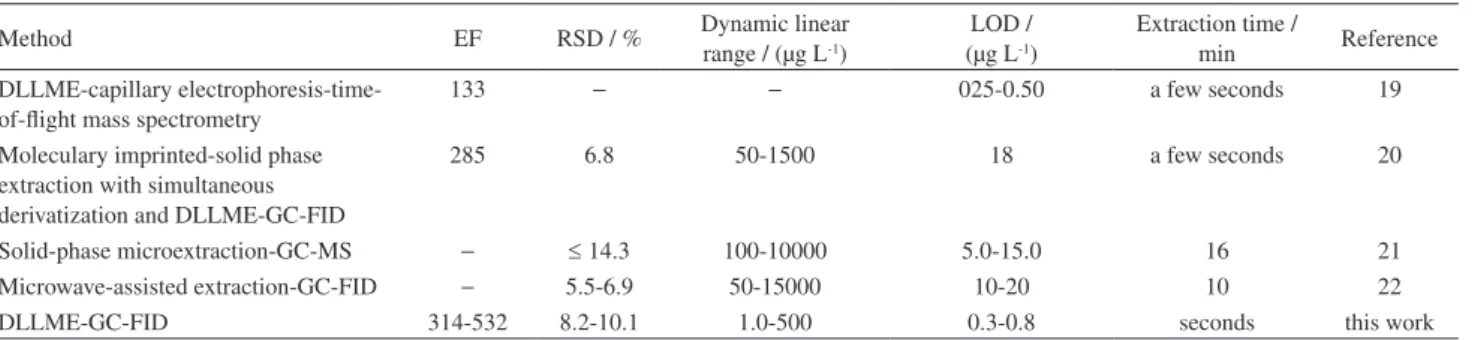
urine samples. Table 3 compares the proposed method with the other extraction methods for the determination of the target analytes in urine samples. The comparison of
extraction time of the proposed method with SPME19 and
microwave-assisted extraction (MAE)20 for the extraction
of the target analytes indicates that this novel method has a very short equilibrium time comparing to the mentioned methods and the extraction time needed for the proposed method is a few seconds and quantitative results of the proposed method are better than those for SPME and MAE methods. Quantitative results of the proposed method are comparable with DLLME-capillary
electrophoresis-time-of-flight mass spectrometry21 without using MS as a
sensitive detector. The quantitative results of the proposed method are better than those for molecularly imprinted-solid phase extraction with simultaneous derivatization and
DLLME-GC-FID22 without using derivatization.
Analysis of real samples
The proposed DLLME-GC procedure described above was applied to determine the target analytes in urine and water samples. Human blank urine was taken from healthy volunteers. All the volunteers declared they had not used amphetamine. Blank samples of urine were spiked with a mixture of the compounds of interest at the requested concentration by adding standard methanolic solutions. In order to determine if analytes is in human urine, the urine from a healthy individual was collected in disposable polyethylene containers and kept at 4 ºC before analysis. In order to reduce the matrix effect, the urine sample was diluted to 1:5, using deionized water. Typical chromatograms obtained for the urine samples before and after spiking of the target analytes by using the DLLME method under the optimum conditions are shown in Figure 6. To determine the matrix effect on the extraction procedures, the relative recoveries of samples spiked with known amounts of each drug were investigated. The results obtained are summarized in Table 4. The relative recoveries of the proposed method for the determination of the target analytes were in the range 90-98.5% in urine. These results demonstrated that the urine matrices had little effect on
Table 3. Comparison of the proposed method with other extraction methods for determination of the target analytes in urine
Method EF RSD / % Dynamic linear
range / (µg L-1)
LOD / (µg L-1)
Extraction time /
min Reference
DLLME-capillary electrophoresis-time-of-flight mass spectrometry
133 − − 025-0.50 a few seconds 19
Moleculary imprinted-solid phase extraction with simultaneous derivatization and DLLME-GC-FID
285 6.8 50-1500 18 a few seconds 20
Solid-phase microextraction-GC-MS − ≤ 14.3 100-10000 5.0-15.0 16 21
Microwave-assisted extraction-GC-FID − 5.5-6.9 50-15000 10-20 10 22
DLLME-GC-FID 314-532 8.2-10.1 1.0-500 0.3-0.8 seconds this work
RSD: relative standard deviation; LOD: limit of detection; PF: preconcentration factor.
Table 2. Extraction recovery and precision at three concentration levels of MDA, MDMA, MDEA and MDPA
Urine
Extraction recovery / % Precision / %, n = 4
MDA MDMA MDEA MDPA MDA MDMA MDEA MDPA
5.0a 50a 200a 5.0a 50a 200a 5.0a 50a 200a 5.0a 50a 200a 5.0a 50a 200a 5.0a 50a 200a 5.0a 50a 200a 5.0a 50a 200a
50.4 52.1 55.1 32.6 33.4 37.4 39.5 41.6 45.2 27.1 29.6 33.2 7.8 8.2 4.3 10.6 9.7 6.6 9.1 8.4 5.6 11.5 10.1 7.3
aConcentration (µg L-1).
Table 1. Quantitative results of DLLME and GC-FID of MDA, MDMA, MDEA and MDPAa
Sample Linear range / (µg L
-1) LOD / (µg L-1) PF LOQ / (µg L-1) r2
MDA MDMA MDEA MDPA MDA MDMA MDEA MDPA MDA MDMA MDEA MDPA MDA MDMA MDEA MDPA MDA MDMA MDEA MDPA Urine 2.5-500a2.5-500a1.0-500b1.0-500b 0.8 0.8 0.3 0.3 532 356 432 314 3.0 3.0 1.5 1.5 0.9998 0.9979 0.9997 0.9968
Table 4. Determination of MDA, MDMA, MDEA and MDPA in water and urine samples and relative recovery of spiked MDA, MDMA, MDEA and MDPA in water and urine samples
Sample Concentration / ( µg L
-1) Added / ( µg L-1) Found ± SD / ( µg L-1), n = 3 Relative recovery / %
MDA MDMA MDEA MDPA MDA MDMA MDEA MDPA MDA MDMA MDEA MDPA MDA MDMA MDEA MDPA
Water n.d. n.d. n.d. n.d. 7.0 7.0 7.0 7.0 6.6 ± 0.4 6.7 ± 0.5 6.8 ± 0.6 6.9 ± 0.7 94.2 95.7 97.1 98.5 Urinea n.d. n.d. n.d. n.d. 3.0 3.0 3.0 3.0 2.7 ± 0.2 2.8 ± 0.2 2.7 ± 0.3 2.9 ± 0.3 90 93.3 90 96.6 aFrom healthy person urine; n.d.: not detected.
Figure 6. GC-FID chromatograms of (a) before spiking with analytes in urine and (b) 3.0 µg L-1 spiked of analytes in urine after extraction via
the proposed method at optimum conditions. Extraction conditions are the same as in Figure 5.
the DLLME method. The obtained results indicate the feasibility of the DLLME method for the determination of the target analytes in urine samples.
Conclusions
This study demonstrates the successful application of DLLME-GC-FID method for the determination of MDA, MDEA, MDMA and MDPA in urine samples. The optimum conditions of extraction performance were obtained. The experimental results reveal that this method provides relatively high extraction efficiencies within a short time, low LOD and good linearity over the investigated concentration range. The performance of this procedure in the extraction of the target analytes from
urine was satisfactory. Compared with SPME8,9 for the
extraction and determination of target analytes, in addition to the short extraction time, low cost and feasibility, the best advantages of the present method are its good linearity and repeatability. Therefore, it has the potential to be a powerful tool for the analysis of the target analytes in urine samples.
Acknowledgements
Financial support by Tonekabon Branch, Islamic Azad University (Tonekabon, Iran) for the support during the period of this research is gratefully acknowledged.
References
1. Pickering, H.; Stimson, G. V.; Addiction1999, 89, 1385.
2. Cheng, L. T.; Kim, S. Y.; Chung, A.; Castro, A.; FEBS Lett.
1973, 36, 339.
3. Taylor, R. W.; Sam, D. L.; Philip, S.; Jain, N. C.; J. Anal. Toxicol.
1989, 13, 293.
4. Shin, H. S.; Donike, M.; Anal. Chem.1996, 68, 3015. 5. Lee, E. D.; Henion, J. D.; Brunner, C. A.; Wainer, I. W.; Doyle,
T. D.; Gal, J.; Anal. Chem.1986, 58, 1349.
6. Bienvenida, G. L.; Garcia-Reyes, J. F.; Antonio, M. D.; Talanta
2009, 79, 109.
7. Feas, X.; Seijas, J. A.; Vazquez-Tato, M. P.; Regal, P.; Cepeda, A.; Fente, C.; Anal. Chim.Acta2009, 631, 237.
8. Ugland, H. G.; Krogh, M.; Rasmussen, K. E.; J. Pharm. Biomed. Anal.1999, 19, 463.
9. Ugland, H. G.; Krogh, M.; Rasmussen, K. E.; J. Chromatogr., B Anal. Technol. Biomed. Life Sci. 1997, 701, 29.
10. Helena, P.; Locita, L. K.; TrAC, Trends Anal. Chem.1999, 18, 272. 11. Rezaee, M.; Assadi, Y.; Milani Hosseini, M. R.; Aghaee, E.;
Ahmadi, F.; Berijani, S.; J. Chromatogr., A2006, 1116, 1. 12. Rezaee, M.; Yamini, Y.; Faraji, M.; J. Chromatogr., A2010,
1217, 2342.
13. Rezaee, M.; Yamini, Y.; Shariati, S.; Esrafili, A.; Shamsipur, M.;
J. Chromatogr., A2009, 1216, 1511.
14. Mashayekhi, H. A.; Abroomand-Azar, P.; Saber-Tehrani, M.; Waqif, S. H.; Chromatographia2010,71, 517.
15. Mashayekhi, H. A.; Abroomand-Azar, P.; Saber-Tehrani, M.; Waqif, S. H.; Int. J. Environ. Anal. Chem. 2011, 91, 516. 16. Mashayekhi, H. A.; Rezaee, M.; Sadeghi Garmaroudi, S.;
Montazeri, N.; Ahmadi, S. J.; Anal. Sci.2011, 27, 865. 17. Guo, J.; Li, X.; Cao, X.; Li, Y.; Wang, X.; Xu, X.; J. Chromatogr., A
2009, 1216, 3038.
18. Zhao, R.; Diao, C.; Chen, Q.; Wang, X.; J. Sep. Sci.2009, 32, 1069.
19. Kohler, I.; Schappler, J.; Sierro, T.; Rudaz, S.; J. Pharm. Biomed. Anal.2012, DOI: 10.1016/j.jpba.2012.03.036.
20. Djozan, D.; Farajzadeh, M. A.; Sorouraddin, S. M.; Baheri, T.;
J. Chromatogr., A2012, 1248, 24.
21. Ugland, H. G.; Krogh, M.; Rasmussen, K. E.; J. Pharm. Biomed. Anal.1999, 19, 463.
22. Ye, N.; Gu, X.; Wang, J.; Sun, H.; Li, W.; Zhang, Y.;
Chromatographia2009, 69, 933.
Submitted: May 5, 2012