Track Electrostatic Model for Describing Secondary Ion Emission of Insulators
P. Iza, R. Sigaud, L.S. Farenzena, C.R. Ponciano, and E.F. da Silveira
Departamento de F´ısica, Pontif´ıcia Universidade Cat´olica C.P. 38071, Rio de Janeiro 22452-970, Brazil
Received on 10 January, 2005
A model based on the nuclear track potential is described and used to predict trajectories and the energy distribution of secondary ions emitted by insulating targets. In this model, the electric field generated by each track pushes away the secondary ions formed on the target surface. The effects on the potential due to target thickness, track charge density, projectile incidence angle and secondary ion mass are analyzed. Predictions are compared with experimental data existing in the literature. It is found that the proposed model describes partially the behavior observed in the angular distribution of the emitted ions and new processes are proposed to be included in the model.
1. INTRODUCTION
Whenever a projectile with velocity comparable to the Bohr velocity penetrates a solid, it interacts mainly with the elec-trons of the target atoms. The projectile slows down at a rate very close to the value predicted by the electronic stopping power, transferring energy via inelastic collisions with elec-trons, i.e., electronic excitation or ionizations. In this process, the secondary electrons diffuse away from the track, crossing eventually the target surface, ionizing and desorbing surface atoms.
To describe the target modification or the secondary emis-sion processes, a basic model - based on the track electrosta-tic potential - has been treated by several authors [1-5]. In this article, a Secondary Electron Induced Desorption - SEID model for insulating targets is discussed and used to calcu-late the secondary ion dynamics, particularly the desorbed ion trajectories and the kinetic energy distribution that those ions have after being accelerated in the region covered by the track potential. It is examined the dependence of the energy distri-butions on the model parameters: the projectile angle, the in-sulator thickness, the secondary ion mass and the track charge density (related to the projectile-target stopping power).
2. THE SEID MODEL
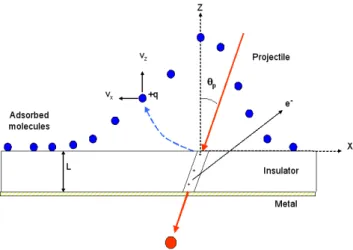
The basic processes and the geometry considered in the track potential model are represented in Fig. 1. The Z di-rection is set to be perpendicular to the target surface and the X direction lies along the surface, defining the projectile in-cidence plane (y=0). The projectile goes towards negative values of z and x. The incidence angle isθpand the impact on
the insulator target surface occurs atx=y=z=0. The coor-dinates of the center of a given adsorbed molecule arex0,y0 andz0. The distancez0, typically equal to 1 ˚A, is considered to be the distance between the adsorbed molecule and the in-sulating layer. The projectile traverses the inin-sulating layer of thickness L, producing a positively charged nuclear track of lengthLT =L/cosθp, and a conducting substrate (necessary
for the experiment) where the local track is promptly neutral-ized. The total charge of the track isQ=nee L/cosθp, where
neis the number of secondary electrons produced by length
FIG. 1: Sketch of the geometry and processes involved in the phenomenon of induced ion desorption. The projectile traverses obliquely an insulating layer, producing a positive track and forcing a fraction of secondary electrons to cross the target surface. Adsorbed molecules are ionized by these electrons and are repelled from the surface by the track potential.
unit andeis the electron charge. It is supposed that this charge density remains constant during the ion desorption process, so that the track electric field is conservative.
The goals of the model are:
i) To calculate the number of desorbed ions per impact and per area unit,NSI(x0,y0), that leave the surface at the
locationx0,y0.
ii) To determine the trajectories of the desorbed ions.
iii) To determine the (final) energy and angular distributions of the desorbed ions,N(Ef), i.e., after they have been
accelerated by the track potential.
Analytical expressions
ConsideringV =0 as the reference potential at an infinite distance of the track and neglecting polarization of the dielec-tric medium (ε=ε0), the potentialVT at a point with
922 P. Iza et al
VT(x,y,z) =
e 4πε0
Z LT
0
ne(s)
q
(x+ssinθp)2+y2+ (z+scosθp)2
ds (1)
and the electric field at the same point is:
~
E(x,y,z) = e 4πε0
Z LT
0 ne
(x+ssinθp)xˆ+yyˆ+ (z+scosθp)zˆ
³
(x+ssinθp)2+y2+ (z+scosθp)2
´3/2ds (2)
The model assumes no direct interaction between the projec-tile and adsorbed atoms or molecules. It is considered that only secondary electrons, produced by the projectile inside the insulator, ionize the adsorbed species. Definingn(x0,y0) as the molecule density at the surface, ¯σeas the average cross
section of the adsorbed molecule by the secondary electron flux andPi as the probability that this ionized molecule can
desorb as an ion, the areal density of desorbed ions is:
NSI(x0,y0) =σ¯ePin(x0,y0) (3)
n(x0,y0) =
Z LT
0 nefΩ(x0,y0,s)e
−l/ζ (4)
whereneis the number of secondary electrons (SE) produced
in a track element of length ds. The fraction fΩ(x0,y0,s)is 1/4π of the solid angle that an adsorbed molecule, located at the coordinates (x0,y0), is seen by the track element at the position s;lis the distance between this element and the mole-cule;ζis the diffusion length of secondary electrons through the insulator, so that the integral ofnefΩexp(−l/ζ)over the
track represents the number of electrons coming from the track and reaching the molecule sitting on the target surface. The quantityneis obtained by dividing the electronic stopping
powerdE/dsby the average energy ¯Eetransferred to each SE,
i.e., the energy necessary to ionize the insulator atoms plus the SE average initial kinetic energy:
ne=
1 ¯ Ee
dEp
ds (5)
The fraction fΩis given by
fΩ(x0,y0,s) = πR
2
4πl2 (6)
wherel2= (x+ssinθp)2+y2+ (z+scosθp)2, 4πl2 is the
area of a sphere with radiuslandπR2is the apparent area of the adsorbed molecule sitting on this sphere.
The charge at the target surface just after the impact is
Qs=e
Z
NSI(x0,y0)dx0dy0 (7)
The electron diffusion process is very complex because it de-pends on: a) the initial energy of the secondary electrons;
b) the energy and recoiling direction of the produced tertiary electrons; c) the number of collisions that, on average, oc-cur between the electron emission in the track and its arrival on the solid surface; and d) the SE capture in the bulk. In the beginning of the cascade process, energetic electrons (δ -electrons) are emitted forward, close to the projectile direc-tion, while low energy electrons are emitted perpendicularly to the track. After a few electron-electron collisions, the di-rection of their movement becomes random and the secondary electron cloud starts to diffuse isotropically. However, such a complexity is not considered in the current version of the SEID model: tertiary electrons and surface barrier potential (the work function) are neglected and it has been assumed that the electrons are isotropically and monoenergetically emitted from the track. This picture gives rise to two tracks: the in-ner one, called infratrack, positively charged and whose di-ameter is typically the atomic didi-ameter; and the outer one, called ultratrack, negatively charged and with an average ra-dius approximately equal toζ. Charge distributions and en-ergy density distributions of both tracks have been discussed in the literature [5-10]. In the current electric field calcula-tions, only the infratrack charge was used to determineVT
(see eq. 1). Since this electric potential is conservative, the desorbed ion’s final energy (far way from the target) is given byEf =qV(x0,y0) +E0, where E0 is the kinetic energy of
the ion leaving the target and q is the ion’s charge. Then, it is possible to combine eqs. 1 and 4 in order to get their energy distributionN(Ef):
N(Ef) =
Z
dA(Ef)
N(x0,y0)dx0dy0 (8)
wheredA(Ef) is the elemental area, on the target surface,
between the equipotentials corresponding to Ef −E0 and
Ef−E0+dEf.
Once the electric field (eq. 2) over the whole space and the initial position of the ions on the surface (eq. 4) are known, 2nd Newton Law can be applied to determine trajectories and
velocities. Consideringneconstant, the integral of eq. 2 can
FIG. 2: Equipotentials of the track field, for different incidence an-gles, :a) on the target surface (left) and b) in the projectile inci-dence plane (right). Note that the target thickness is kept constant (L=100 ˚A), so that the track length increases withθp. The
maxi-mum potential (Vmax) is indicated.
3. NUMERICAL PREDICTIONS OF THE MODEL
3.1. Equipotentials of the projectile track electric field
Once the positively charged track is formed in the insulator, an electric field with cylindrical symmetry (eq. 1) appears around the track. The obtained equipotentials over the XY and XZ planes (top and lateral views, respectively) are displayed in Fig. 2 for three incidence angles: θp=0◦, 45◦and 85◦.
Calculation was performed for an insulator thickness ofL= 100 ˚A, and for a track linear charge density ofnee=0.1e/A˚
(value suggested by Moshammer et al. [12]).
One sees clearly that increasing the incidence angle, the electric potential increases (the total charge Q in the track in-creases with cos−1θ
p) and that the maximum potential on the
XY plane (which defines the solid surface) occurs at the im-pact pointx=y=0. A specular symmetry always exists with respect to the incidence plane: VT(x,−y,z) =VT(x,y,z)and,
obviously, forθp=0◦a cylindrical symmetry around the
nor-mal direction to the surface appears. It is seen in the plots that, even for non zero incidence angle, a cylindrical symme-try appears around the track. Actually this incorrect behavior is due to the consideration in eq. 1 thatε=ε0inside the insu-lator and also to the fact that charge images produced by the metallic substrate are neglected.
FIG. 3: The areal density of ionized adsorbed molecules forθp=0◦,
45◦and 85◦. The value of the distributionn(x
0,y0)and its coordinate xmaxare displayed.
3.2. Surface charge density
The secondary electron flux through the surface ionizes adsorbed molecules. The surface (areal) charge density NSI(x0,y0)is considered proportional to this flux and is
cal-culated by making use of eqs. (4-6). Fig. 3 illustrates how the functionNSI(x0,y0)changes with the incidence angle.
L=100 ˚A,R=0.8 ˚A,nee=0.1 ˚A−1and the diffusion length
ζ=20 ˚A have been considered. For θp=0◦, a symmetrical
functionNSI(x0,y0)is found and the ionized region around
the impact point is a circle with a diameter close to 2 ˚A. A small asymmetry is seen forθp=45◦, while the grazing
im-pact (θp=85◦) produces ionized strip having a∼2 ˚A width and∼(L/cosθp)long. The total ion charge on the surface
should present roughly the same dependence cos−1θ
p as Q
does.
Table I gives numerical results obtained from the model’s expressions.
Note that the charge density at the impact site does not change substantially withθp. TheNSI(x0,y0)maximum value
924 P. Iza et al θp NSI(0,0) NSImax(xmax,0) xmax(A˚) Vmax(V) Qs(e)
0◦ 0.466 0.466 0.0 18 96.0 45◦ 0.498 0.551 -1.0 20 131 85◦ 0.582 0.969 -5.0 36 973
TABLE I: Predicted charge densities, maximum values of surface po-tentials and total surface charge for three incidence angles:θp=0◦,
45◦ and 85◦. N
SI(0,0)is the secondary ion density at the impact
point. Vmax is the electric potential at xmax, the coordinate
corre-sponding to the maximum value ofNSI.QSis calculated considering
¯ σePi=1.
FIG. 4: Trajectories ofH+secondary ions for a projectile impinging atθp=45◦. Two target thickness are considered: L=10 ˚A and
1000 ˚A, solid and dash lines respectively.
3.3. The desorbed ion motion
The majority of the ions formed from adsorbed molecules hit by secondary electrons probably is neutralized on the sur-face and does not desorb or desorb as neutrals. Some sursur-face positive ions are ejected and accelerated by the track repul-sive electric field. In order to make clear the effect of the track potential on desorbed ion motion, it is assumed that: a) the emission occurs with zero initial velocity; b) the electric fields produced by the surface ions and by external sources are negligible, i.e. , only the charged track is source of the electric potential (see 3.1).
Hydrogen ions, for their constant presence in desorption ex-periments were selected for illustrate the model predictions. Results are presented in Fig. 4 for two target layer thicknesses (L=10 ˚A and 1000 ˚A, solid and dashed lines respectively). The projectile impinges atθp=45◦, producing therefore track
lengths of 14 and 1400 ˚A (both havingne=0.1 ˚A−1). TheH+
ions, placed each 2 ˚A along the X axis, leave the target surface in the incidence plane.
The following characteristics are extracted from the calcu-lations.
Geometrical properties: a) trajectories close to the projectile direction are relatively rare, i.e., the angular distribution has roughly a crater shapeproduced by ions running close to a
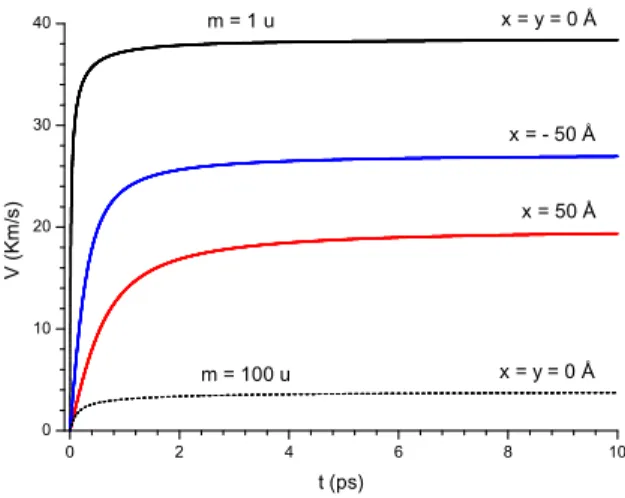
FIG. 5: Dependence of the secondary ion total velocity on the des-orption time. Solid lines correspond tom=1usecondary ion and dash line to am=100uion.
conical surface coaxial to the projectile beam direction; b) ion dispersion for positive x is lower than for negative x; c) the larger the track, the closer the ion emission to the projectile direction - or inversely - very short track tends to produce isotropic ion emission.
Dynamics (Fig. 5): a) ions emitted from the impact site (x=y=0) have the highest final velocity; b) ions emitted from the negative x have higher velocity than the correspon-dent positive x; c) the final velocity is proportional to the in-verse of the square root of the ion mass (since the final kinetic energies are the same) and d) the lower the mass, the faster the ion attains its final velocity (as this potential is conserva-tive). The dashed line represents the velocity of an ion with m = 100 u as function of the desorption time; the final velocity is 10 times lower than an m = 1 u ion desorbed from the same spot.
3.4. Angular distribution
Fig. 6 shows - for the three incidence angles considered - the x y coordinates (y>0) of desorbed ions in three dif-ferent times of their movement: a)t=0, i.e., z=z0, when the ions are about to leave the target surface plane; b)t=tf,
when the track repulsive force becomes negligible (tf=10 ps
for the current calculation); and c)z=zdet, when the ions
ar-rive at the detector surface. The target thickness isL=100 ˚A for all cases. For the planesz=z0andz=zdet, the density
of points is proportional to the density of trajectories crossing each plane; fort=tf, as the ions are distributed over
FIG. 6: Predicted XY projected distribution forθp=0◦, 45◦and 85◦
at different desorption times. Left: on the target surface; center: after t=10 ps; right: on the detector surface. Note the strong repulsion of the ions when they desorb close to the impact spot.
isVacc=4.0kV and the drift region is 37 cm long. Since the
external acceleration field is axial, the x-y radial dispersion is due uniquely to the track radial field component. As expected, forθp=0◦, the point distribution has a rotational symmetry
over all the three planes. The crater shape, characteristic of the track potential repulsion, is seen in thezf and plane
distri-butions. The crater becomes asymmetric forθp=45◦and its
center moves towards positive x. Forθp=85◦, this effect is
more pronounced.
3.5. Energy distributions
Particular energy distributions may be defined for the des-orbed ions: one at the target surface,N(E0), another when lo-cal forces vanish,N(Ef), and another at the detector surface,
N(Edet), after the action of external forces. In this work it is
consideredN(E0) =0 for all ions. N(Ef)can be determined
either by eq. 8 or by solving the equation of motion (Verlet method).N(Edet)can be easily deduced fromN(Ef)by using
Ef =E0+qVacc . It should be reminded that experimental
data obtained from standard time-of-flight give only the axial final velocity distributions, which in turn give ”axial” and not ”axial + radial” kinetic energy distribution. Therefore, in or-der to compare predictions with usual experimental data, the ion dynamics need to be solved.
Fig. 7 shows the axial (low) and the total (up) energy dis-tributions, respectively, predicted by the model. Calculations were done forL=100 ˚A,ne=0.1 ˚A−1,θp=0◦, 45◦and 85◦.
4. COMPARISON WITH EXPERIMENT
Secondary H+ ion emission has been analyzed by many groups [1,13-15]. In particular, Most et al. [13] and Jalowy et al. [14] have measured XY distributions and found that they are emitted asymmetricaly, most of theH+against the incom-ing beam. This agrees with the results shown in Fig. 6: the
FIG. 7: Total (upper graph) and axial (lower graph) energy distrib-utions given by the model. Calculations were done forL=100 ˚A, nee=0.1e/A,˚ θp=0◦, 45◦and 85◦
more grazing the impact is, the more backwards the secondary ions are emitted. On the other hand, the crater shape predicted by the SEID model is not observed experimentally, indicating that either theNSI(x0,y0)function is higher near the impact
spot or the hypothesis that SI are emitted with non zero initial velocity reduces the crater effect.
5. CONCLUSIONS
Secondary electrons diffuse inside the solid up to its sur-face, where they ionize and induce adsorbed molecules to des-orb. This work proposes a model to describe the dynamics of the surface ion formation and emission. The influence of each parameter of the model on the angular and energy dis-tributions of the emitted ions is discussed. Comparison with experimental data indicates partial qualitative agreement, so improvements in the model are necessary in order to enhance theH+emission close to the track direction.
It is suggested, based on eq. 4, thatPi: a) should be maximum
926 P. Iza et al
Acknowledgments
CNPq, FAPERJ and CLAF are gratefully acknowledged for
partial support of this research.
[1] K. Wien, Ch. Kock and Nguyen Van Tan, Nucl. Instr. and . Meth. in Phys. Res. B100, 322 (1995).
[2] G. Schiwietz, P. L. Grande, B. Skogwall, J.P. Biersack, R. K¨ohrbr¨uck, K. Sommer, A. Schmoldt, P. Goppelt, I. K´ad´ar, S. Ricz, and U. Stettner, Phys. Rev. Lett.69, 628 (1992). [3] H. Rothard, C. Caraby, A. Cassimi, B. Gervais, J.P. Grandin, P.
Jardin, M. Jung, A. Billebaud, M. Chevalier, K.O. Groeneveld, and R. Maier, Phys. Rev. A51, 3066 (1995).
[4] K. Kimura, S. Usui, and K. Nakajima, Phys. Rev. A62, 062902 (2000).
[5] P. H˚akansson, Mat. Fys. Medd. Dan. Vidensk. Selsk.43, 593 (1993).
[6] D. Fen¨yo, P. H˚akansson, and B. U. R. Sundqvist, Nucl. Instrum. and Meth. in Phys. Res. B84, 31 (1994).
[7] B. U. R. Sundqvist, Int. J. Mass. Spectrom. Ion Processes126, 1 (1993).
[8] J. A. M. Pereira and E. F. da Silveira, Phys. Rev. Lett.84, 5904 (2000).
[9] C. C. de Castro, I. S. Bitensky, E. F. da Silveira, M. Most, and K. Wien Int. J. Mass Spectrom. and Ion Processes173, 1 (1998). [10] R. M. Papal´eo, P.Demirev, J. Eriksson, P. H˚akansson, and B. U.
R. Sundqvist, Phys. Rev. B54, 3173 (1997). [11] L. Verlet, Phys. Rev.159, 98 (1967).
[12] R. Moshammer, R.Matth¨aus, K. Wien, Y. LeBeyec, and G. Bol-bach, Technische Hochschule Darmstadt internal report, IKDA 89/36 (1989).
[13] M. Most, K. Wien, A. Brunelle, S. Della Negra, J. Depauw, D. Jacquet, M. Pautrat, and Y. LeBeyec, Nucl. Instr. and Meth. in Phys. Res. B168, 203 (2000).
[14] T. Jalowy, L. S. Farenzena, M. Hattass, E. F. da Silveira, H. Schmidt-B¨ocking, and K. O. Groeneveld, Nucl. Instr. and Meth. in Phys. Research B22, 78 (2004).