Mechanisms of Ion Detection for FET-Sensors Using FTO: Role of Cleaning Process, pH
Sequence and Electrical Resistivity
Raphael Aparecido Sanches Nascimentoa*, Marcelo Mulatob
Received: May 18, 2017; Revised: June 26, 2017; Accepted: July 03, 2017
The use of FTO samples as an extended gate ield efect transistor biosensor is presented. The FTO samples were produced by spray pyrolysis technique. The cleaning process is shown to have a fundamental importance for the inal sensitivity of the samples when multiple re-usage is adopted. The role of electrical resistivity and morphology of the ilms are investigated. The inluence of pH sequence of measurements from 2 to 12 is presented. Both increasing and decreasing the pH values sequence of measurements are compared. Electrical, morphological, time evolution and electrochemical experiments are correlated in the main discussion. A physical-chemical model is presented to explain the main mechanisms of charge adsorption and desorption. Parameters not commonly reported in the literature are proven to have fundamental importance in sensors behavior and characterization.
Keywords: Biosensor, FTO, pH sensor, EGFET
* e-mail: [email protected]
1. Introduction
Nanotechnology has provided a true revolution towards miniaturization. In material science and engineering, increasing eforts have been applied to the development of new materials or devices at micro and nanoscale. Materials and devices that have the possibility to be miniaturized to those scales in the future are also studied. This technological appeal is used with quite a success in sensing ield.
Among the huge variety of sensors, the electrochemical ones, specially the Extended Gate Field Efect Transistor (EGFET) type of sensors, can be highlighted as really promising devices because of their intrinsic properties such as possible miniaturization, high entrance impedance, low cost, simple equipment required and possibility to use a broad variety of materials including biocompatible ones1.Those sensors
can be used on the composition of biosensors. Oxides such
as TiO22, SnO 2
3 and ZnO1 can be used as sensing part in
these devices. The biocompatibility of these materials has already been demonstrated by other research groups4-8, and
they have been used as part of various types of biosensors. Interesting works have described the use of EGFET as component of a biosensor to detect, for example, DNA9,10,
CO211, O 2
11, Urea12,13, Protein14, Uric Acid15,16 and Glucose17.
Therefore, the majority of works using EGFET as part of a sensor describes it as a pH-sensor3,18-33.
PH monitoring and control, for itself, are quite important. The human body needs to keep blood´s pH on a very narrow window of value in order to keep the homeostasis. In addition to that, reactions of other important biomolecules as urea34 and
glucose35 can be indirectly detected through pH monitoring.
Fluorine Tin Oxide (FTO) is one of the most useful oxide materials. The advantages of using this material rely on its physical/chemical characteristics. For example: FTO is a n-type semiconductor with a large band gap (between 3.9~4.6 eV)36-38; when produced by spray pyrolysis method,
FTO presents interesting, very promising and useful physical-chemistry characteristics such as potential to be miniaturized, high transparence on visible spectrum region, high surface area, large conductivity range, mechanical hardness, thermal stability and biocompatibility.
Although thin ilms EGFET biosensors are claimed to work, even with FTO as pH sensor3, speciic details during
the preparation of each one of them are very important and, very often, seldom reported. For instance, to make these devices reusable, the cleaning process between consecutive measurements must be addressed. At the present work we intend to demonstrate that cleaning process constitutes a very important step describing how the biosensor device works. The cleaning process establishes a starting point for the devices, which can be diferent for the reuse on further measurements. The role of oxides porous surface in ions adsorption from bulk solutions and the possible masking of the biosensor response will be discussed. This work discusses the importance of doing and describing a careful cleaning process according to the mechanisms involved in the process.
Despite the trivial or simple aspect of the cleaning analysis presented in this work, as seem, they play an important whole in the inal sensor response. Moreover, as far as these authors are concerned, most of the previous published work did not presented a signiicant description of their sensors cleaning process.
aDepartment of Physics, Universidade Federal de Lavras, 37200-000, Lavras, MG, Brazil
bDepartment of Physics, Faculty of Philosophy, Sciences and Letters at Ribeirão Preto, Universidade de
2. Materials and Methods
FTO samples produced by FlexitecCorporation were used. They were deposited on glass by spray pyrolysis technique. This technique makes possible a good control of the sheet resistance of the ilms besides a production of a crystalline material with heterogeneous grain sizes distribution37,38. Thin
ilm samples of diferent nominal sheet resistance of 5~10 Ω/sq (named S10), 21 Ω/sq (named S21) and 80~100 Ω/sq (named S100) were used in the experiments. Those resistances were also measured in the laboratory by a four-probe system and the values were conirmed with a maximum variance of ± 3 Ω/sq. All the samples had the same surface dimensions of 10 mm width and 26 mm length. Electric contact was made with a thin cupper wire and conductive silver glue. The encapsulation of this contact was made by an epoxy resin. This encapsulation always took the same area of 3mm width and 10mm length.
To build the EGFET we used an N-channel of the commercial CD4007 MOSFET from Texas Instruments. Data were acquired using a Data Aquisition HP 34970, and an Agilent E3646A Dual Output DC Power Supply. A homemade software, wrote in LabView 8.0, was used to control the power supply and record the data. Phosphate/ Citrate (0.1 M) homemade bufer solutions were used for pHs 2 to 8. Solutions with pHs 10 and 12 were made by water titration with 1M NaOH solution (purchased from PANREAC).
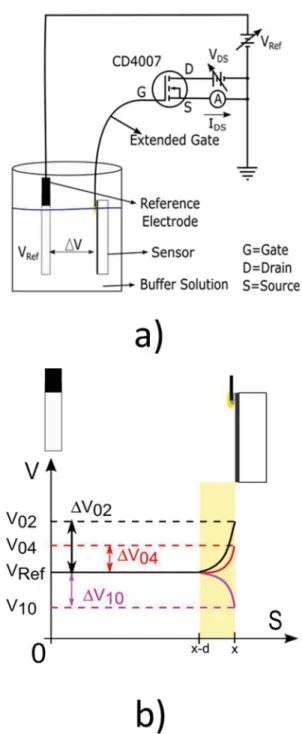
Figure 1(a) shows a scheme of an ion sensor based on EGFET. The sensing part is totally submerged in the electrolyte solution. The ilm is linked by wire to the gate of the N-channel MOSFET. Hence, the higher the gate potential, the larger the current lowing through drain towards source in the MOSFET. The reference electrode is also inserted into solution. This electrode is externally biased through a reference electrode setting the bulk of solution to a constant potential VRef, see Figure 1-a. Ions from the solution will
eventually attach to the surface of the sensor due to its ainity with these ions. Their amount and speciicity will change according to each solution and sensing ilm. The net result will lead to an extra variable potential ΔV between bulk solution and the surface of the ilm. Thus, the inal potential diference between gate and source of the transistor will be VGS = VRef + ΔV (Figure 1 (a)). ΔV is threshold voltage as
already explained somewhere else39,40.
Basically there are two ions being constantly adsorbed or desorbed from the surface: hydrogen (H+) and hydroxyl
(OH-). H+ is a very tiny ion (the tiniest possible ion) that can
move through the electrolyte and penetrate the surface of the sample very easily. OH-, on the other hand, is a much larger
molecule that cannot move around the electrolyte as easily. Hydrogen ions raise the electrostatic potential of the sample when attached to its surface. On the other hand, hydroxyl molecules lower the electrostatic potential of the sample. This is schematically shown in Figure 1(b). At the
Figure 1. a) The whole apparatus to use an EGFET as a biosensor. b) Electrostatic potential distribution though the space. The reference electrode sits at the origin. The ilm sits at the x-position. The double layer extends a distance d from the surface of the sample. ΔV02 is the
voltage variation between reference electrode and sample surface (in double layer region) due to the action of pH 02; ΔV04 is the
voltage variation between reference electrode and sample surface (in double layer region) due to the action of pH 04; ΔV10 is the
voltage variation between reference electrode and sample surface (in double layer region) due to the action of pH 10.
The surface of the sample sits at an X distance away from the reference electrode. The double layer extends a distance d from the sample towards the reference electrode. It is exactly within the double layer that the potential is changed by the ions adsorbed on the surface. The electrostatic potential inside the electrolyte solution and out of the double layer area is practically constant and equal to the same potential applied by the reference electrode (VRef). Depending on
which ion is mostly adsorbed on the surface of the sample and also on its concentration, the potential is gradually changed at the double layer area by an amount equal to ΔV. For example, ΔV02 is the voltage variation between reference
electrode and sample surface (in double layer region) due to the accumulation of proton ions of pH 02 (see Figure 1 (b)).The inal VGS will be the sum of VRef + ΔV. The inal
VGS potential will control the size of the channel inside the transistor, and consequently, the current between drain and source of the transistor (IDS). In other words, the current IDS will be controlled by the number of ions attached to the sensor. In the scheme of Figure 1(a), two variable power sources are used, named VDS and VRef, respectively. The current IDS is
changed when either one of the two power sources is varied. This leads to two diferent measurement conigurations to record the data, here called VDS and VGS. In the VDS coniguration, VRef is kept constant and VDS is varied from 0 to 5 volts, in
0.1 V/s steps. The name VDS is due to the selected voltage
source to change along the time. In this case, the voltage source selected is VDS (the voltage between drain and source for the MOSFET – see Figure 1 (a)). The current IDS is the
current that passes by the Drain (D) and comes out of the Source (S) terminal of the MOSFET towards the circuit Ground – see Figure 1 (a)). On the other hand, in the VGS coniguration, VDS is kept constant and VRef is varied from
0 to 5 volts, also in 0.1 V/s steps. The VGS mode is used to
obtain the sensitivity of the samples41. The name, V GS, is
due to the voltage source that changes is the source named as VRef, and consequently varying VGS (between source and
gate of the MOSFET – see Figure 1 (a)).
Diferent procedures were used to clean the samples, using two diferent solutions. For the irst one the sample was cleaned with DI water before each measurement. The samples prepared according to this procedure will be named sample “Wt” which stands for water. This cleaning consists on just squeezing water on the top of the sample by approximately ive seconds, followed by tissue paper drying. The second procedure starts with the same recipe as the previous one, followed by resting the sample inside an alkaline solution for four minutes, thus, these samples will be named “AS” which stands for alkaline solution. Then, the sample was dried one more time with tissue paper.
Time evolution of IDS current up to 600s was also investigated. Scanning Electron Microscopy (SEM) top view and cross section images were used to investigate the morphology of the samples.
AUTOLAB® (PGSTAT302N, METROHM®) was used to
perform both Cyclic Voltammetry (CV) and Electrochemical Impedance Spectroscopy (EIS). Such analyses were done by varying the pH of a bulk solution between the values 2 to 12. The acidic solutions were done with titration of mili Q water using Sulfuric Acid (H2SO4), and the alkaline
solutions were done titrating mili Q water using Sodium Hydroxide (NaOH). The coniguration used for both analyses was based on three electrodes: a reference electrode (Silver/ Silver Chloride), a working electrode (FTO sample) and a counter electrode (Platinum net)42,43. In such coniguration,
electrical current is lowing between the counter electrode and working electrode while the voltage is being monitored between reference electrode and working electrode. The main advantage performing these measurements through three diferent electrodes is to avoid any luctuation in collected data. The cyclic voltammetry was done at a rate of 50mV/s in 3 cycles. The voltage variation was taken around the potential of 0V and was varied in two diferent potential windows: from -0.5V to 0.5V and -1.0V to 1.0V.
EIS is a very powerful technique to describe electrode/ electrolyte electrochemical interfaces on steady state. Through this technique it is possible to build a resistor-capacitor (RC) equivalent circuit. The three electrode coniguration was similarly used44,45. The applied AC signal presented a vast
frequency spectrum from 10-2 ~ 106 Hz, without any dc bias.
The technique was used to establish a better understanding of the kinetic mechanisms involved on the sorption of ions by the FTO.
3. Results and Discussion
3.1 Cleaning process: initial and in between
re-usage
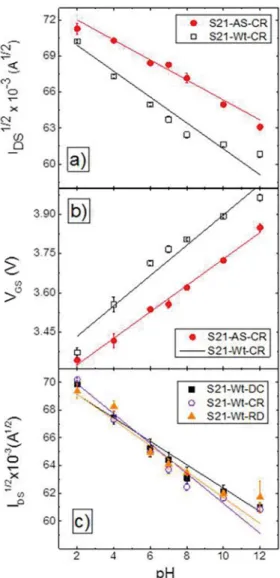
VDS and VGS data measurements using sample S21 are presented in Figure 2 as proof of concept of the inluence of cleaning process on the inal results. Figure 2(a) corresponds to the VDS mode, where solid circles represent the data from a sample cleaned with alkaline solution (labeled as AS), and open squares represent the data from the sample cleaned with water only (labeled as Wt). The solid lines correspond to linear ittings. CR stands for crescent mode, i.e. increasing pH value. The largest current values are always observed for the AS mode for each pH value. The diference between both cleaning processes is very clear.
As cleaning process, alkaline solution seems to provide a more efective and deeper cleaning of the surface than just water. The hydroxyl groups, abundant in alkaline solutions, react with H+ protons previously adsorbed on the surface
mV/pH. The observed diference of about 13% could lead to misleading conclusions in real usage of the device. The highest sensitivity allowed by Nernst equation and accepted by the scientiic community is 59 mV/pH46.
This section leads to the conclusion that the cleaning
process can be crucial for the sensor’s behavior in the future. Cleaning the sample with alkaline solution can increase its current response. However, this cleaning process can decrease the sensitivity of the sensor. On the other hand, cleaning the sample with water can decrease the current response of the sensor, but improves its sensitivity. Thus in the use of any EGFET sensor it is very important that the cleaning process is clearly speciied, once the same sample can present varied inal sensitivities.
3.2 Measurements with increasing and
decreasing pH sequences
The chosen sequence of pH values for subsequent measurements might also be important. According to the speciic material used in the sensing ilm, eventual memory efects could also jeopardize a inal result of the sensors. Three diferent sequences were chosen for this work: random (from now on also named RD), crescent (from now on also named CR) and decrescent (from now on also named DC). For the crescent sequence the measurements were performed on solutions with pHs ranging constantly increasing from 2 to 12. The inverse was used for the decrescent sequence where pHs values of solutions were constantly decreasing from 12 to 2. For the random sequence the pH values were 12, 4, 7, 2, 10, 6 and 8.
Figure 2 (c) shows the results for sample S21, using the three sequences describe above. Only water cleaning process was used between measurements. The solid lines correspond to linear ittings. There is a very slight diference between signals’ amplitudes and linear regression slopes for diferent measurement sequences. The linear regressions could suggest, at most, that the decrescent sequence leads to larger data values than the other sequences at high pHs. This could happen due to the gradually increasing amount of H+ protons in contact with the surface, as the pH decreases.
Nevertheless, as observed in Figure 2 (c), the efect in the present measurements is weak. For the crescent sequence, the irst measurement at pH 2 presented the largest amplitude. The resulting itted curve for the whole sequence presented the largest slope. At the very irst measurement, the surface of the sample gets in contact with the largest possible concentration of H+ protons. The surface adsorbs a great
number of ions within its mesopores (spaces between the polycrystalline grains of the sample). The water cleaning process is not totally efective and some ions still remain adsorbed within the surface even after the cleaning process. These remaining ions somehow shield the surface against the adsorption of new ions for experiments using other pH values. The smaller response for other pHs leads to the larger slope. Figure 2. Response for sample S21 for the two diferent cleaning
processes. a) Typical VDS mode response for AS (slope of the line -0,00083±0,00007 A½/pH)and Wt (slope of the line -0,00108±0,00009
A½/pH)cleaning processes. b) Typical VGS mode response for AS
(slope of the line 0,0505±0,002 mV/pH) and Wt (slope of the line 0,058±0,006 mV/pH) cleaning processes. pH crescent coniguration. c) pH measurement sequence inluence on sensor’s response. Symbols: square → decrescent (slope of the line -0,00084±0,00005A½/pH);
triangle → random (slope of the line -0,00093±0,00009 A½/pH);
circle → crescent (slope of the line -0,00108±0,00005 A½/pH).
water only, some residual ions may remain adsorbed on its surface. These ions are enough to shield the sample against a larger attachment of new ions on the next measurement, and consequently the measured signal is smaller.
For the random sequence all the efects are averaged out, so its slope lies in the middle. Reusable sensors situation most likely approaches the random sequence presented above. In summary, in any investigation, the proper presentation of the used sequence is a key issue.
3.3 Electrical resistivity of the FTO sensing ilm
Samples with electrical sheet resistance in the range of 10Ω/sq and 100Ω/sq were used to investigate the inluence of electrical properties of sensing ilms on the inal response of the sensor. The cleaning process used water only as described before. Figure 3(a) presents the results for crescent pH sequence, while Figure 3(b) presents the results for decrescent pH sequence. Besides the fact that the curves seem very close accordingly to the standard deviations, some discussions might still be conducted.
values slightly above the ones for sample S100. This might be explained by how fast the samples are cleaned, once all the samples were cleaned the same way and by the same time. It seems that the less resistive sample S10 has a faster cleaning process than the more resistive sample S100. This means that the ion adsorption and desorption processes for sample S10 are faster than for sample S100. This would explain why just the irst point at pH2 for sample S100 had larger amplitude than for sample S10. The irst measured point already adsorbs a great number of H+ protons within
the surface of the sample.
If sample S100 is slower cleaned than S10 and both of them were cleaned during the same amount of time, consequently sample S100 will present more residual ions in its surface. These ions will shield the surface against adsorption of new ions in the next measurement (pH 4), and the resulting measured current will be smaller than for S10. The sensor’s sensitivity are S100 (Wt,CR) = 53 ± 5mV/pH and S10 (Wt,CR) = 46 ± 5mV/pH.
Figure 3(b) shows the results for the decrescent pH sequence for the same samples. As previously discussed, the decrescent pH sequence beneits a more organized adsorption of ions once this sequence gradually increases the concentration of H+ protons in each new measurement.
This sequence favors the water cleaning process by the same reason. As observed, sample S100 presents the larger amplitudes, just because it was better cleaned. However, the diference between the current values for both samples seems to increase for decreasing pH values. Sample S100 presents, once again, the largest slope. The lower the pH value, the larger the concentration of H+ protons and more
pronounced would be the diferences due to the cleaning process. The sensitivities were S100 (Wt,DC) = 62 ± 4mV/ pH and S10 (Wt,DC) = 46 ± 1mV/pH.
Because the cleaning process was kept constant for all measurements in these experiments, the sensors characteristics and measurement sequence became more inluent on the sensors response. As shown in Figure 3(a), at a crescent measurement sample S100 is not capable to be completely cleaned by the cleaning process: the response for the next pH values is afected by a memory efect. The following measurements have smaller amplitude than the correspondent measurements for sample S10. Thus, sample S100 is slower cleaned than sample S10. This hypothesis is conirmed by Figure 3(b), where sample S100 was beneited by the measurement sequence, now crescent on concentration of H+ ions (decrescent pH). This sequence slowly increases the
concentration of H+ ions allowing sample S100 to eiciently
adsorb a bigger number of ions as their concentration increases. The adsorption process is faster for sample S10, so smaller changes are observed.
The time evolution of the response of the sensors can present additional information about how fast a sample can achieve an equilibrium condition. For this experiment, Figure 3. Resistivity inluence for samples of 10 Ω/sq (red circles)
and 100 Ω/sq (black squares) cleaned with water, on VDS coniguration for two pH sequences: a) Crescent sequence; b) Decrescent sequence.
As expected from the previous discussion about the crescent pH sequence (Figure 2 (c)), samples in this coniguration are harder to be properly cleaned with water. The sequence starts with the highest H+ protons concentration. The water
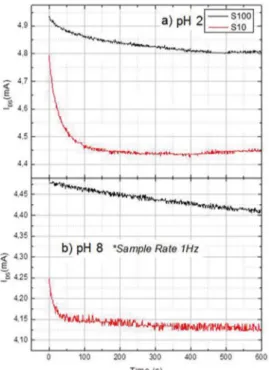
both VRef and VDS were kept constant at 5V and the IDS time
evolution was monitored for 600s. Two bufer solutions were used: one acid at pH 2 and another alkaline at pH 8. The results of such experiments are presented in Figure 4, and they conirm the diferent ion exchange velocities for both samples. Figure 4(a) shows that for pH 2, sample S10 presents a fast decreasing current process that lasts for about 100s. Sample S100 does not present the same behavior and equilibrium was achieved only after 500s. The same qualitative behavior is observed in Figure 4(b) for a larger pH equal to 8. In this case, the irst decay process for sample S10 seems to end in one third of the previous time in Figure 4(a). On the other hand, sample S100 did not reach equilibrium even after 600s. This shows that the more resistive sample S100 achieves equilibrium much slower than sample S10, regardless of the electrolyte solution, acid or alkaline.
Figure 4. Current IDS variation in time for samples S10 and S100 when submerged into two diferent solutions: a) Acid solution (pH 2); b) Alkaline solutions (pH 8).
The FTO samples are constituted by grains and consequently mesopores as shown by the SEM pictures in Figure 5. The data for sample S10 are presented at the left-side pictures a) trough c). Figure 5(a) shows the SEM top view of an original S10 sample. The cross section of an original sample is presented in Figure 5(b). Sample S10 is 670nm thick. The cross-section of a non-working sample after several re-usages (hereon called dead sample) is presented in Figure 5(c). The corresponding information for sample S100 are presented at the right side pictures d) through g) in Figure 5. Note that sample S100 is 206nm thick only.
Figure 5. Scanning Electronic Microscopy. a) Top View of the surface of sample S10 with presence of High Depth Region or Mesopores; b) Lateral view of a virgin sample S10; c) Lateral view of a dead sample S10; d) Top View of the surface of sample S100; e) Lateral view of a virgin sample S100; f) Lateral view of a dead sample S100 with presence of Mesopores created by the detachment of sample from the glass; g) Lateral view of a dead sample S100 with presence of Mesopores created by the detachment of sample from the glass.
The micro grains are clearly seen in Figure 5(a). An average grain size of 200nm was measured. The union of two consecutive grains is not totally sealed. The comparison of Figure 5(a) and (d) suggest that sample S10 has a more homogeneous surface. The heterogeneity of sample S100 is also notoriously conirmed by the presence of several holes on its surface. This physical characteristic of both samples helps to corroborate the idea that for sample S100 it is harder to remove the adsorbed ion. This makes the proper cleaning a very slow process.
The lateral views shown in Figures 5(b) and (e) for the virgin S10 and S100 samples reveal a columnar structure. Some empty spaces under the surface are also observed. The presence of mesopore tunnels might be inferred. Those pores increase the efective surface area of the samples and eventually can allow a larger ion adsorption. These pores would also make it more diicult to reset the samples after the irst use.
The cross section in Figure 5(c) suggests that the dead S10 sample was seriously changed. There are much more wrinkles on this sample than before. This diference makes the cleaning process harder and consequently the sample loses its sensing properties. Figures 5(f) and (g) shows some more interesting efects for sample S100. Large holes under the entire ilm can be observed. Ion trapping must be more severe in this case, leading also to the death of the sample.
3.4 Cyclic voltammetry and impedance
spectroscopy
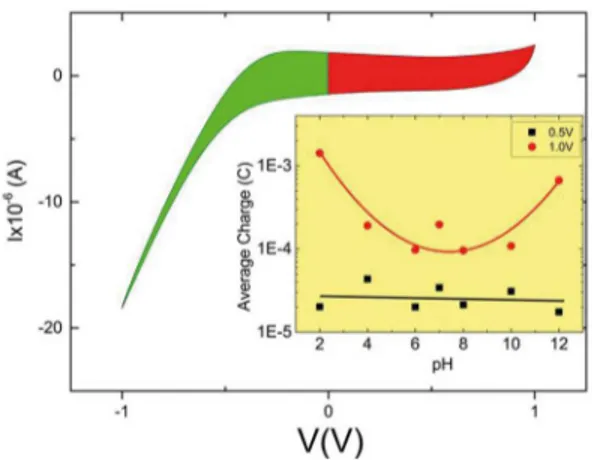
An example of a cycle from the cyclic voltammetry experiment is shown in Figure 6, for sample S10 in a solution with pH 7 without application of any ofset voltage. One cycle was divided in two diferent regions deined by the potential applied: positive potential (red area in Figure 6) and negative potential (green area in Figure 6). The areas represent the total accumulated charge. The most interesting characteristic of the sample provided by this graph is the equality between the number of charges accumulated in the sample for both negative and positive potential (green area is the same as red area). This means that the sample doesn’t prioritize the adsorption of Hydrogen ions (H+) or Hydroxyl
groups (OH-) on its surface.
tiny and can move around the solution and through the sample with relatively higher freedom when compared to Hydroxyl groups. This easiness of H+ ion movement allows it to reach
the sample in greater number than Hydroxyl groups, thus generating a larger signal.
Typical Nernstian sensitivities of EGFET pH sensors lies always bellow 60mV/pH. The total ∆V value expected for an EGFET experiment varying the pH scale from 2 to 12 would then be lower than 1V. A better potential for cyclic voltammetry to address an analysis to complement EGFET data should be, certainly, bellow 1V. The potential of 0.5V is close enough to real potentials applied between the extremes of a pH scale during EGFET measurements, so, this is the only one voltage used in the test. It is a characteristic of the MOSFET (not shown in this work): the necessary potential VGS directly applied to the MOSFET to achieve the same current amplitude IDS for pH 2 is about 0.5V above the used VRef. In a similar behavior, the necessary
potential VGS directly applied to the MOSFET to achieve the same current amplitude IDS for pH 12 is about 0.5V below the used VRef. In conclusion, the closest behavior
of charge accumulation on the FTO ilm can be found on the squares of inset of Figure 6.
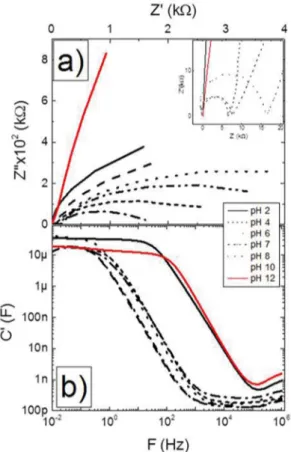
A typical FTO response for impedance spectroscopy experiments is shown in Figure 7(a) in a Nyquist diagram. The experiment was accomplished using sample S10. The other samples should show a similar behavior for this test since this is a test to study a general behavior between the surface of the sample and the electrolyte solution. In such graph, Z’ represents the real part of the total impedance while Z’’ represents the imaginary part of total impedance. So, the real impedance is related to the size of semi-circle formed by the lines in Figure 7(a) in Z’ axis (where the lines touch Z’ axis). The resistive part of the impedance increases for decreasing H+ concentration on acidic solutions (going
from pH 2 to 6) or for decreasing OH- concentration on
alkaline solutions (going from pH 12 to 8). This behavior is directly related with the size of the irst semi-circle of each curve and the efect is better seen in the inset, for low Z’ values in Figure 7(a). For pHs 2 and 12, where H+
and OH- have their highest concentrations, respectively,
the irst semi-circle is not observed. This characteristic is directly related to the high capacitance and low resistivity of the sample on such environments. This assumption is corroborated by the graph in Figure 7(b). For example, at 1kHz, most of the capacitances lye in the 100pF to 1nF range. The exceptions are the capacitances for solutions at pHs 2 and 12, once they are at least 3 orders of magnitude larger. The simplest possible equivalent circuit for the system is presented at the bottommost part of Figure 8. RS represents the resistance of the solution, RDL the
resistance of the double layer and CDL the capacitance of
the double layer. Figure 6. Typical cycle provided by cyclic voltammetry for a FTO
sample. For this graphic a sample of 10Ω/sq was used. No ofset voltage was applied to the sample. Inset) Results from the cyclic voltammetry experiments. Average of charges accumulated at the sample’ surface for diferent pHs and diferent voltages applied to the ilm. The maximum error for 0.5V is ± 3.9E-5C and for 1.0V ± 1.7E-3C.
The inset of Figure 6 shows the average charge accumulated at the surface of sample S10 for two diferent cycles as a function of pH. This charge is equal to the area inside the curves. Positive charges are accumulated in the surface for pHs between 2 and 7. Negative charges are accumulated in the surface for pHs between 7 and 12. For the irst cycle, red circles represent the charges accumulated for 1V voltammetry. For the second cycle, black squares represent the charges accumulated for 0.5V voltammetry. The lines in inset of Figure 6 are just guide to the eyes, not representing any mathematical analyses or tool.
Charges calculated for 0.5V potential presents an almost lat distribution. Certainly, the corresponding electric ield is not strong enough to move a signiicant amount of ions, so the efect doesn’t become clear. Charges calculated for 1V potential presents a U-shaped distribution. The efect can be explained by the ainity of the sample with both H+ or OH-,
presented, there are basically three main regions where an ion can be adsorbed in a sample:
i) The double-layer at the surface. This is a layer that extends all over the surface of a sample, right in front of it. This is the main region where ions are adsorbed and solvated48. When hydrogen ions
are adsorbed on this layer, a hydronium (H3O +)
molecule is formed, as shown at the left part of Figure 8. A water molecule naturally present in the double-layer is attacked by the OH- group which
can pull out a hydrogen atom from it49. A hydroxyl
group is left behind on that place44 (not shown in
Figure 8), adsorbed within the double layer. As a consequence of ion adsorption in the double layer, a counter-ions layer is formed just behind the surface, inside the sample. Figure 8 shows the attachment of hydrogen ions in the double-layer. The counter-ions are illustrated as anions (negative charge). Once the ilm is naturally isoelectric, the negative counter-ions that appear right behind the surface of the sample need to travel from the bulk. In this case, the bulk will present an accumulation of positive charges, as shown in the rightmost part of Figure 8. ii) The internal surfaces due to structural
imperfections. The surface imperfections (due to the ilm production) can even extend a certain range towards the substrate as previously discussed and illustrated in Figure 8. Some of these defects were already reported elsewhere48. Some few hydrogen
ions are assumed to reach these internal surfaces, thus becoming intern ions. They are indicated in the middle part of Figure 8. These ions cannot penetrate deeply inside the ilm and stop right on the internal surfaces. They are neutralized by their proper counter-ions which make the bulk charge to become more positive on this speciic case. iii) The bulk itself. Some ions from solution might
also difuse towards the bulk.
Each one of these regions can be modeled as a virtual capacitor, respectively CDL for double-layer, CII for the internal ions, and CB for the bulk. They can be imagined in a series coniguration and their capacitance can be added to each other in order to form the inal equivalent capacitor:
(1)
However, the FTO thin ilm is a highly conductive semiconductor material and the two capacitors associated to the intern ions and to the ions in the bulk will play a very small role. The bulk low resistance will basically short-circuit the capacitors and the system will in fact be fairly described by a RC model. With this simpliication, the equivalent capacitance is just related to the double layer capacitor, as presented in the equivalent circuit at the bottommost part of Figure 8. Figure 7. a) Spectroscopy impedance results. Nyquist diagram for
FTO sample in diferent pHs (2, 4, 6, 7, 8, 10 an 12). b) Capacitance Diagram for a typical FTO sample.
Figure 8. Schematic of charges distribution all over the FTO sample at the top. Equivalent electric circuit at the bottom.
4. Physical-Chemical Model
Figure 8 resumes the most important and relevant efects related to the ion adsorption mechanisms. Other more detailed studies about metal-oxide interfaces and their electrostatic potentials were already reported elsewhere47.
Nevertheless, our intention is to describe a simpler model describing our indings. According to what was previously
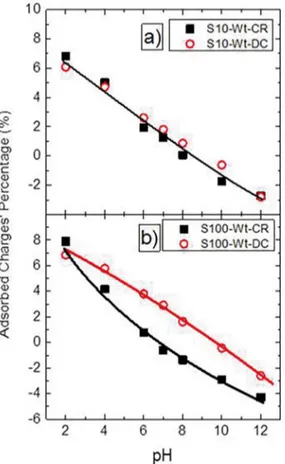
According to the deinition of capacitance, once there is no surface and structural variation and given the electric potential diference is known, the amount of net charge can be inferred. Any variation on the potential applied to the surface of the sample will also result on a variation of accumulated charge. This leads to construction of Figure 9. The lines found in Figure 9 are just guides to the eyes. They do not represent any mathematical function or analysis tool.
Figure 9. Percentage charge’s variation for samples cleaned in water: a) Crescent and Decrescent pH sequence for Sample S10; b) Crescent and Decrescent pH sequence for Sample S100. The lines shown in the igure are just eye guides. They do not represent any kind of mathematical instrument or analysis.
Figure 9(a) shows the percentage of charge variation for the case of sample S10. The data for the two diferent sequences of measurement, crescent and decrescent, are plotted in this igure. Once this sample S10 is cleaned faster, there is almost no diference between the two pH sequences. So, the variation of charge is basically the same for both sequences when the sample is cleaned in water.
Figure 9(b) shows the charge variation for sample S100 on both pH sequences, when it was also cleaned in water. Now, each measurement sequence has a speciic behavior. As discussed, and conirmed by Figure 9(b), the best pH
sequence possible when this sample is cleaned in water is the decrescent one, where H+ protons are gradually introduced
to the surface. So, this sequence can be used as a reference for comparison purposes, and the slow response of sample S100 leads to the charge diference reduction for the smallest pH. This inding corroborates our previous analyses done with EGFET system.
5. Conclusions
It was shown that the cleaning process can inluence the inal response of FTO ilms when used as an EGFET pH sensor. Diferent response characteristics are prioritized according to the cleaning procedure and solution. Alkaline solution raises the sensor’s response amplitude, but lowers its sensitivity. On the other hand, cleaning the sample in water lowers the sensor’s response amplitude and raises sensor’s sensibility. The FTO ilm electrical resistivity and morphology were shown to play an important role on the cleaning process. Less resistive samples have a relatively homogeneous surface. Thus, through a fast and simple cleaning process they can return fairly close to their original state. More resistive samples, on the other hand, need a slower cleaning process. This kind of sample has a very heterogeneous surface that is hard to be cleaned. A physical-chemistry mechanism for charges adsorption on the surface of the sample was proposed. The efective capacitance was analyzed at diferent pHs. As shown, less resistive samples show a small diference on the amount of adsorbed charges as a function of pH measurement sequence. Bigger diferences were found for the most resistive samples according to the crescent or decrescent pH sequence. That occurs because the crescent pH sequence disturbs the sample’s response. This work showed that fundamental aspects, physical characteristics and experimental setup coniguration have direct inluence on FET biosensor’s response.
6. Acknowledgements
This work was supported by FAPESP(2014/09562-4), CAPES and CNPq (302269/2012-6) Brazilian agencies.
7. References
1. Chiu YS, Tseng CY, Lee CT. Nanostructured EGFET pH Sensors With Surface-Passivated ZnO Thin-Film and Nanorod Array.
IEEE Sensors Journal. 2012;12(5):930-934.
2. Yao PC, Lee MC, Chiang JL. Annealing Efect of Sol-Gel TiO2 Thin Film on pH-EGFET Sensor. In: 2014 International
Symposium on Computer, Consumer and Control; 2014 Jun
10-12; Taichung, Taiwan. IEEE. p. 577-580.
3. Batista PD, Mulato M. Polycrystalline luorine-doped tin oxide as sensoring thin ilm in EGFET pH sensor. Journal of Materials
4. Koktysh DS, Liang X, Yun BG, Pastoriza‐Santos I, Matts RL, Giersig M, et al. Biomaterials by Design: Layer‐By‐Layer Assembled Ion‐Selective and Biocompatible Films of TiO2
Nanoshells for Neurochemical Monitoring. Advanced Functional
Materials. 2002;12(4):255-265.
5. Li Z, Yang R, Yu M, Bai F, Li C, Wang ZL. Cellular Level Biocompatibility and Biosafety of ZnO Nanowires. Journal
of Physical Chemistry C.2008;112(51):20114-20117.
6. Wu R, Chen X, Hu J. Synthesis, characterization, and biosensing application of ZnO/SnO2 heterostructured nanomaterials. Journal
of Solid State Electrochemistry. 2012;16(5):1975-1982.
7. He R, Zhao L, Liu Y, Zhang N, Cheng B, He Z, et al. Biocompatible TiO2 nanoparticle-based cell immunoassay for
circulating tumor cells capture and identiication from cancer patients. Biomedical Microdevices. 2013;15(4):617-626.
8. Jang JM, Park SJ, Choi G, Kwon TY, Kim KH. Chemical state and ultra-ine structure analysis of biocompatible TiO2
nanotube-type oxide ilm formed on titanium substrate. Metals
and Materials International. 2008;14:457.
9. Cao Z, Sun LX, Zhou T, Luo YF, Zeng JL, Long S, et al. Investigation on Electronic Signals for Detection of Target DNA Molecule Based on Extended Gate FET Sensing Chip.
Advanced Materials Research. 2011;236-238:1923-1926.
10. Chen CP, Ganguly A, Lu CY, Chen TY, Kuo CC, Chen RS, et al. Ultrasensitive in Situ Label-Free DNA Detection Using a Gan Nanowire-Based Extended-Gate Field-Efect-Transistor Sensor. Analytical Chemistry. 2011;83(6):1938-1943.
11. Hsieh CH, Chen PH, Chen RH, Huang IY. Development of EGFET-based microsensors with sensitivity and high-linearity for dissolved oxygen and carbon dioxide detection. In:
2013 Transducers & Eurosensors XXVII: The 17th International
Conference on Solid-State Sensors, Actuators and Microsystems;
2013 Jun 16-20; Barcelona, Spain. IEE. p. 2051-2054.
12. Yin LT, Lin YT, Leu YC, Hu CY. Enzyme immobilization on nitrocellulose ilm for pH-EGFET type biosensors. Sensors
and Actuators B: Chemical. 2010;148(1):207-213.
13. Chen JC, Chou JC, Sun TP, Hsiung SK. Portable urea biosensor based on the extended-gate ield efect transistor. Sensors and
Actuators B: Chemical. 2003;91(1-3):180-186.
14. Kim DS, Han DI, Park JE, Shin JK, Choi P, Lee JH, et al. S. An extended gate ield efect transistor based protein sensor integrated with a Si micro-luidic channel. In: The 13th International
Conference onSolid-State Sensors, Actuators and Microsystems,
2005. Digest of Technical Papers. TRANSDUCERS’05; 2005
Jun 5-9; Seoul, South Korea. IEEE, Volume 2. p. 2011-2014.
15. Chou JC, Lin CY. Sensing Properties and Stability Analysis of Miniaturized Dual-Mode Uric Acid Biosensor Based on TiO2 Extended Gate Field Efect Transistor. Sensor Letters.
2008;6(6):929-932.
16. Guan W, Reed MA. Extended Gate Field-Efect Transistor Biosensors for Point-Of-Care Testing of Uric Acid. Biosens.
In: Prickril B, Rasooly A, eds. Biosensors and Biodetection - Methods and Protocols, Volume 2: Electrochemical, Bioelectronic,
Piezoelectric, Cellular and Molecular Biosensors. New York:
Springer; 2017. p. 189-203.
17. Lee CT, Chiu YS, Ho SC, Lee YJ. Investigation of a Photoelectrochemical Passivated Zno-Based Glucose Biosensor.
Sensors(Basel). 2011;11(5):4648-4655.
18. Batista PD. An embedded measurement system for the electrical characterization of EGFET as a pH sensor. Measurement Science
and Technology. 2013;25(2):027001.
19. Li HH, Yang CE, Kei CC, Su CY, Dai WS, Tseng JK, et al. Coaxial-structured ZnO/silicon nanowires extended-gate ield-efect transistor as pH sensor. Thin Solid Films.
2013;529:173-176.
20. Huang BR, Lin TC. Leaf-like carbon nanotube/nickel composite membrane extended-gate ield-efect transistors as pH sensor.
Applied Physics Letters. 2011;99(2):023108.
21. Lee PY, Chang SP, Kuo PJ, Hsu EH, Chang SJ, Shei SC, et al. Sensing Performance of EGFET pH Sensors with CZTSe Nanoparticles Fabricated on Glass Substrates. International
Journal of Electrochemical Science. 2013;8:3866-3875.
22. Batista PD, Mulato M, Graef CO, Fernandez FJR, Marques FC. SnO2 extended gate ield-efect transistor as pH sensor.
Brazilian Journal of Physics. 2006;36(2a):478-481.
23. Batista PD, Mulato M. ZnO extended-gate ield-efect transistors as pH sensors. Applied Physics Letters. 2005;87(14):143508.
24. Wang JL, Yang PY, Hsieh TY, Hwang CC, Juang MH. Ph-Sensing Characteristics of Hydrothermal Al-Doped ZnO Nanostructures.
Journal of Nanomaterials. 2013;2013:152079.
25. Hsu JF, Huang BR, Huang CS, Chen HL. Silicon nanowires as pH sensor. Japanese Journal of Applied Physics. 2005;44(Pt 1
4S):2626.
26. Chi LL, Chou JC, Chung WY, Sun TP, Hsiung SK. Study on extended gate ield efect transistor with tin oxide sensing membrane. Materials Chemistry and Physics. 2000;63(1):19-23.
27. Chin YL, Chou JC, Lei ZC, Sun TP, Chung WY, Hsiung SK. Titanium Nitride Membrane Application to Extended Gate Field Efect Transistor pH Sensor Using VLSI Technology.
Japanese Journal of Applied Physics. 2001;40(Pt 1 11):6311.
28. Guan W, Duan X, Reed MA. Highly speciic and sensitive non-enzymatic determination of uric acid in serum and urine by extended gate ield efect transistor sensors. Biosensors and
Bioelectronics. 2014;51:225-231.
29. Das A, Ko DH, Chen CH, Chang LB, Lai CS, Chu FC, et al. Highly sensitive palladium oxide thin ilm extended gate FETs as pH sensor. Sensors and Actuators B: Chemical.
2014;205:199-205.
30. Campos RC, Cestarolli DT, Mulato M, Guerra EM. Comparative Sensibility Study of WO3 ph Sensor Using EGFET and Ciclic
Voltammetry. Materials Research. 2015;18(1):15-19.
31. Yusof KA, Rahman RA, Zulkele MAH, Herman SH, Abdullah WFH. pH sensitivity dependency on the annealing temperature of spin-coated titanium dioxide thin ilms. Jurnal Teknology.
2016;78(5-8):39-44.
32. Rahman RA, Zulkele MAH, Yusof KA, Abdullah WFH, Mahmood MR, Herman SH. Characterization of ZnO/TiO2
33. Sabah FA, Ahmed NM, Hassan Z. Almessiere MA. Inluences of substrate type on the pH sensitivity of CuS thin ilms EGFET prepared by spray pyrolysis deposition. Materials Science in
Semiconductor Processing. 2017;63:269-278.
34. Liu B, Hu R, Deng J. Studies on a potentiometric urea biosensor based on an ammonia electrode and urease, immobilized on a γ-aluminum oxide matrix. Analytica Chimica Acta.
1997;341(2-3):161-169.
35. Ali SMU, Nur O, Willander M, Danielsson B. A fast and sensitive potentiometric glucose microsensor based on glucose oxidase coated ZnO nanowires grown on a thin silver wire. Sensors
and Actuators B: Chemical. 2010;145(2):869-874.
36. Aify HH, Momtaz RS, Badawy WA, Nasser SA. Some physical properties of luorine-doped SnO2 ilms prepared by
spray pyrolysis. Journal of Materials Science: Materials in
Electronics. 1991;2(1):40-45.
37. Turgut G, Keskenler EF, Aydın S, Yılmaz M, Doğan S, Düzgün B. An investigation of the Nb doping efect on structural, morphological, electrical and optical properties of spray deposited F doped SnO2 ilms. Physica Scripta. 2013;87(3):035602.
38. Rakhshani AE, Makdisi Y, Ramazaniyan HA. Electronic and optical properties of luorine-doped tin oxide ilms. Journal of
Applied Physics. 1998;83(2):1049-1057.
39. Bergveld P. Thirty years of ISFETOLOGY: What happened in the past 30 years and what may happen in the next 30 years.
Sensors and Actuators B: Chemical. 2003;88:1-20.
40. Nascimento RAS. Intra and extra-cellular glucose quantiication
by micro-nano-structured biosensors. [Thesis]. Ribeirão Preto:
Faculdade de Filosoia, Ciências e Letras de Ribeirão Preto/ Universidade de São Paulo; 2015.
41. Chi LL, Chou JC, Chung WY, Sun TP, Hsiung SK. Study on extended gate ield efect transistor with tin oxide sensing membrane. Materials Chemistry and Physics. 2000;63(1):19-23.
42. Sivakumar R, Gopalakrishnan R, Jayachandran M, Sanjeeviraja C. Investigation of x-ray photoelectron spectroscopic (XPS), cyclic voltammetric analyses of WO3 ilms and their electrochromic
response in FTO/WO3/electrolyte/FTO cells. Smart Materials
and Structures. 2006;15(3):877.
43. Kissinger PT, Heineman WR. Cyclic voltammetry. Journal of
Chemical Education. 1983;60(9):702.
44. Bard AJ, Faulkner LR. Electrochemical Methods: Fundamentals
and Applications. 2nd ed. Hoboken: Wiley; 2000. 864 p.
45. Orazem ME, Tribollet B. Electrochemical Impedance Spectroscopy.
1st ed. Hoboken: Wiley-Interscience; 2008.
46. Knopfmacher O, Tarasov A, Fu W, Wipf M, Niesen B, Calame M, et al. Nernst Limit in dual-Gated Si-Nanowire FET Sensors.
Nano Letters. 2010;10(6):2268-2274.
47. Streitz FH, Mintmire JW. Electrostatic potentials for metal-oxide surfaces and interfaces. Physical Review B: Condensed
Matter. 1994;50(16):11996-12003.
48. Brown GE Jr, Henrich VE, Casey WH, Clark DL, Eggleston C, Felmy A, et al. Metal Oxide Surfaces and Their Interactions with Aqueous Solutions and Microbial Organisms. Chemical
Reviews. 1999;99(1):77-174.
49. Degen A, Kosec M. Efect of pH and impurities on the surface charge of zinc oxide in aqueous solution. Journal of the European