Power-Law Distributions for the Citation Index of
Scientific Publications and Scientists
Hari M. Gupta, Jos´e R. Campanha, and Rosana A. G. Pesce Departamento de F´ısica, Instituto de Geociˆencias e Ciˆencias Exatas,
UNESP, Caixa Postal 178, CEP 13500-970, Rio Claro, SP, Brazil
Received on 16 June, 2004. Revised version received on 15 September, 2005.
The number of citations of a scientific publication or of an individual scientist has become an important factor of quality assessment in science. We report a study of the statistical distribution of the citation index of both scientific publications and scientists. We give numerical evidence that Tsallis (power law) statistics explains the entire distribution over eight orders of magnitude (10−4to 104). Also, we draw Zipf plots in order to analyze the statistical distribution of the citation index of Brazilian and international physicists and chemists. The relatively small group of Brazilian scientists seems more adequate to explain the dynamics of the citation index. In this case, we find that the distribution of the citation index can also be explained by a gradually truncated power law with similar parameters. We finally discuss possible mechanisms behind the citation index of scientists and scientific publications.
I. INTRODUCTION
In recent years physicists turned to the study of natural sys-tems as a whole rather than in parts [1-6]. The difficulties in understanding these “complex systems” arise from the large number of elementary interactions that are taking place at the same time for a large number of components. Also, these sys-tems are in constant evolution and do not have a usual equi-librium state [1]. Socio-economical and biological systems display these general features, and have been treated by physi-cists. Scaling power laws [7,8] have been found in many bi-ological [9-11], physical [2,12-20] and socio-economical sys-tems [21-29], and they are now considered as an important property of these systems.
Scientific publications are a primary means of scholarly communication in science. The quality of a scientific paper or of an individual scientist can be gauged by the number of citations in the work of other authors. Although this cannot be an exact measurement of the relevance of either a paper or a scientist, it can be taken as a particular and reasonable mea-sure. One of the problems of our scientific community is to know the mechanisms and the distribution of (i) the number of publications of a scientist, (ii) the number of citations, or citation index, of a scientific publication, and (iii) the citation index of a scientist.
In 1957, in a study of the publication record of the scientific research staff at Brookhaven National Laboratory, Shockley [30] claimed that the rate of scientific publications is described by a log-normal distribution. Laherrere and Sornette [31] pre-sented numerical evidence, on the basis of data for the 1120 most cited physicists from 1981 to June 1997, that the citation distribution of individual authors is associated with a stretched exponential form,N(x)∼exph−(x/x0)β
i
, withβ≃0.3. Us-ing the technique of the Zipf plots, Redner [32] has recently shown that the distribution of citations of the most cited sci-entific papers is described by a power law,N(x)∼x−α, with α≃3.0. Tsallis and Albuquerque [33] claim that the newly proposed “Tsallis statistics” can as well account for the distri-bution of citations of scientific papers.
The number of publications and the citation index are dif-ferent concepts. The number of publications of a scientist rep-resents the amount of work that he has done, while the cita-tion index is much closer to representing the quality of this work. The number of publications depends on the capacity to work and to get papers published, while the citation index is related to factors as the originality, the interest in the com-munity, and the relevance of particular research topics. The number of scientific works published by a scientist depends on some factors, as choosing a proper problem, working on this problem, choosing a proper journal, writing ability. As pointed by Schockley [30], a log-normal form is expected to account for the distribution of published scientific papers.
In the present paper we discuss the statistical distribution and the mechanisms behind the citation index of a scientific publication and of an individual scientist. In Section II, we present the model. In Section III, we analyze the statistical distribution of the citation index of scientific publications in 1981, which were cited between 1981 and June of 1997. We also analyze and compare the distributions of the citation in-dex of highly cited Brazilian and international physicists and chemists. In Section IV, we discuss the results and possible mechanisms underlying the citation index.
II. THE MODEL
A power-law distribution [7,8] has been first observed by Pareto in economics [8] in 1897. Pareto claimed that it was related to a positive feedback, namely that wealthy people can more efficiently level their wealth than the average individu-als, so they can create more wealth and achieve an even higher level of income. Recently, we have related power-law distrib-utions to effects of competition, learning and natural selection [34].
memory. The Tsallis generalized entropy is given by
S=k1−∑ip
q i
q−1 , (1)
wherekis a positive constant,qis a parameter, and the sum is over the probabilities of the statistical states. On the ba-sis of this definition, Tsallis and Albuquerque [4] derived the statistical distribution
N(x) = N0 [1+ (q−1)λx]q−q1
, (2)
whereN(x)is the probability density,λis a parameter, andN0 is a normalization constant. This formula can also be written as
N(x) = N0 [1+c1x](1+α)
, (3)
wherec1is a constant and(1+α)is a power-law index. For large values of x, this distribution becomes a simple power law,
N(x)≈cx−(1+α). (4) In this limit, logN(x)versus logxis just a straight line.
In real systems, power-law distributions cannot continue for ever. They have to be somehow truncated in order to avoid an infinite variance. For scientific publications, the research field becomes saturated or almost fully investigated after a certain time, which may be roughly taken between 20 to 100 years, depending on the particular field. Researchers in this area, and citations as well, begin to decrease after this period of satura-tion. In addition to the saturation of the field, there are human limitations to the production of a large number of relevant sci-entific works.
Recently, we have shown that, by gradually truncating a power-law distribution after a certain critical value, it is possi-ble to explain the entire distribution including very large steps in financial and physical complex systems [37-39]. In this work, the power-law distributions come from a positive feed-back which gradually ceases after a certain step size due to limited physical capacity of the components of the system or the system itself. In this limit, these distributions approach a normal form [37]. This approach may also lead to a distribu-tion of the citadistribu-tion index, given by
N(x) =cx−(1+α)f(x), (5) with
f(x) =
1 if |x|6xc
exp
½
−³(|x|−kxc)´β ¾
if |x|>xc , (6)
wherexcis the critical value of the step size at which the
prob-ability distribution begins to deviate from a power-law distrib-ution due to physical limitations, andkis related to the sharp-ness of the cut-off. Comparing to a normal distribution, we have
β=2−α. (7)
We now consider two special cases: (i) case I, ifx6xC, with
N(x) =cx−(1+α), (8) which gives a power-law distribution;
(ii) case II, ifx>>xC, in which the variation due to f(x)is
dominant, and we have
N(x)∼exp
(
− µ|
x|
k
¶β)
, (9)
so logN(x)versusxβis a straight line. This gives a stretched exponential distribution.
The publication density is usually very small for highly cited papers. It is then interesting to draw a Zipf plot [40], in which the number of citations of thenthmost cited paper out of an ensemble ofM papers is plotted versus the rankn. By its very definition, the Zipf plot is closely related to the cu-mulative large-xtail of the citation distribution, which makes it well suited for determining the large-xtail of the citation distribution. Also, it smooths out the fluctuations in the high-citation tail and thus facilitates a quantitative analysis.
Given an ensemble of M papers and the corresponding number of citations for each of these papers, according to the rank order,Y1>Y2>Y3...>Yn>...YM, the number of
cita-tions of thenthmost cited paperYnmay be estimated from the
criterion [24]
Z∞
Yn
N(x)dx=
Z ∞
Yn
M.P(x)dx=n. (10) This equation means that there arenout of the ensemble ofM papers which are cited at leastYntimes. From the dependence
ofYnwithnin a Zipf plot, we can test whether it agrees with
a proposed form forN(x).
For a simple power law distribution, using Equations (4) or (8), we obtain
Yn=c1Mαn−
1
α, (11)
which can also be written as
logYn= (−
1
α)logn+b, (12)
so logYnversus logngives a straight line andbis a constant.
For a stretched exponential distribution, using Equation (9), we obtain
Ynβ=−alnn+b, (13)
whereaandbare constants. In this case,Ynβversus lnnis a
straight line.
III. DATA ANALYSIS
A. Scientific Publications
ISI. It contains the distribution of citations of 783399 papers (with 6716198 citations) published in 1981 and cited between 1981 and June 1997 [41]. It includes papers published in all levels of journals. First, we consider the citations of publi-cations. In both the earlier works on the citation of scientific publications [32,33], the number of publications versus cita-tions is plotted and zeros are simply ignored. In a statistical distribution, we obtain the publication density, in other words, the number of publications in the interval of unit citation, in-stead of the number of publications. This makes a difference in the distribution of the most cited papers as we have a few papers in this range. Furthermore, the zeros can not be ig-nored as ln(0)is−∞. In order to have a picture of the citation mechanisms, we then plot and discuss the publication density (the number of publications per citation) versus the number of citations.
The publication density is given by
N(x) =
·∆
N
∆x
¸
x
,
where ∆N is the number of publications with citations be-tweenx−∆x/2 and x+∆x/2. For smaller citation indices, as we have a large number of publications, we took∆x=1; for larger citation indices, we gradually increased∆xin or-der to have just non-zero values of the publication density for citations.
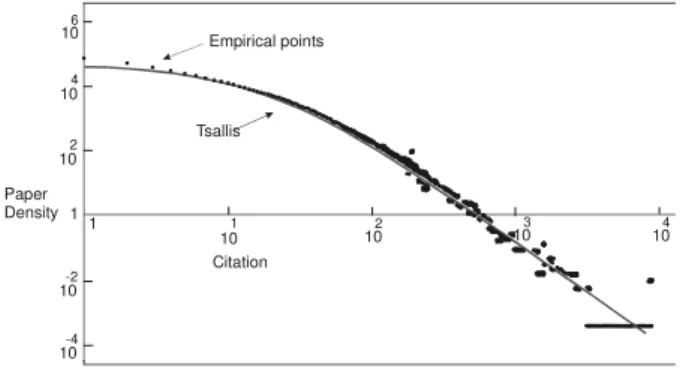
We observe that for almost eight orders of magnitude (10−4 to 104) of publication density, the distribution is given by Tsallis statistics, as shown in Fig. 1, withN0=4.66×10⁴,
c1=0.058 and(1+α) =3.1. The values of N0 andαare chosen from the slope of the best straight-line fittting, with x≥100;c1is chosen to give a best fitting for the initial stages.
Empirical points
Paper Density
106
104
102
10-2
10-4
102 104
101 103
1 1
Tsallis
Citation
FIG. 1: Publication density (publications per citation) versus citation distribution for 783339 papers in the ISI data on a double logarithmic scale. The continuous line is a theoretical curve coming from Tsallis statistics, and the dots are empirical points.
In order to further confirm the supposed distribution, we draw Zipf plots in Fig. 2, for the same parameter values. The fit is excellent showing that the distribution can really be asso-ciated with a Tsallis (power-law) statistics. Also, the fits show that the stretched exponential distribution is not suitable for the present case.
Empirical points
Citation 103
104
102
10
1
102 104
101 103
1 1
Tsallis
105 106
Power Law
Rank
FIG. 2: Zipf plot of the number of citation of thenthranked paperYn
versus ranknon a double logarithmic scale of ISI data. The contin-uous line is a theoretical curve on the basis of Tsallis statistics, the dots are empirical points, and the dashes come from a power law.
B. Scientists
In this case, we analyze the citation index of (a) most cited Brazilian physicists and chemists and (b) most cited physicists and chemists in the world. All physicists (chemists), includ-ing Brazilian physicists, publish their work in the same jour-nals and work on almost the same problems. The Brazilian physicists (chemists) form a small sub-group within the inter-national physicists (chemists) community. The limiting factor for Brazilian physicists (chemists) is relevant for a few top ranking scientists only, since the citation index of only these scientists is above the critical valuexCof a gradually truncated
power-law distribution. For the rest of the most cited scien-tists, a power law is sufficient, and the index of this power law can be more precisely obtained. For the most cited inter-national scientists, the limiting factor may be relevant since the citation index of almost all of these scientists is above the critical valuexC.
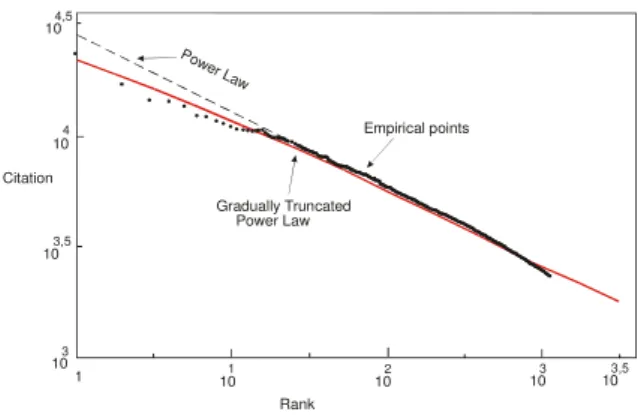
In Fig. 3, we plot citation numberYn versus rank n for
the first 205 Brazilian physicists in 1999 [42]. As it should be expected in case I, we observe a straight line for larger values ofn, which begins to deviate for smaller values ofn (n<20). The theoretical curve corresponds to a gradually truncated power law, withα=1.53, xC =2000,k=1000,
andc=2×10⁶. There is a good agreement between this the-oretical curve and the empirical results.
In Fig. 4, we plot citation numberYnversus ranknfor the
ex-Empirical points Citation
103 104
102
10
1
10
2
101 10
3
1 1
Gradually Truncated
Power Law
Rank Power Law
FIG. 3: Zipf plot of the number of citation of thenthranked Brazilian physicistYn versus ranknon a double logarithmic scale. The dots
are the empirical points, the straight line is a theoretical curve with a gradually truncated power law, and the dashes are a power law.
Empirical points
Citation
103 104
102
101 103
1
Gradually Truncated
Pow er Law
Rank Power Law 104,5
103,5
103,5
FIG. 4: Zipf plot of the number of citation of thenthranked Interna-tional physicistYnversus rank n on a double logarithmic scale. The
dots are the empirical points, the straight line is a theoretical curve with a gradually truncated power law using same parameters as in Figure 3, and the dashes are a power law.
ponential distribution as done by Laherrere and Sornette [31]. However, the stretched exponential distribution is not suitable for the citation index of Brazilian physicists. We then con-clude that the distribution of the citation index of physicists is given by a “gradually truncated” power law.
In Fig. 5, we plot the citation numberYnversus ranknfor
the first 119 Brazilian chemists in 1999 [42]. We see that there is a good agreement with a gradually truncated power law, withα=1.4, xC =1500,k=2000, and c=2.5×10⁵. In
Fig. 6, we plot the citation number versus rank for the first 10858 chemists [32,43] and compare this plot with a gradually truncated power law distribution withα=1.4,xC=6000,k=
2000, andc=108. Again, there is a good agreement with the data.
The stretched exponential distribution fails for both interna-tional and Brazilian chemists. Although for physicists all the parameters are the same, xC for Brazilian chemists is much
Empirical points
Citation 103 10
4
102
101
102 101
103,5
1
Gradually Truncated
Power Law
Rank Power Law
FIG. 5: Zipf plot of the number of citation of thenthranked Brazilian chemistYn versus rank n on a double logarithmic scale. The dots
are the empirical data, the straight line is a theoretical curve with a gradually truncated power law distribution, and the dashes are a power-law distribution.
FIG. 6: Zipf plot of the number of citation of thenthranked In-ternational chemistYnversus rank n on a double logarithmic scale.
The dots are the empirical data, the straight line is a theoretical curve with a gradually truncated power law, and the dashes are a power-law distribution.
lower than for international chemists. Perhaps this is due to more difficult procedures for obtaining financial support of research in Brazil, which is a more important factor in chem-istry than in some branches of physics, particularly in theoret-ical physics. It is interesting to note that 8 out of the 10 most cited Brazilian physicists are working in theoretical physics.
IV. DISCUSSION
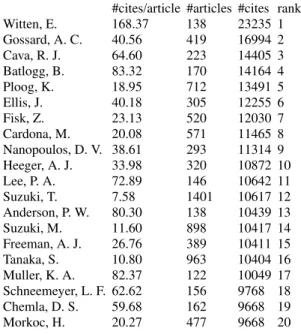
genera-Table I: Citations of the 20 most cited physicists from January 1981 to June 1997
#cites/article #articles #cites rank Witten, E. 168.37 138 23235 1 Gossard, A. C. 40.56 419 16994 2 Cava, R. J. 64.60 223 14405 3 Batlogg, B. 83.32 170 14164 4 Ploog, K. 18.95 712 13491 5 Ellis, J. 40.18 305 12255 6
Fisk, Z. 23.13 520 12030 7
Cardona, M. 20.08 571 11465 8 Nanopoulos, D. V. 38.61 293 11314 9 Heeger, A. J. 33.98 320 10872 10 Lee, P. A. 72.89 146 10642 11 Suzuki, T. 7.58 1401 10617 12 Anderson, P. W. 80.30 138 10439 13 Suzuki, M. 11.60 898 10417 14 Freeman, A. J. 26.76 389 10411 15 Tanaka, S. 10.80 963 10404 16 Muller, K. A. 82.37 122 10049 17 Schneemeyer, L. F. 62.62 156 9768 18 Chemla, D. S. 59.68 162 9668 19 Morkoc, H. 20.27 477 9668 20
Table II: Citations of the 20 most cited chemists from January 1981 to June 1997
#cites/article #articles #cites rank Bax, A. 142.47 152 21655 1 Pople, J. A. 79.80 176 14044 2 Scleyer, P. V. 25.83 525 13559 3 Ernst, R. R. 71.81 182 13069 4 Whitesides, G. M. 38.71 318 12310 5 Schaefer, H. F. 23.15 515 11921 6 Huffman, J. C. 20.20 577 11654 7 Rheingold, A. L. 13.63 830 11317 8 Seebach, D. 32.31 349 11275 9 Lehn, J. M. 35.25 307 10823 10 Meyer, T. J. 39.29 267 10490 11 Smalley, R. E. 108.92 96 10456 12 Bard, A. J. 31.13 333 10365 13 Truhlar, D. G. 31.43 328 10310 14 Stewart, J. J. P. 261.00 39 10179 15 Corey, E. J. 33.43 303 10129 16 Yamamoto, Y. 10.70 935 10007 17 Tanaka, T. 10.44 954 9961 18 Cotton, F. A. 15.63 634 9911 19 Tanaka, K. 8.17 1202 9820 20
tion of citations, it comes to the attention of other researchers through its citations. A more relevant paper is initially cited more times, comes to attention of more workers, and the num-ber of citations increases rapidly. On the other hand, articles which are initially less cited come to attention of a few work-ers only, and their number of citations decreases very rapidly. Most of the published papers are forgotten in the first five years from publication. Only a few more relevant papers are cited during a very long time. A more cited paper in the ini-tial stages comes to the attention of more workers, and thus is
cited more times, thereby coming to the attention of still more people, and being cited still more times, and so on. The ci-tation index increases much more rapidly for relevant papers, which leads to a power-law distribution.
A Zipf plot indicates that the first three most cited papers of a scientist are cited more times than it should be anticipated from a power-law distribution. The citation index of only the most cited papers is expected to increase with time, because other papers are more or less forgotten in twenty years. The presence of high-ranking outliers is often called the King ef-fect and may be due to an amplifying process [44,45].
We basically agree with the conclusion of Tsallis and Albu-querque [4], with a slightly different power index (3.1 instead of 2.9). Note that we plot publication density, and that we achieved a good agreement over a much wider range, which leads to a much clearer picture of the distribution of the cita-tion index.
The fact that a scientist is cited more times makes it easier to obtain financial support for his research projects and better students, which in turn contributes to form a better and larger group. A more cited scientist can more efficiently level his citation index than the average scientist, producing more cita-tions and achieving higher levels of citation index. This pos-itive feedback effect decreases gradually after a certain step size due to physical limitations of the system. For scientific publications, the citation index decreases with time after the field gets saturated or almost fully investigated, which nor-mally takes 20 to 100 years depending on the field. As we have the citation index for a period of only 16 years, we have not observed any gradual truncation of a power law.
Apart from the saturation of the field, other limitations for scientists come from the human capacity to work. The citation index of a scientist is a product of the number of his articles and the average citation per article. It is not possible for any one to compete both in quality and quantity. Some people may have a large number of articles but a small average citation per article, while other people may have larger average citation of an article but small number of articles. This is clear in Tables I and II, in which we list the number of articles and the average citation per article of twenty internationally highly cited physicists and chemists. It is interesting to note that only two of them (P. W. Anderson, and K. A. Muller, at the 13th and 17th places, respectively), out of the 20 most cited physicists, and six (J. A. Pople, R. R. Ernst, J. M. Lehn, R. E. Smalley, E. J. Corey, and K. Tanaka, at the 2nd, 4th, 10th, 12th, 16th, and 20th places, respectively), out of the 20 most cited chemists, are Nobel laureates.
As the citation index of only the most cited scientists is available, it is not possible to distinguish between Tsallis and power-law distributions. We then conclude that the distrib-ution of the citation index of scientific publications and sci-entists is well represented by a gradually truncated power-law distribution. As in several systems from economy and physics, there is a positive feedback mechanism associated with this power law.
Acknowledgments
sug-gestions.
[1] P. Bak,How Nature Works, Oxford University Press, Oxford (1997)
[2] B. B. Mandelbrot,The Fractal Geometry of Nature(Freeman, New York 1982)
[3] B. B. Mandelbrot, Science156, 637 (1967)
[4] D. L. Ruderman, Network: Computation in Neural Systems,5, 517 (1994)
[5] L. Poon, C. Grebogi, Phys. Rev. Lett.75, 4023 (1995) [6] R. Badii, A. Politi, Complexity, Hierarchical Structures and
Scaling in Physics, Cambridge, U. K. (1997)
[7] P. L´evy, Th´eorie de l’Addition des Variables Al´eatories (Gauthier-Villars, Paris 1937)
[8] V. Pareto, Cours d’Economie Politique. Reprinted as a volume of Oeuvres Compl`etes (Droz, Geneve 1896-1965)
[9] C. K. Peng et al., Phys. Rev. Lett.70, 1343 (1993)
[10] G. F. Zebende, P. M. C. de Oliveira, and T. J. Penna, Phys. Rev. E57, 3311 (1998)
[11] J. B. Bassingthwaighte, L. S. Liebovitch, and B. J. West, Frac-tal Physiology (Oxford Univ. Press, New York 1994)
[12] U. Frish, M. F. Shlesinger, and G. Zaslavasky,L´evy Flights and Related Phenomena in Physics(Springer-Verlag, Berlin 1994) [13] T. H. Solomon, E. R. Weeks, and H. L. Swinney, Phys. Rev.
Lett.71, 3975 (1993)
[14] M. Nelkin, Adv. Phys.43, 143 (1994)
[15] A. Ott., J. P. Bouchard, D. Langevin, and W. Urbach, Phys. Rev. Lett.65, 2201 (1990)
[16] Z. Olami, H. J. S. Feder, and K. Christensen, Phys. Rev. Lett.
68, 1244 (1992)
[17] B. Chabaud et. al., Phys. Rev. Lett.73, 3227 (1994)
[18] E. Weeks, J. Urbach, and H. L. Swinney, Physica D97, 291 (1996)
[19] T. H. Solomon, E. R. Weeks, and H. L. Swinney, Physica D76, 70 (1994)
[20] H. E. Hurst, Trans. Am. Soc. Civil Eng.116, 770 (1951) [21] Proceedings of First International Conference on High
Fre-quency Data in Finance (Olsen & Associates, Zurich 1995) [22] R. N. Mantegna and H. E. Stanley, Nature376, 46 (1995) [23] G. Ghashghaie et. al., Nature381, 767 (1996); A. Arneodo et
al. preprint cond-mat/9607120
[24] E. F. Fama, Management Sci.11,404 (1965)
[25] A. L. Tucker, J. of Business & Economic Statistics, 10, 73 (1992)
[26] J. P. Bouchaud and M. Potters, Th´eorie des risques financiers, Alea Saclay (1997)
[27] A. Arneodo, J. F. Muzy, and D. Sornette, Eur. Phys. J. B2, 227 (1998)
[28] T. Lux and M. Marches, Nature397, 498 (1999)
[29] H. M. Gupta , J. R. Campanha, and F. R. Chavarette, Int. J. Modern Phys. C14, 449 (2003)
[30] W. Shockley, Proc IRE45, 279 (1957)
[31] J. Laherrere, D. Sornette, Eur. Phys. J. B13, 777 (2000) [32] S. Redner, Eur. Phys. J. B4, 131 (1998)
[33] C. Tsallis, M. P. Albuquerque, Eur. Phys. J. B13, 777 (2000) [34] H. M. Gupta, J. R. Campanha, Physica A345, 267 (2005) [35] C. Tsallis, J. Stat. Phys.52, 479 (1988)
[36] C. Tsallis, Braz. J. Phys.29, 1 (1999)
[37] H. M. Gupta, J. R. Campanha, Physica A275, 531 (2000) [38] H. M. Gupta, J. R. Campanha, Physica A268, 231 (1999) [39] H. M. Gupta, J. R. Campanha, and F. D. Prado, Int. Journal of
Modern Physics C,11, 1273 (2000)
[40] J. Galambos,The Assymptotic Theory of Extreme Order Statis-tics(John Wiley & Sons, New York, 1978)
[41] Data from Web site http://physics.bu.edu/˜redner/
[42] Data avalaible on website
http://www.uol.com.br/fsp/especial/ranking
[43] Data avalaible on website http://physics.bu.edu/˜redner/ [44] J. A. Davies, Eur. Phys. J. B27, 445 (2002)