ABSTRACT
The diagnosis of osteoporosis and monitoring of treatment is a challenge for physicians due to the large number of available tests and complexi-ties of interpretation. Bone mineral density (BMD) testing is a non-invasive measurement to assess skeletal health. The “gold-standard” technology for diagnosis and monitoring is dual-energy X-ray absorptiometry (DXA) of the spine, hip, or forearm. Fracture risk can be predicted using DXA and other technologies at many skeletal sites. Despite guidelines for selecting patients for BMD testing and identifying those most likely to ben-efit from treatment, many patients are not being tested or receiving ther-apy. Even patients with very high risk of fracture, such as those on long-term glucocorticoid therapy or with prevalent fragility fractures, are often not managed appropriately. The optimal testing strategy varies accord-ing to local availability and affordability of BMD testaccord-ing. The role of BMD testing to monitor therapy is still being defined, and interpretation of ser-ial studies requires specser-ial attention to instrument calibration, acquisition technique, analysis, and precision assessment. BMD is usually reported as a T-score, the standard deviation variance of the patient’s BMD com-pared to a normal young-adult reference population. BMD in post-menopausal women is classified as normal, osteopenia, or osteoporosis according to criteria established by the World Health Organization. Stan-dardized methodologies are being developed to establish cost-effective intervention thresholds for pharmacological therapy based on T-score combined with clinical risk factors for fracture. (Arq Bras Endocrinol Metab 2006;50/4:586-595)
Keywords:Osteoporosis; BMD; Bone density testing; Bone mass measure-ment; DXA, Update; Controversy
RESUMO
Densitometria Óssea na Prática Clínica.
O diagnóstico e monitoração do tratamento da osteoporose é um desafio para os médicos devido ao grande número de testes disponíveis e a complexidades da interpretação. O exame da densidade mineral óssea é uma medida não-invasiva da avaliação da saúde esquelética. A tecnologia “padrão-ouro” para o diagnóstico e monitoração é a absorciometria por raios-X duo-energética (DXA) da coluna, quadril ou antebraço. O risco de fratura pode ser previsto usando DXA e outras tecnologias em vários sítios esqueléticos. Apesar das diretrizes para a medida de da DMO e identificação daqueles que mais provavelmente irão se beneficiar do tratamento, muitos pacientes não estão sendo tes-tados ou recebendo tratamento. Mesmo pacientes com elevado risco de fratura, tais como aqueles em terapia de longo prazo com glicocor-ticóides, ou mesmo aqueles com fraturas por fragilidade prevalentes, quase nunca estão sendo conduzidos adequadamente. A estratégia diagnóstica ótima varia de acordo com a disponibilidade e acesso à medida da DMO. O papel da medida da DMO para monitorar terapia ainda está sendo definido, e a interpretação de estudos seriados requer
E. Michael Lewiecki
João Lindolfo C. Borges
New Mexico Clinical Research & Osteoporosis Center (EML), USA, and Universidade Católica de Brasília (JLCB), Brazil.
atenção para calibração instrumental, técnica de aquisição, análise e avaliação da precisão. A DMO é geralmente descrita como T-score, a variação do desvio-padrão da DMO da paciente pós-meno-pausa comparada com a DMO de uma população de referência adulta, jovem e normal, sendo classifi-cada como normal, osteopenia ou osteoporose, de acordo com os critérios estabelecidos pela Organi-zação Mundial de Saúde. Metodologias-padrão estão sendo desenvolvidas para estabelecer os cus-tos-efetividade dos limiares de intervenção para te-rapia farmacológica baseado no T-score combina-do com fatores clínicos de risco de fraturas. (Arq Bras Endocrinol Metab 2006;50/4:586-595)
Descritores:Osteoporose; DMO; Densitometria óssea; Medida da massa óssea; Atualização em DXA; Con-trovéria em DXA
O
STEOPOROSIS CAUSES NO SYMPTOMS until a frac-ture occurs. Osteoporosis or low BMD is esti-mated to occur in about 44 million American men and women, accounting for 55% of the population age 50 and over (1). The prevalence of this disease in Brazil is not known. Fractures of the spine and hip may result in chronic pain, deformity, depression, disability, and death. About 50% of patients with hip fractures will never be able to walk without assistance and 25% will require long-term care (2). The mortality rate five years after a fracture of the hip or a clinical vertebral fracture is about 20% greater than expected (3), with mortality rates higher for men than women (4). The direct cost of osteoporotic fractures in the USA was about $17 billion per year in 2001 (5). The Surgeon General’s “Report on Bone Health and Osteoporosis” (6) and the National Osteoporosis Foundation’s (NOF) “Physician’s Guide to Prevention and Treat-ment of Osteoporosis” (7) identify osteoporosis as a major public health concern, and emphasize the importance of using bone mineral density (BMD) test-ing as a clinical tool to diagnose patients at high risk of fracture before the first fracture occurs. This review is intended to provide a simple resource to assist clini-cians in the use of BMD testing for management of osteoporosis.MEASUREMENT OF BMD
Instruments for measuring BMD can be classified according to the technology used, or the part of the skeleton evaluated. Dual-energy X-ray absorptiometry (DXA) instruments measure bone mineral density
(BMD) at the spine and proximal femur. With appro-priate software, many DXA instruments can also mea-sure forearm BMD, total body BMD, and total body composition. DXA measures areal BMD (aBMD) in g/cm2by using ionizing radiation with photon beams
of two different energy levels. The differences in atten-uation of the beams passing through body tissues of variable composition allow the instrument to provide a quantitative measurement of bone density. Bone is composed of mineral, principally calcium hydroxyap-atite, embedded in type I collagen and specialized pro-teins that make up the bone matrix. Bone mineral absorbs much more radiation than soft tissue. The amount of X-ray energy that is absorbed by bone min-eral calcium in a section determines the measured bone mineral content (BMC). BMC divided by the area or volume of the bone estimates BMD. In labo-ratory studies, there is a high correlation (R2= 0.4-0.9)
between BMD and the force needed to break a bone (8,9). Other determinants of bone strength include size (larger bones are stronger), macroscopic structure (long bones with greater cross-sectional areas are more resistant to bending), microscopic structure (micro-scopic cracks and loss of normal trabecular architecture weaken a bone), and the composition of bone proteins (abnormal collagen weakens bones).
DXA is the preferred method for the diagnosis of osteoporosis and monitoring BMD changes over time. Biomechanical studies have shown a strong cor-relation between mechanical strength and BMD mea-sured by DXA (9). Accuracy and precision of DXA are excellent (10). Radiation exposure with DXA is very low (11). In epidemiological studies there is a strong relationship between fracture risk and BMD measured by DXA (12). Most randomized clinical trials showing a benefit with drug therapy have selected subjects based on BMD measured by DXA (13). There is a relationship between decreases in fracture risk with drug therapy and increases in BMD measured by DXA (14). Finally, the World Health Organization (WHO) diagnostic classification of BMD is based primarily on reference data obtained by DXA (15), and does not apply to other technologies for measuring BMD.
Quantitative computed tomography (QCT) measures volumetric BMD (vBMD) in mg/cm3 with
the spine, such osteoarthritis. It can also be used to assess the risk of fracture (17), although issues of cost, accessibility, and radiation exposure render it less attractive than other technologies used for this pur-pose. The primary role of QCT is for clinical research to evaluate bone structure, bone size, and changes in cortical and trabecular bone compartments that occur with drug therapy.
Conventional X-ray techniques are insensitive and subjective in the evaluation of bone density at any skeletal site, requiring 30-40% bone loss before a prob-lem is detected. The best use of X-ray in the manage-ment of osteoporosis is to diagnose fractures, monitor the healing of fractures, and evaluate for skeletal disor-ders that alter the radiographic appearance of bone (e.g., multiple myeloma, osteomalacia). If an X-ray is suggestive of low bone density, a quantitative mea-surement of BMD by DXA is recommended.
BMD testing at peripheral skeletal sites, such as the calcaneus, forearm, finger, or tibia, can be done with technologies that include peripheral dual-energy X-ray absorptiometry (pDXA), peripheral quantitative computed tomography (pQCT), and quantitative ultrasound (QUS). The technologies for pDXA and pQCT are the same as DXA and QCT, respectively, with appropriate adaptation for smaller dedicated instruments. BMD at the finger can also be measured by radiographic absorptiometry (RA), a technique using a conventional X-ray machine in combination with a standardized aluminum wedge to obtain a quantitative measurement. Peripheral devices are gen-erally accurate and precise. The lower the BMD or QUS parameter with a peripheral device, the greater the risk of fracture. A low or borderline low measure-ment should trigger consideration of measuring BMD at the central skeleton by DXA to establish a diagnos-tic classification, determine the need for pharmacolog-ical therapy, and serve as a baseline for monitoring the effects of therapy. While peripheral skeletal sites may potentially play a role in monitoring the BMD response to anabolic therapy, clinical applications have not yet been defined. The WHO classification of BMD for diagnosis should not be applied to T-scores mea-sured with technologies other than DXA, or at skele-tal sites other than the spine, hip, or mid-forearm, because of T-score discordance and lack of large pop-ulation studies to determine device-specific prevalence and fracture risk (18,19). Peripheral skeletal sites should not be used to monitor the effects of antire-sorptive therapy, since the rate of change in BMD and ultrasound parameters is generally too small to be clin-ically useful (18). The acquisition, analysis, and
inter-pretation of BMD tests require training, experience, and continuing education to keep up with advances in the field. BMD studies that are improperly performed or interpreted may lead to inappropriate patient man-agement decisions.
INDICATIONS FOR BMD TESTING
BMD testing should be considered for anyone at risk for fracture, provided the results are likely to influence patient management decisions. Initial BMD testing can confirm a clinical suspicion of high fracture risk, estab-lish diagnostic classification, estimate fracture risk, and serve as a baseline for monitoring BMD changes over time. Serial BMD tests showing a change or stability of BMD may provide helpful clinical information, assum-ing the comparisons are technically valid and the clini-cian is knowledgeable regarding clinical implications. Many organizations have published guidelines or evi-dence-based reviews on the indications for BMD test-ing, including the American Association of Clinical Endocrinologists (20), International Society for Clini-cal Densitometry (ISCD) (21), North American Menopause Society (22), National Institutes of Health (23), National Osteoporosis Foundation (7), United States Preventive Services Task Force (24) and the Brazilian Society for Clinical Densitometry (SBDens) (25). These guidelines vary according to the popula-tions addressed, clinical risk factors considered, defini-tion of fragility fracture, methodologies used, and weighting of levels of medical evidence vs. expert opin-ion. Although clinical risk factors are often used to select patients for BMD testing, they are not a substi-tute for a BMD test, and in fact cannot accurately pre-dict which individual patients have low bone density (26). Of all the published guidelines, those of the ISCD (table 1) are the most comprehensive.
DIAGNOSIS OF OSTEOPOROSIS
DXA BMD results are usually reported as standardized values called T-scores and Z-scores. Both of these rely on the standard deviation (SD) variability or the patient’s BMD compared to the mean BMD of a ref-erence population. BMD ranging from the 5th to the
95th percentile of a population covers about 4 SDs.
A Z-score is the number of SDs below or above the mean BMD value for people of the same age. A Z-score of 0.0 means that the patient has a value that is exactly at the mean for age. A Z-score of -2.0 means that the patient has a BMD at that skeletal site, by that method of measurement that is 2.0 SDs below the mean BMD value of others the same age. A low Z-score (< -2.0 or -3.0) has been suggested by some as a determinant for proceeding with additional evaluation for secondary causes of osteoporosis. While this approach seems intuitive, there is no evidence to vali-date it. Low BMD of any magnitude may be associat-ed with contributing factors other than hormone defi-ciency and aging.
A T-score is the number of SDs below the mean BMD for young-adults (usually 20 to 40-year-old). A T-score of 0.0 means that the patient has a BMD value that is the same as the mean BMD for the young-adult reference population. A T-score of -2.5 means that the patient has a BMD value at that skeletal site and by that method of measurement that is 2.5 SDs below the mean BMD of the young-adult reference population. Since BMD declines with age, T-scores are consistent-ly lower than Z-scores in patients over the age of 40 years, with the difference increasing with advancing age. For example, a 70-year-old patient who has a Z-score of +1.0 at the hip (above average for women of the same age) will have a T-score of about -0.8 (below average compared with young women).
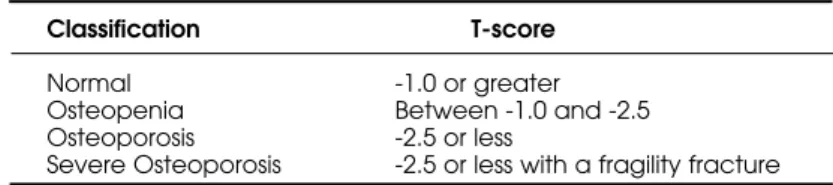
The WHO classification of BMD into cate-gories of normal, osteopenia, osteoporosis, and severe osteoporosis (table 2) has been widely used since its introduction in 1994 (15). This classification has been very successful at increasing public aware-ness of osteoporosis and has provided a method for clinicians to diagnose osteoporosis before the first fragility fracture occurred. The WHO classification is based on the T-score, which is calculated according to the following equation, with BMD values expressed as g/cm2.
T-score=
This equation shows that differences in the young-adult reference population can alter the T-score, even when the patient’s BMD is the same. The absence of a generally recognized standard reference population, expect perhaps for the National Health and Nutrition Examination Survey III (NHANES III) for the hip (27), is in part responsible for discordance of T-scores measured with instruments made by dif-ferent manufacturers, using difdif-ferent skeletal sites, in different world regions. The WHO did not specify which skeletal sites and regions of interest (ROI) should be measured, which technologies can be used to obtain the measurement, which reference popula-tions are appropriate, or how the classification applies to those who are not postmenopausal Caucasian women. Given that these issues have a profound effect on the clinical applications of bone densitometry, the ISCD and SBDens periodically convene position development conferences to consider the medical evi-dence and make recommendations for patient care. The topics selected for consideration are often chosen because there is no overwhelming medical evidence, yet guidance for clinical practice is needed. The methodology for establishing the Official Positions of the ISCD is reviewed elsewhere (28). The ISCD rec-ommends that patients having DXA studies be rou-tinely measured at the lumbar spine and hip, and at the non-dominant forearm if indicated (e.g., obesity exceeding weight limit of table, hyperparathyroidism, or if spine or hip are not valid sites for measuring BMD) (19). The lowest T-score of the lumbar spine, total proximal femur, femoral neck, or 33% radius (one-third radius), if measured, should be used for diagnostic classification. The preferred lumbar spine ROI is L1-L4. One or two vertebral bodies may be excluded from analysis if there are structural abnor-malities that invalidate BMD measurement. Either hip may be measured, since discordance according to side
Table 1.ISCD indications for bone density testing (21). Women aged 65 years and older.
Postmenopausal women under age 65 years with risk factors for osteoporosis. Men aged 70 years and older.
Adults with fragility fracture.
Adults with a disease or condition associated with low bone mass or bone loss. Adults taking medication associated with low bone mass or bone loss.
Anyone being considered for pharmacological osteoporosis therapy. Anyone being treated for low bone mass to monitor treatment effect.
Anyone not receiving therapy in whom evidence of bone loss would lead to treatment. Women discontinuing estrogen should be considered for bone density testing according to the indications listed above.
is usually small (29). The lateral spine, Ward’s area of the hip, peripheral skeletal sites, and other forearm ROIs should not be used for diagnostic classification because they were not considered by the WHO. The ISCD recommends that the WHO classification for diagnosis of osteoporosis be applied to post-menopausal women of all ethnicities and to men age 65 and older (30). Densitometric criteria alone should not be used to diagnose osteoporosis in pre-menopausal women, men under age 50, and children. In children, Z-scores, not T-scores, should be used, since it is not appropriate to compare the BMD of a growing child to an adult, and the relationship between BMD and fracture risk in children is not clear. While diagnostic classification with T-scores is useful for population studies and has greatly improved patient care, additional parameters of bone strength should be considered to estimate the risk of fracture and determine the need for pharmacological therapy.
PREDICTION OF FRACTURE RISK
The relationship between BMD and fracture risk is conventionally quantified by the relative risk (RR) per SD (RR/SD), which is the increase in risk associated with a 1.0 SD decrease in the BMD measurement. For example, an RR/SD of 1.4 means that fracture risk increases by 40% for each 1.0 SD decrease in BMD. A larger RR/SD implies a stronger predictive value of BMD for fracture risk. Factors other than BMD also determine fracture risk. Non-BMD skeletal factors that may be associated with bone strength include bone turnover (31), architecture (size and shape, or bone geometry) (32,33), microarchitecture (e.g., trabecular number, thickness, perforation, and connectivity; cor-tical porosity) (34,35), damage accumulation (36), matrix properties (37), mineralization (38), and crys-tal characteristics (39). With the exception of bone turnover and architecture, none of these are measur-able in clinical practice. BMD testing, on the other hand, is widely available and well correlated with frac-ture risk (12). Non-skeletal risk factors for fracfrac-ture, such as frailty and falls, can be easily evaluated in the
office setting (40). Some risk factors are mediated in both skeletal and non-skeletal ways. For example, advancing age is associated with loss of BMD and with increasing frailty and falls. Vitamin D deficiency can cause loss of BMD as well as loss of muscle strength, increased body sway, and falling (41). Many clinical risk factors for hip fracture have been identified, including personal history of any type of fracture over age 50, maternal history of hip fracture, self-rated fair or poor health, and difficulty rising from a chair (42). The best validated risk factors for vertebral fractures are low BMD, advanced age, and previous fracture of any type (43).
Although RR or RR/SD is a convenient way of reporting the results of observational studies and clin-ical trials, a high RR does not necessarily indicate a high probability of fracture. For example, a 50 year-old woman and an 80 year-woman with the same hip T-score of -2.5 have the same relative risk for hip frac-ture (17.6, comparing each patient to an age-matched population with T-score= 0.0, assuming that relative risk increases by 2.6 for each SD decrease in BMD) (12), yet the 10-year probability of hip fracture is 10 times higher in the older woman (19.4% compared to 1.9%, based on Swedish population data) (44). Expressing fracture risk as the probability of osteo-porotic fracture over a specified period of time is more clinically useful than RR, providing clinicians with a better tool for managing patients.
INTERVENTION THRESHOLDS FOR TREATMENT
Most current treatment guidelines rely on the use of T-score plus risk factors for fracture. In general, treat-ment is recommended when the T-score is below -2.5 or -2.0, or when the T-score is higher and risk factors are present or a fragility fracture has occurred. Guide-lines differ in the populations addressed, T-score cut-offs used, and risk factors that are identified. Method-ologies that calculate cost-effective intervention thresholds based on fracture probability and numerous economic/disutility assumptions may eventually replace treatment recommendations that are currently
Table 2. World Health Organization classification of Bone Mineral Density (15).
Classification T-score
Normal -1.0 or greater
Osteopenia Between -1.0 and -2.5 Osteoporosis -2.5 or less
in use. The NOF (45) and WHO (46) have published models for applying cost utility analysis to a combina-tion of BMD and clinical risk factors for fracture to establish cost-effective thresholds for pharmacological therapy. Application of such models to clinical practice would allow physicians to more effectively target patients most likely to benefit from pharmacological therapy and help to close the treatment gap — the dif-ference between the number of patients who could benefit from treatment and those who are treated. Val-idation of modifiable risk factors that are independent of BMD and application of country-specific economic assumptions will allow this methodology to be adapt-ed to a wide range of circumstances. Cost-effectiveness is one of many considerations for clinicians making management decisions in individual patients.
MONITORING CHANGES IN BMD
When comparing DXA studies, great care must be taken to assure that the comparison is valid and that an apparent difference is a real biological change, not a measurement error. Comparison of measurements made with different instruments, especially ones made by different manufacturers, should not be made due to variable technologies used to generate and detect the dual photon beam, different edge detection algo-rithms, different ROIs, and variable mathematical assumptions on body thickness and composition. Visual assessment of the skeletal image is necessary to determine that 1. positioning is comparable, 2. no arti-fact is present, 3. the same sides are being compared for hip and forearm, 4. labeling of the lumbar spine vertebral levels is the same, and 5. marked bone edges are similar. The measured areas (cm2) of compared
ROIs should be very similar. Absolute BMD and not T-scores should be compared, since T-scores values may change due to changes in reference databases, which may occur without the awareness in the inter-preter due to upgrades of the software. In order to dis-tinguish the likelihood that a true biological change in BMD has occurred and not an error that is inherent in the measurement itself, a “precision assessment” must be performed. This is done according to established methods (47), whereby at least 15 patients have BMD measured there times each, or 30 patients have BMD measured two times each, with subsequent calculation of the precision error and least significant change (LSC) with a 95% level of confidence. A change in BMD that equals or exceeds the LSC is considered to be statistically significant (48). A loss of BMD on
pharmacological therapy is cause for clinical concern, suggesting the possibility of poor adherence to thera-py, inadequate calcium or vitamin D intake, intestinal malabsorption, or other disease process not previously recognized (49). An increase or stabilization of BMD is associated with reduction in fracture risk (14), although other parameters of bone strength, particu-larly changes in bone turnover markers (50), are cor-related with changes in fracture risk as well. Patients started on pharmacological therapy are often retested in 1-2 years in order to determine that there has been no loss of BMD, and retested at longer intervals once response to therapy has been shown. Patients at very high risk for bone loss, such as those on glucocorticoid therapy, may need to be tested as often as every 6 months, until stability of bone mass has been demon-strated.
DXA REPORTING
The quality and clinical utility of DXA reports gener-ated by bone densitometry facilities is variable. To address this issue, the ISCD has recommendations for the minimum components of a DXA report (21). These include identifying the manufacturer and model of the instrument, scan mode, patient name and demographics (date of birth, sex, medical record num-ber), referring provider, indication(s)/risk factors, comment on technical quality and limitations of the test, skeletal site (with side if appropriate) and ROI measured, BMD results in g/cm2, T-score and
Z-score (when appropriate), WHO diagnostic classifica-tion (when appropriate), a statement about fracture risk, and recommendations regarding the necessity and timing of a repeat study, if indicated. A follow-up study should identify the comparator study (location, date, manufacturer, model), the validity of the com-parison, the change in BMD in g/cm2and percent if
it equals or exceeds the LSC (based on measurement of precision and calculation of the LSC at a 95% level of confidence), or a comment that there is no signifi-cant change (stability of BMD) if the difference in BMD is less than the LSC.
NOMENCLATURE
made recommendations for standardization of nomen-clature (51). These include using DXA (not DEXA), T-score (not T score, t-score, t score, or italics with any of these), Z-score (not Z score, z-score, z score, or italics with any of these), expressing T-scores and Zscores with one decimal place (e.g., 2.3, not 2 or -2.34), and BMD with three decimal places (e.g., 0.846 g/cm2, not 0.85 or 0.8472 g/cm2).
BODY COMPOSITION BY DXA
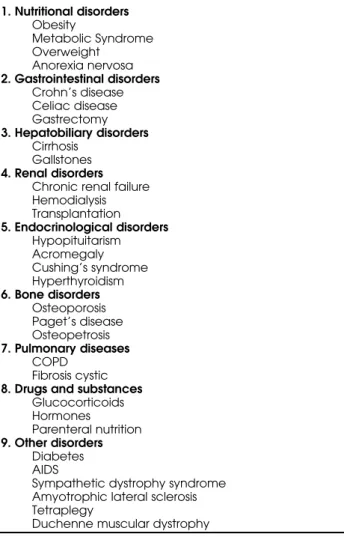
DXA is unquestionably the method of choice for the assessment of bone mass. Recent generations of DXA instruments also have the capability of assessing soft tissue mass, thereby providing a three-compartment model of body composition, i.e., bone mineral, fat, and bone-free lean masses. Although hydrodensitom-etry has long been considered the reference method of assessing body composition, assumptions regarding the constancy of the constituents of fat-free mass may compromise its validity in some populations. Because DXA appears to be less dependent on assumptions regarding biological consistency, it has the potential to provide a more accurate assessment of body composi-tion across populacomposi-tions than dose hydrodensitometry, and therefore is widely considered to be the reference method. DXA has been shown to provide precise mea-sures of body composition. Many disease processes affect bone and soft tissue at the same time. The com-prehensive view of body composition provided by whole body DXA makes it an attractive technique for a variety of clinical research and practice applications (52), as listed in table 3. A model disease for the use of body composition testing is the Metabolic Syn-drome, a cluster of metabolic abnormalities related to a state of insulin resistance which is often associated with a high-risk overweight/obesity phenotype. Because such cluster increases the risk of coronary heart disease (CHD) and type 2 diabetes. Numerous consensus groups have attempted to provide recom-mendations to identify in clinical practice patients with these atherogenic/diabetogenic metabolic abnormali-ties. Although there has been a proliferation of scien-tific papers and conferences on the Metabolic Syn-drome, the ideal body composition is still not well understood. Hendel et al. investigated the relation-ships between body composition by DXA, fat distrib-ution, sex hormone, and other cardiovascular risk fac-tors in overweight postmenopausal women (53). Androgenicity, cigarette smoking, and alcohol con-sumption and age correlate independently and
posi-tively with a central fat distribution (figure 1). Fur-thermore, atherogenic levels of lipids and lipoproteins were independently related to central fat distribution, androgenicity, and low levels of estrogens. Carey et al. investigated the relationship between abdominal fat and insulin sensitivity by DXA in normal and over-weight women (54). In this study, abdominal adiposi-ty appeared to be a strong marker and may be a major determinant of insulin resistance in women. Good-paster et al. studied obese and overweight women and men, using DXA to evaluate abdominal fat and CT to evaluate subcutaneous abdominal fat (55). They con-cluded that subcutaneous fat as a component of cen-tral adiposity is also an important independent marker of insulin resistance in obesity. A relationship between fat distribution, glucose tolerance, and gallstone path-ogenic factors was also demonstrated in obesity with the direct measurements of fat mass by DXA (56). Therefore, DXA is a practical, widely available and pre-cise tool for the measurement of body composition.
Table 3.Clinical applications of whole body DXA in adults.
1. Nutritional disorders
Obesity
Metabolic Syndrome Overweight
Anorexia nervosa
2. Gastrointestinal disorders
Crohn’s disease Celiac disease Gastrectomy
3. Hepatobiliary disorders
Cirrhosis Gallstones
4. Renal disorders
Chronic renal failure Hemodialysis Transplantation
5. Endocrinological disorders
Hypopituitarism Acromegaly Cushing’s syndrome Hyperthyroidism
6. Bone disorders
Osteoporosis Paget’s disease Osteopetrosis
7. Pulmonary diseases
COPD Fibrosis cystic
8. Drugs and substances
Glucocorticoids Hormones
Parenteral nutrition
9. Other disorders
Diabetes AIDS
Sympathetic dystrophy syndrome Amyotrophic lateral sclerosis Tetraplegy
CONCLUSIONS
BMD testing is a clinical tool that can diagnose osteo-porosis or low BMD before the first fracture occurs. Combining BMD with clinical risk factors for fracture provides a better assessment of fracture risk than BMD or clinical risk factors alone. Selection of patients for treatment should be based on fracture risk. Methodolo-gies are emerging for setting intervention thresholds based on the probability of fracture and cost-effective-ness models. The acquisition, analysis, and interpreta-tion of BMD tests require trained and skilled staff. Pre-cision assessment according to established protocols is necessary to determine whether significant changes in BMD have occurred over time. In the clinical manage-ment of patients affected by different chronic diseases, whole body DXA may provide further information about the natural history of the disease, and more importantly, may offer a noninvasive method for deter-mining appropriate nutritional support during disease progression. It can also be used to evaluate and monitor the response to therapeutic interventions.
REFERENCES
1. National Osteoporosis Foundation. America’s Bone
Health: The State of Osteoporosis and Low Bone Mass in Our Nation. Washington: National Osteoporosis Founda-tion, 2002.
2. Riggs BL, Melton LJ III. The worldwide problem of osteo-porosis: insights afforded by epidemiology. Bone
1995;17(suppl):505S-11.
3. Cooper C, Atkinson EJ, Jacobsen SJ, et al. Population-based study of survival after osteoporotic fractures. Am
J Epidemiol 1993;137:1001-5.
4. Center JR, Nguyen TV, Schneider D, et al. Mortality after all major types of osteoporotic fracture in men and women: an observational study. Lancet 1999;353 (9156):878-82.
5. Ray NF, Chan JK, Thamer M, Melton LJ III. Medical expen-ditures for the treatment of osteoporotic fractures in the United States in 1995: Report from the national osteo-porosis foundation. J Bone Miner Res 1997;12:24-35. 6. US Department of Health and Human Services. Bone
Health and Osteoporosis. A Report of the Surgeon Gen-eral. Rockville: US Department of Health and Human Ser-vices, Office of the Surgeon General, 2004.
7. National Osteoporosis Foundation. Physician’s guide to
prevention and treatment of osteoporosis. Washington: National Osteoporosis Foundation, 2003.
8. Courtney AC, Wachtel EF, Myers ER, Hayes WC. Age-related reductions in the strength of the femur tested in a fall-loading configuration. J Bone Joint Surg Am
1995;77(3):387-95.
9. Lotz JC, Cheal EJ, Hayes WC. Fracture prediction for the proximal femur sing finite element models: Part I — Lin-ear analysis. J Biomechan Eng 1991;113:353-60.
10. Mazess R, Chesnut CH III, McClung M, Genant H. Enhanced precision with dual-energy X-ray absorptiom-etry. Calcif Tissue Int 1992;51(1):14-7.
11. Njeh CF, Fuerst T, Hans D, et al. Radiation exposure in bone mineral density assessment. [Review] [86 refs].
Applied Radiation & Isotopes 1999;50(1):215-36. 12. Marshall D, Johnell O, Wedel H. Meta-analysis of how well
measures of bone mineral density predict occurrence of osteoporotic fractures. BMJ 1996;312 (7041):1254-9. 13. Cranney A, Tugwell P, Wells G, Guyatt G. Systematic
reviews of randomized trials in osteoporosis: Introduction and methodology. Endocr Rev 2002;23(4):497-507. 14. Wasnich RD, Miller PD. Antifracture efficacy of
antire-sorptive agents are related to changes in bone density.
J Clin Endocrinol Metab 2000;85(1):231-6.
15. World Health Organization. Assessment of fracture risk
and its application to screening for postmenopausal osteoporosis. Geneva, Switzerland: WHO; 1994.
16. Guglielmi G, Lang TF. Quantitative computed tomogra-phy. Semin Musculoskelet Radiol 2002;6(3):219-27. 17. Lang TF, Keyak JH, Heitz MW, et al. Volumetric
quantita-tive computed tomography of the proximal femur: pre-cision and relation to bone strength. Bone
1997;21(1):101-8.
18. Miller PD, Njeh CF, Jankowski LG, et al. What are the standards by which bone mass measurement at periph-eral skeletal sites should be used in the diagnosis of osteoporosis? J Clin Densitom 2002;5(suppl):S39-S45. 19. Hamdy RC, Petak SM, Lenchik L, International Society for
Clinical Densitometry Position Development Panel and Scientific Advisory Committee. Which central dual X-ray
absorptiometry skeletal sites and regions of interest should be used to determine the diagnosis of osteo-porosis? J Clin Densitom 2002;5(suppl):S11-8.
20. Hodgson SF, Watts NB, Bilezikian JP, et al. American Association of Clinical Endocrinologists medical guide-lines for clinical practice for the prevention and treat-ment of postmenopausal osteoporosis: 2001 edition, with selected updates for 2003. Endocr Pract 2003; 9(6):544-64.
21. The Writing Group for the International Society for Clini-cal Densitometry Position Development Conference 2004. International Society for Clinical Densitometry Posi-tion Development Conference. IndicaPosi-tions and report-ing for dual-energy X-ray absorptiometry. J Clin
Densit-om 2004;7(1):37-44.
22. Management of postmenopausal osteoporosis: position statement of the North American Menopause Society.
Menopause 2002;9(2):84-101.
23. Klibanski A, Adams-Campbell L, Bassford T, et al. Osteo-porosis prevention, diagnosis, and therapy. JAMA
2001;285(6):785-95.
24. Berg AO, Allan JD, Frame PS, et al. Screening for osteo-porosis in postmenopausal women: Recommendations and rationale. Ann Intern Med 2002;137(6):526-8. 25. Sociedade Brasileira de Densitometria. Available at:
<http://www.sbdens.org.br>.
26. Watts NB, Pols H, Ringe JD, et al. Detection of “unex-pected” osteoporosis: insights from the “IMPACT” trial.
Arthritis Rheum 2001;44:S256.
27. Looker AC, Wahner HW, Dunn WL, et al. Updated data on proximal femur bone mineral levels of US adults.
Osteoporos Int 1998;8(5):468-89.
28. The Writing Group for the International Society for Clini-cal Densitometry Position Development Conference 2004. International Society for Clinical Densitometry Posi-tion Development Conference. IntroducPosi-tion, methods, and participants. J Clin Densitom 2004;7(1):13-6. 29. Faulkner KG, Genant HK, McClung M. Bilateral
compar-ison of femoral bone density and hip axis length from single and fan beam DXA scans. Calcif Tissue Int
1995;56(1):26-31.
30. The Writing Group for the International Society for Clini-cal Densitometry Position Development Conference 2004. International Society for Clinical Densitometry Posi-tion Development Conference. Diagnosis of osteoporo-sis in men, premenopausal women, and children. J Clin
Densitom 2004;7(1):17-26.
31. Garnero P, Hausherr E, Chapuy M-C, et al. Markers of bone resorption predict hip fracture in elderly women: The EPIDOS prospective study. J Bone Miner Res
1996;11:1531-8.
32. Myers ER, Wilson SE. Biomechanics of osteoporosis and vertebral fracture. Spine 1997;22(suppl):25S-31S. 33. Gnudi S, Malavolta N, Testi D, Viceconti M. Differences in
proximal femur geometry distinguish vertebral from femoral neck fractures in osteoporotic women. Br J
Radiol 2004;77(915):219-23.
34. Heaney RP. Pathophysiology of osteoporosis. Endocrinol Metab Clin North Am 1998;27(2):255-65.
35. Bell KL, Loveridge N, Power J, et al. Regional differences in cortical porosity in the fractured femoral neck. Bone
1999;24(1):57-64.
36. Burr D. Microdamage and bone strength. Osteoporos Int
2003;14(suppl 5):S67-S72.
37. Blank RD, Baldini TH, Kaufman M, et al. Spectroscopical-ly determined collagen Pyr/deH-DHLNL cross-link ratio and crystallinity indices differ markedly in recombinant congenic mice with divergent calculated bone tissue strength. Connect Tissue Res 2003;4(3-4):134-42. 38. Delmas PD. How does antiresorptive therapy decrease
the risk of fracture in women with osteoporosis? Bone
2000;27(1):1-3.
39. Boskey A. Bone mineral crystal size. Osteoporos Int
2003;14(suppl 5):S16-S21.
40. Suh TT, Lyles KW. Osteoporosis considerations in the frail elderly. [Review] [78 refs]. Curr Opin Rheum 2003;15 (4):481-6.
41. Pfeifer M, Begerow B, Minne HW, et al. Vitamin D status, trunk muscle strength, body sway, falls, and fractures among 237 postmenopausal women with osteoporosis.
Exp Clin Endocrinol Diabetes 2001;109(2):87-92.
42. Cummings SR, Nevitt MC, Browner WS, et al. Risk factors for hip fracture in white women. Study of Osteoporotic Fractures Research Group. N Engl J Med 1995;332 (12):767-73.
43. Van der Klift M, De Laet CE, McCloskey EV, et al. Risk factors for incident vertebral fractures in men and women: the Rotterdam Study. J Bone Miner Res 2004;19 (7):1172-80.
44. Kanis JA, Johnell O, Oden A, et al. Ten year probabilities of osteoporotic fractures according to BMD and diag-nostic thresholds. Osteoporos Int 2001;12(12):989-95. 45. Osteoporosis: review of the evidence for prevention,
diagnosis and treatment and cost-effectiveness analy-sis. Introduction. Osteoporos Int 1998;8(suppl 4):S7-80. 46. Kanis JA, Oden A, Johnell O, et al. The burden of
osteo-porotic fractures: a method for setting intervention thresholds. Osteoporos Int 2001;12(5):417-27.
47. Bonnick SL, Johnston CC Jr, Kleerekoper M, et al. Impor-tance of precision in bone density measurements. J Clin
Densitom 2001;4(2):105-10.
48. Lenchik L, Kiebzak GM, Blunt BA, International Society for Clinical Densitometry Position Development Panel and Scientific Advisory Committee: What is the role of serial bone mineral density measurements in patient man-agement? J Clin Densitom 2002;5(suppl):S29-S38. 49. Lewiecki EM. Nonresponders to osteoporosis therapy. J
Clin Densitom 2003;6(4):307-14.
50. Riggs BL, Melton LJ III. Bone turnover matters: The ralox-ifene treatment paradox of dramatic decreases in ver-tebral fractures without commensurate increases in bone density. J Bone Miner Res 2002;17(1):11-4. 51. The Writing Group for the International Society for
Clini-cal Densitometry Position Development Conference 2004. International Society for Clinical Densitometry Posi-tion Development Conference. Nomenclature and decimal places in bone densitometry. J Clin Densitom
52. Albanese CV, Diessel E, Genant HK. Clinical applications of body composition measurements using DXA. J Clin
Densitom 2003;6(2):75-85.
53. Hendel HW, Gotfredsen A, Andersen I, Hojgaard L, Hilst-ed J. Body composition during weight loss in obese patients estimated by dual energy X-ray absorptiometry and by total body potassium. Int J Obes Relat Metab
Disord 1996;20(12):1111–9.
54. Carey DG, Cowin GJ, Galloway GJ, et al. Effect of rosigli-tazone on insulin sensitivity and body composition in type 2 diabetic patients. Obes Res 2002;10(10):1008-15. 55. Goodpaster BH, Thaete FL, Simoneau JA, Kelley DE.
Sub-cutaneous abdominal fat and thigh muscle composi-tion predict insulin sensitivity independently of visceral fat. Diabetes 1997;46(10):1579-85.
56. Hendel HW, Hojgaard L, Andersen T, et al. Fasting gall bladder volume and lithogenicity in relation to glucose tolerance, total and intra-abdominal fat masses in obese non-diabetic subjects. Int J Obes 1998;22:294-302.
Address for correspondence:
E. Michael Lewiecki
New Mexico Clinical Research & Osteoporosis Center 300 Oak St. NE, Albuquerque, New Mexico 87106 USA