Article
Printed in Brazil - ©2017 Sociedade Brasileira de Química0103 - 5053 $6.00+0.00*e-mail: [email protected]
Tilapia (
Oreochromis niloticus
) as a Biondicator of Copper and Cadmium Toxicity.
A Bioavailability Approach
Maria A. Silva,a Tatiana C. S. Motta,a Diogo B. Tintor,b Thiago A. Dourado,b
Amanda L. Alcântara,b Amauri A. Menegáriob and José R. Ferreira*,a,c
aCentro de Energia Nuclear na Agricultura, Universidade de São Paulo (USP),
Av. Centenário, 303, 13400-970 Piracicaba-SP, Brazil
bCentro de Estudos Ambientais, Universidade Estadual Paulista (UNESP),
Av. 24A, 1515, 13506-900 Rio Claro-SP, Brazil
cPolo Regional Centro Sul, Agência Paulista de Tecnologia do Agronegócio (APTA),
Rod. São Paulo 127, Km 30, 13400-970 Piracicaba-SP, Brazil
The acute toxicity of copper and cadmium in Oreochromis niloticus was evaluated through a 96 h static assay. Precipitation of Cu and co-precipitation of Cd in the presence of Cu were noted, being indicative of differences in nominal and actual concentrations of metals. Under these conditions, LC50-96h was determined as 3.53 mg L-1 Cu, 20.1 mg L-1 Cd and 1.36 mg L-1 (Cu + Cd). Besides the quantitative determinations of total dissolved metals in water, considerations on Cd/Cu interactions in aquatic media were presented, allowing the assessment for metals speciation. Data revealed that alkalinity, hardness, dissolved organic carbon and formation of inorganic complexes reduce metal availabilities, mainly in relation to Cu. In spite of this, the LC50 for Cd was significantly reduced in the presence of Cu, matching environmental realistic values. Based on simulated fate of metals, hardness may impair a reduction of 18 and 2% in metal activities, respectively to Cu and Cd.
Keywords: Oreochromis niloticus, metals acute toxicity, bioindicator, chemical speciation, bioavailability
Introduction
Cadmium and copper have been intensively investigated
through fish bioassays in acute and chronic exposures.1-11
The contamination of aquatic ecosystems by these metals is a consequence of the rapid population growth, increased urbanization, expanded agricultural activities and exploitation of natural resources, threatening the biota in
these ecosystems.9,12,13
Cadmium, a non-essential metal, has been investigated in environmental studies due to its toxicity to marine species, even when present in low concentrations. Exposure to this chemical element may disturb the central functions and physiological processes, thus leading to diseases in
organisms.4,14,15 Cadmium exposure may lead to adverse
effects on fish growth, reproduction, liver (and other organs) functions and inhibition of calcium uptake by
the gills, causing hypocalcemia, which represents the key
mechanism of toxicity induced by this metal.4,16
Copper is an essential element which plays an important role in cellular metabolism of organisms. When present in
higher concentrations, however, it may become toxic.13 The
effects of copper toxicity in fish include histopathological alterations in the liver and gills, growth reduction, oxidative stress damage to hepatic metabolism and
inhibition of enzymes activity Na+/K+-ATPase, resulting
in Na+ homeostasis break down.17,18 In this context, several
experiments have been carried out with tilapia, generally
involving the species Oreochromis niloticus and Oreochromis
mossambicus used as indicator organisms in field surveys.7,19
In view of its easy handling, adaptation to confinement, laboratory maintenance, susceptibility to various pollutants
and economic importance, the species O. niloticus has
been widely used in environmental studies as well as in evaluating the toxicity of contaminants in aquatic
In the present work, the average lethal concentrations
estimated (LC50-96h)for CuCl2, CdCl2 and their combinations
in O. niloticus were determined. Emphasis was given to the acute poisoning signs in fish under stress conditions to these chemicals during experimental exposures. To the best knowledge of the authors, the combined toxicity of mixed
solutions of CuCl2 + CdCl2 to this species was demonstrated
for the first time.
As fish under stress conditions produce metallothioneins (Mts) as a response for essential and non-essential metals uptake, another objective of this work was to predict concentrations of the investigated metals in order to
assess for the dynamic of Mts formation in O. niloticus
at sub-lethal levels inducing its formation in a given concentration interval. In addition, several aspects related to the fish bioassay structure and operation were found out. Finally, under the established conditions, the availability of both metals to fish were simulated by using an aquatic speciation model.
Experimental
All research protocols in this work followed guidelines
of the Environmental Protection Agency23 and Associação
Brasileira de Normas Técnicas (ABNT: NBR 15088)24
for acute toxicity test with fish, handling animals gently and carefully to minimize stress. Regarding disposal, all organisms, including control, were humanely destroyed according to an appropriate manner. All effluents were properly purified before discharge.
Juvenile specimens of O. niloticus with an average weight
of 10 g were collected at fish farms and transported to the laboratory in plastic bags containing up to 100 individuals. Prior to the experiments, fish were acclimated in 500 L water tanks during a 20 day period and offered 32% protein extruded feed. The water from these tanks was purified through a system of Dry-type Wet filtration, and flow rate
was 3.0 L h-1.
The water used for acclimation and experimentation came from a local potable network supply, following a minimum 48 h residence time to allow spontaneous dechlorination.
During the acclimation period, physico-chemical variables were daily checked and mortalities were taking into account. The water temperature was maintained as 26 ± 1 °C, by using an electronic 300 W heater, and a photoperiod of 12 h light and 12 h dark was set. These procedures were maintained for the whole experimental
period, according to ABNT: NBR 15088.24
Experiments with copper chloride, cadmium chloride or combinations of both were carried out during a 96 h period, for
determining the acute toxicity of the metals to O. niloticus.
Assays were performed in static exposure system. Concentrations for acute toxicity assays were selected in preliminary tests, during 48 h. Values were established in the range of the highest nominal concentration of toxic agent in which no lethality was observed (NOEC) and the lowest nominal concentration of toxic agent which caused
100% lethality of organisms (LOEC).23
Metal concentrations related to static acute toxicity tests for copper chloride and copper plus cadmium chlorides
were: 0, 0.5, 1.0, 2.5, 5.0 and 10.0 mg L-1 and for cadmium
chloride 0, 1.0, 5.0, 10.0, 25.0 and 50.0 mg L-1. All tests
were performed in triplicate, involving the placement of 10 fish inside a 60 L resistant plastic aquarium filled with 40 L solution. In the experimental tanks, fish were subjected to a second 48 h period of acclimation. Fish were not fed
24 h prior to the start of acute toxicity tests.23,24
Temperature, pH, dissolved oxygen, ammonium, total dissolved copper and cadmium were monitored at the beginning of the tests and at every 24 h, whereas total hardness was checked only at the beginning and at the end of the assays in the controls.
A mobile multiple analyzer YSI Incorporated 556 MPS (Ohio, USA) was used for temperature, pH and dissolved oxygen quantification. Total metals were determined with a series 6000 inductively coupled plasma optical emission spectrometer (ICP OES) from Thermo Scientific (Waltham, USA). Total hardness was determined by
ethylenediaminetetraacetic acid (EDTA) titration,25 and
ammonia (NH3-N) obtained by calculation, taking into
account the ammonium ion quantification (NH4-N)
determined by flow injection conductometry,26 as well as pH
and temperature of the water samples.23 The NH
3 contents
were estimated based on the reversible reactions between
NH4 and NH3 assessed by the pH values and aquarium
temperatures during water sample collections. Previously to chemical analysis, the water samples were filtered through a 0.45 µm filter. Concentrations of metals were quantified in
terms of its most toxic fraction to fish, i.e., soluble metals.
Alkalinity was estimated by the WHAM 7.0 model.27
Through the mathematical model, metals speciation were calculated as well. To this end, three concentrations of metals, in isolated and in combined conditions, with the minimum and maximum values of hardness were selected. Ammonium ion and temperature were measured at the aquariums.
Statistical analysis to assess for the dosage against effect on the biota for the specific metal and its combination involved analysis of variance with the SAS System. For differences among treatments the statistical method
Trimmed Spearman-Karber28 was used, determining the
LC50-96h, all calculations were performed by the statistical
computer program LC50 Programs JSPear Test, Montreal,
Canada.
Results and Discussion
The water quality data (Table 1) were similar among treatments, thus reducing the possibility of mortality due to the water quality alterations; these values were within
the recommended ranges.23
Levels of ammonia were included in the above statement and in all situations, according to the temperature and pH of
the bioassay conditions, the ammonia concentrations were much lower than those that caused mortalities for larvae
and fingerlings of O. niloticus.29
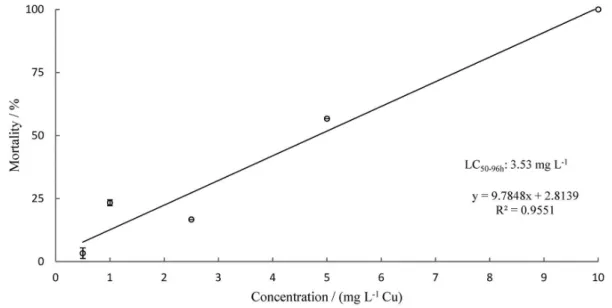
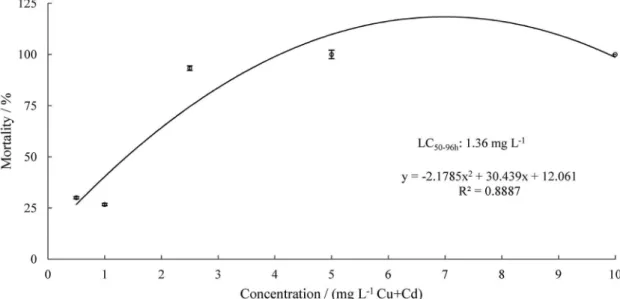
Figures 1, 2 and 3 show the percentage mortalities
obtained in each of the acute tests with CuCl2, CdCl2.H2O
and CuCl2 + CdCl2.H2O during the exposure period of
96 h, respectively.
Statistical variance analysis indicates that mortality is explained by metal concentration, as the determination
coefficients were high, R2(Cu) = 0.9551, R2(Cd) = 0.9522
and R2(Cu + Cd) = 0.8885. The low R2(Cu + Cd) can be
due to the chemical interactions between the two metals in combination, as discussed below, indicating how complex this link can be.
According to Klemm et al.,30 the mortality rates for
the control treatments in the three assays were within acceptable limits, as control mortalities did not exceed 20%
Table 1. Range of variation for pH, temperature, D.O, total hardness and ammonia determined in the experimental aquariums used to establish the acute toxicity 96 h test with O. niloticus
Control CuCl2 CdCl2.H2O CuCl2 + CdCl2.H2O
Temperature / °C Min 24.45 ± 0.85 25.23 ± 0.05 23.57 ± 0.01 24.28 ± 0.04
Max 25.44 ± 0.30 25.87 ± 0.02 25.50 ± 0.07 25.64 ± 0.07
pH Min 6.91 ± 0.29 6.74 ± 0.55 6.64 ± 0.03 6.80 ± 0.00
Max 7.42 ± 0.12 7.74 ± 0.07 7.20 ± 0.09 7.60 ± 0.00
D.O / (mg L-1) Min 7.38 ± 0.39 7.58 ± 0.11 6.77 ± 0.17 7.06 ± 0.92
Max 8.19 ± 0.22 8.83 ± 0.29 8.28 ± 0.45 8.56 ± 0.20
Ammonia / (mg L-1) Min 0.02 ± 0.01 0.01 ± 0.00 0.01 ± 0.00 0.01 ± 0.00
Max 0.08 ± 0.03 0.10 ± 0.02 0.04 ± 0.01 0.13 ± 0.03
Total hardness / (mg L-1 CaCO
3) Min 68.54 ± 0.25 − − −
Max 84.30 ± 0.14 − − −
Min: minimum values of the parameters; Max: maximum values of the parameters; D.O: dissolved oxygen.
for the entire 96 h period. In addition, the % of mortality standard deviations were low in the concentration ranges for all three treatments.
Figure 3 presents evidence of the effect resulting from
the combination of CuCl2 + CdCl2.H2O solutions, which
leads to higher mortality percentages in comparison with exposure to either metal in isolation. This assessment is
confirmed by the lethal concentrations (LC50-96h) for the tests
of acute toxicity of these metals in different combinations.
Lethal concentration (LC50) values (95% confidence
intervals) were 3.53 mg L-1, with upper (UL) and lower (LL)
limits of 4.42 to 2.82 mg L-1 for copper chloride, 20.1 mg L-1
with UL and LL of 23.3 to 17.4 mg L-1 for cadmium chloride
and 1.36 mg L-1 with UL and LL of 1.59 to 1.16 mg L-1 for
copper chloride + cadmium chloride.
Evaluating the response of O. niloticus to CuSO4 and
K2Cr2O7 in tests with single metals, Masutti et al.31 found
that this species has a higher sensitivity to copper than to
potassium chromate, with LC50-96h ranging from 0.32 to
0.65 mg L-1. Seddek32 determined the toxicity of copper
as CuSO4 for this species, finding values for LC50-96h of
7.98 mg L-1 Cu, significantly higher than the results of
Masutti et al.31 These differences can be linked to the
chemical form of the metal since different salts were used and water chemistry. Cu toxicity is enhanced in low
alkalinity waters and at low pH.33,34
Figure 2. Mortality (%) of Oreochromis niloticus, as a function of metal concentration in the 96 h acute toxicity test with CdCl2.H2O.
Oransaye and Ogunbor35 determined LC
50-96h values of
1.0, 0.68 and 0.60 mg L-1 Cu2+ for fingerlings of O. niloticus
after 4, 9 and 10 days, respectively, showing the response of toxicity with exposure time.
Results obtained in this study for CdCl2.H2O in
O. niloticus are close to those found by Annune et al.,36
in which the LC50-96h were 19.3 mg L-1 Cd, whereas
Garcia-Santos et al.37 found a LC
50-96h of 14.8 mg L-1 Cd for
the same species. At a first glance, it could be concluded
that O. niloticus is quite resistant to Cd, and therefore
not a suitable bioindicator for assessing the presence and the availability of metal in the environment. Before confirming this statement, it should be important to mention that among water properties, hardness and alkalinity are important parameters in the potential toxicity of Cd. In the experimental conditions, fish acclimation was carried out with the same water as the control treatment, which constitutes a protection to fish when transferred to water in the presence of Cd. The 96 h period is not enough to disturb the protection mechanism of Ca against Cd uptake from
the water by the gill and can explain the fish tolerance.33
Certainly the LC50 for Cd would be lower for low alkalinity
waters (12.0 mg L-1). On the other hand, the resistance
of this species could be exploited in the investigation of the fate and interaction processes of this metal in aquatic
organisms.37
It should be stressed that the above mentioned authors did not mention differences between nominal and measured dissolved metal concentrations (actual). Also, considerations of metal fate in relation to pH were not discussed in details. These assertions are justified, since differences can be expected in these concentrations, due to solubility products of metals, co-precipitation, adsorption on walls, among others.
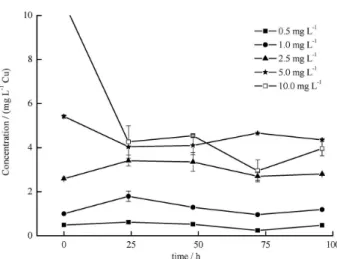
As demonstrated in Figures 4 and 6, which represent the
temporal variations of Cu2+ and Cu2+ + Cd2+, a sharp decline
of Cu2+ at the concentration 10.0 mg L-1 Cu was observed.
The reduction was caused by precipitation, due to the low
solubility of copper hydroxide (Kps Cu(OH)2 = 1.60 × 10⁻¹⁹)
and pH values during the test, 6.74 to 7.74. According to
Çoğun and Kargin,13 high values of pH contribute to
diminish the copper solubility.
Precipitation was not observed during the test
with CdCl2.H2O, which proved to be stable during the
experimental period (Figure 5). The solubility product
of cadmium hydroxide (Kps Cd(OH)2 = 5.30 × 10⁻¹⁵)
is four orders of magnitude higher than that of cupric hydroxide, keeps metal stabilized in solution, even in higher concentrations and pH values used in the tests. Reductions in Cd concentration for metals in combination were due to the co-precipitation induced by Cu (Figure 6).
Figure 4. Temporal variation of copper concentrations obtained at every 24 h for the acute toxicity test in a 96 h period. Data refer to the metal actual concentrations of 0.5, 1.0, 2.5, 5.0 and 10.0 mg L-1 Cu (CuCl
2) solutions.
Figure 5. Temporal variations of cadmium concentration obtained every 24 h for the acute toxicity test in a 96 h period. Data refer to the metal actual concentrations of 1.0, 5.0, 10.0, 25.0 and 50.0 mg L-1 Cd (CdCl
2.
H2O) solutions.
Figure 6. Temporal variations of copper and cadmium concentrations obtained every 24 h for the acute toxicity test in a 96 h period. Data refer to the metal actual concentrations of 0.5, 1.0, 2.5, 5.0 and 10.0 mg L-1
(Cu + Cd), as CuCl2 and CdCl2.H2O salts in mixed solutions. In all
Figures 4 to 6 denote the fate of Cu and Cd in the systems. Cu presented similar behavior at almost all concentrations, either alone or in combination. An exception
was noted at 5.0 mg L-1 Cu, where the precipitation was
slightly higher when the metals were mixed. Cadmium, which was approximately stable up to concentrations as
high as 25.0 and 50.0 mg L-1, presented distinct behavior
at 10.0 mg L-1 for both situations. Cadmium concentration
decreased when in combination with Cu, as explained earlier. Reductions observed for nominal concentrations
of 25.0 and 50.0 mg L-1 Cd, are due to either adsorption to
walls, or absorption of metal by fish.
Differences in actual and nominal concentrations were
significative for 10.0 mg L-1 Cu, for both isolated and in
combination with Cd (Figures 4 and 6). Highest percentage
of mortality occurs at 10.0 mg L-1 Cu (Figures 1 and 4)
and nearly 60% of deaths were achieved for 5.0 mg L-1
Cu (Figure 1). Although the nominal concentration was reduced to the half during the first 24 h period (Figure 4), the 100% mortality observed in this treatment demonstrated that fish intake of Cu during the 24 h period is determining for fish response to the environmental stress, while nominal concentration was being reduced. A similar fate of Cu in solution was verified for the two metals in combination (Figure 3). In this case, due to the additional effect, 100%
mortality was verified at 5.0 mg L-1 for Cu and Cd. In these
situations, the kinetic of precipitation of Cu occurring in the first 24 h period persisted, still influencing fish toxicity.
Differences between expected and obtained concentrations show the importance of monitoring the chemical species of interest in a toxicity assay, considering that the actual concentrations of these chemicals must be used for obtaining the concentration factor, bioaccumulation and aquatic biomagnification data.
Due to all advantages in using this species for fish
bioassays,20-22 these characteristics can, in fact, rank this
species as a useful bioindicator in metal interactions to fish, allowing to assess for important mechanisms responses, like the Mts formation induced by metal stress. However, there has been an increasing appreciation of the need for studying sub-lethal effects and some growing interest in the physiological mechanisms by which various pollutants affect fish populations in the wild. In this sense, dosages
for experimental work should be based on the LC50, which
determines the optimum range for experiments, at levels that do not cause any acute toxicity.
Under the above described conditions, fish were affected with a formation of hypersecretion of mucus by the gills and
skin at higher concentrations of Cu (5.0 and 10.0 mg L-1)
and Cd (25.0 and 50.0 mg L-1) isolated and in combination
(5.0 and 10.0 mg L-1). According to Heath,38 this is a
protective mechanism against contamination, decreasing metal absorption through chelation and inhibition of diffusion. When excessive, this process can hamper the gas exchange, which explains why some fish appeared to be seeking oxygen at the air-water interface. This behavior is an additional component of the interference of metals
with the respiratory mechanism and fish physiology.38,39
Another observed response was the presence of reddish spots in the body, especially in the contour of the lip in organisms exposed to copper isolated and in combination at
concentrations of 10.0 mg L-1 Cu and 10.0 mg L-1 (Cu + Cd).
This is due to the rapid loss of electrolytes from the body.40
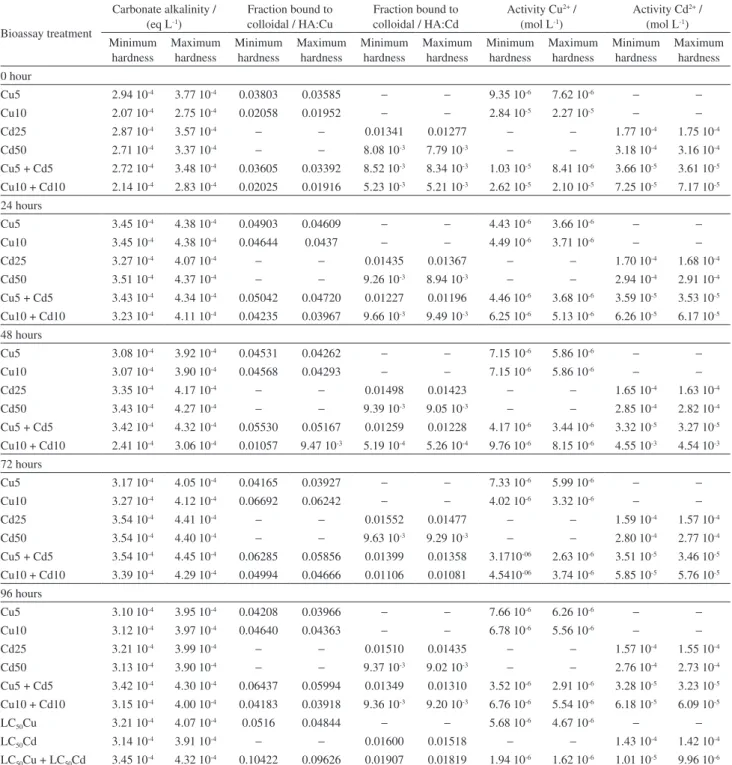
Chemical speciation - Wham 7.0 mathematical model
The fate of Cu and Cd in the acute toxicity bioassay were assessed by the WHAM model, version 7.0. On Table 2, it is summarized the data obtained from the model output files.
Among the wide possibilities of evaluation, treatments
involving 5.0 and 10.0 mg L-1 Cu, 25.0 and 50.0 mg L-1 Cd
and 5.0 and 10.0 mg L-1 Cu + Cd for the entire period of
96 h were selected. In addition, the model was also applied
for metals LC50 concentrations (Table 2). The choices were
based on metals equilibrium constants and on the Figures 4, 5 and 6, which allow the calculation of metals actual concentrations. The solubilities of metals with time were stable for lower concentrations. A slight variations on metal concentrations were also a function of re-establishment of solutions up to the initial 40 L volume, required for static bioassays (Figures 4, 5 and 6).
For the input files, the model was feed with the molar
salts composition and NH4, excreted by fish. The model
was run twice, considering the minimum and maximum hardness values in the assays (Table 1). The dissolved
organic carbon was fixed for all situations as 2.0 × 10⁻³ g L-1
humic acid in colloidal phase.34
It was verified that Cu and Cd interact with hydroxide, carbonate and chloride forming inorganic complexes with very low activities. These complexes were in general less concentrated to Cd than to Cu. Metal hydroxides varied from 10-10 to 10-7 mol L-1 and 10-7 to 10-5 mol L-1 for Cd
and Cu, respectively. The same figures were followed for both metals in combination. For carbonates these activities
were in the range of 10-10 to 10-6 mol L-1 to Cd and 10-8 to
10-5 mol L-1 to Cu. When combined, the range of variation
was narrower for Cd, varying from 10-10 to 10-7 mol L-1
and maintained for Cu. With chlorides, the range of molar
activities varied from 10-9 to 10-5 mol L-1 to Cd isolated and
10-11 to 10-6 mol L-1 in metals combination conditions. Cu
According to the model calculation only one chloride
complex was observed with Cu (CuCl+) and two of them
were formed with Cd (CdCl+; CdCl
2).
During the whole experiment, alkalinity varied in
the range of 2.07 to 3.45 10-4 eq L-1 for the low hardness
water and from 2.75 to 4.45 10-4 eq L-1 to the higher
hardness water. Without any exception, an increase in
hardness led to an increase in alkalinity. The free ion activity of both metals diminished when both of these variables were increased in the observed experimental pH variation. Metals inorganic complexes compete with DOC (dissolved organic carbon), as an increase in these variables reduced the metal fraction bounded to the colloidal humic acid. The fraction of Cu bounded to the Table 2. Carbonate alkalinity and important data of Cu and Cd speciation chemistry calculated by WHAM 7.0 model in the 96 h static bioassay test, considering the minimum and the maximum hardness concentrations observed in the aquariums and LC50 for Cu, Cd and Cu + Cd
Bioassay treatment
Carbonate alkalinity / (eq L-1)
Fraction bound to colloidal / HA:Cu
Fraction bound to colloidal / HA:Cd
Activity Cu2+ /
(mol L-1)
Activity Cd2+ /
(mol L-1)
Minimum hardness
Maximum hardness
Minimum hardness
Maximum hardness
Minimum hardness
Maximum hardness
Minimum hardness
Maximum hardness
Minimum hardness
Maximum hardness 0 hour
Cu5 2.94 10-4 3.77 10-4 0.03803 0.03585
− − 9.35 10-6 7.62 10-6 − −
Cu10 2.07 10-4 2.75 10-4 0.02058 0.01952
− − 2.84 10-5 2.27 10-5 − −
Cd25 2.87 10-4 3.57 10-4
− − 0.01341 0.01277 − − 1.77 10-4 1.75 10-4
Cd50 2.71 10-4 3.37 10-4
− − 8.08 10-3 7.79 10-3 − − 3.18 10-4 3.16 10-4
Cu5 + Cd5 2.72 10-4 3.48 10-4 0.03605 0.03392 8.52 10-3 8.34 10-3 1.03 10-5 8.41 10-6 3.66 10-5 3.61 10-5
Cu10 + Cd10 2.14 10-4 2.83 10-4 0.02025 0.01916 5.23 10-3 5.21 10-3 2.62 10-5 2.10 10-5 7.25 10-5 7.17 10-5
24 hours
Cu5 3.45 10-4 4.38 10-4 0.04903 0.04609
− − 4.43 10-6 3.66 10-6 − −
Cu10 3.45 10-4 4.38 10-4 0.04644 0.0437
− − 4.49 10-6 3.71 10-6 − −
Cd25 3.27 10-4 4.07 10-4
− − 0.01435 0.01367 − − 1.70 10-4 1.68 10-4
Cd50 3.51 10-4 4.37 10-4
− − 9.26 10-3 8.94 10-3 − − 2.94 10-4 2.91 10-4
Cu5 + Cd5 3.43 10-4 4.34 10-4 0.05042 0.04720 0.01227 0.01196 4.46 10-6 3.68 10-6 3.59 10-5 3.53 10-5
Cu10 + Cd10 3.23 10-4 4.11 10-4 0.04235 0.03967 9.66 10-3 9.49 10-3 6.25 10-6 5.13 10-6 6.26 10-5 6.17 10-5
48 hours
Cu5 3.08 10-4 3.92 10-4 0.04531 0.04262
− − 7.15 10-6 5.86 10-6 − −
Cu10 3.07 10-4 3.90 10-4 0.04568 0.04293
− − 7.15 10-6 5.86 10-6 − −
Cd25 3.35 10-4 4.17 10-4
− − 0.01498 0.01423 − − 1.65 10-4 1.63 10-4
Cd50 3.43 10-4 4.27 10-4
− − 9.39 10-3 9.05 10-3 − − 2.85 10-4 2.82 10-4
Cu5 + Cd5 3.42 10-4 4.32 10-4 0.05530 0.05167 0.01259 0.01228 4.17 10-6 3.44 10-6 3.32 10-5 3.27 10-5
Cu10 + Cd10 2.41 10-4 3.06 10-4 0.01057 9.47 10-3 5.19 10-4 5.26 10-4 9.76 10-6 8.15 10-6 4.55 10-3 4.54 10-3
72 hours
Cu5 3.17 10-4 4.05 10-4 0.04165 0.03927
− − 7.33 10-6 5.99 10-6 − −
Cu10 3.27 10-4 4.12 10-4 0.06692 0.06242
− − 4.02 10-6 3.32 10-6 − −
Cd25 3.54 10-4 4.41 10-4
− − 0.01552 0.01477 − − 1.59 10-4 1.57 10-4
Cd50 3.54 10-4 4.40 10-4
− − 9.63 10-3 9.29 10-3 − − 2.80 10-4 2.77 10-4
Cu5 + Cd5 3.54 10-4 4.45 10-4 0.06285 0.05856 0.01399 0.01358 3.1710-06 2.63 10-6 3.51 10-5 3.46 10-5
Cu10 + Cd10 3.39 10-4 4.29 10-4 0.04994 0.04666 0.01106 0.01081 4.5410-06 3.74 10-6 5.85 10-5 5.76 10-5
96 hours
Cu5 3.10 10-4 3.95 10-4 0.04208 0.03966
− − 7.66 10-6 6.26 10-6 − −
Cu10 3.12 10-4 3.97 10-4 0.04640 0.04363
− − 6.78 10-6 5.56 10-6 − −
Cd25 3.21 10-4 3.99 10-4
− − 0.01510 0.01435 − − 1.57 10-4 1.55 10-4
Cd50 3.13 10-4 3.90 10-4
− − 9.37 10-3 9.02 10-3 − − 2.76 10-4 2.73 10-4
Cu5 + Cd5 3.42 10-4 4.30 10-4 0.06437 0.05994 0.01349 0.01310 3.52 10-6 2.91 10-6 3.28 10-5 3.23 10-5
Cu10 + Cd10 3.15 10-4 4.00 10-4 0.04183 0.03918 9.36 10-3 9.20 10-3 6.76 10-6 5.54 10-6 6.18 10-5 6.09 10-5
LC50Cu 3.21 10-4 4.07 10-4 0.0516 0.04844 − − 5.68 10-6 4.67 10-6 − −
LC50Cd 3.14 10-4 3.91 10-4 − − 0.01600 0.01518 − − 1.43 10-4 1.42 10-4
LC50Cu + LC50Cd 3.45 10-4 4.32 10-4 0.10422 0.09626 0.01907 0.01819 1.94 10-6 1.62 10-6 1.01 10-5 9.96 10-6
colloidal humic acid was higher in comparison to Cd (Table 2). The bioavailability and toxicity of Cd was less
affected by DOC than the other metals.41
This can confirm that toxicity decreases as hardness and alkalinity increase. This could be expected for both metals, although hardness had a minor effect on Cu solubility, but can protect fish in low alkalinity waters by Ca competition
with divalent metals.33 By considering the water properties
and metals interactions with the water components, WHAM
model revealed that the availability of the free Cu2+ was
reduced in 18% in the hardness interval of this experiment,
whereas for Cd2+ only a 2% reduction was verified, being
Cu more affected than Cd.42 For both metals, the free
ions concentration reductions were stable from 0 to 96 h (Table 2), indicating good experimental conditions. The intensity of interactions of both metals differs, resulting that the Cd free ion is one order of magnitude higher than that of Cu free ion. It can also be observed that the fraction bounded to the humic acid was reduced as metals concentrations increased. This is probably to the saturation
of active sites in the colloidal phase.43
If one take into account the above described interactions
for the metals at LC50 concentrations it can be seen that
the free Cu ion (Cu2+) was 10.2% for low hardness water
and 8.4% for the higher hardness. Cadmium availability
of the free ion (Cd2+) varied only from 82 to 81.6% under
the same water conditions. When combined, the free ion availability would be in the range of 9.2 to 7.7% for Cu and 84.1 to 83% for Cd. In other words, in the hardness range in which these assays were carried out, the metal
fractions available on LC50 concentrations were only
0.35 to 0.28 mg L-1 Cu (LC
50 = 3.53 mg L-1 Cu); 16.48
to 16.40 mg L-1 Cd (LC
50 = 20.10 mg L-1 Cd). For the
two metals combined, 0.12 to 0.10 mg L-1 Cu and 1.14
to 1.13 mg L-1 Cd (LC
50 = 1.36 mg L-1 Cu + Cd). These
values are more realistic for Cu, but still not for Cd isolated. Although it is stated that Cd toxicity diminished as hardness increased, pH influence is biphasic increasing toxicity below pH 7.0 and diminished again if it goes further down (pH 5.50), the water chemistry do not alter the speciation
of Cd as it does for Cu.42 It should be denoted that under
the assay conditions, in combination the toxicity of Cd to tilapia was well reduced.
Although this particular species appears to be highly
tolerant to Cu and Cd, with LC50 values out of the
environment realism, the fate of metals in the medium is a characteristic of the specific site, which can impair and conditioning the free ion activity, which is the one available to the biota. Inasmuch metals do not occur alone in a natural environment, an additive effect like the one mentioned in this paper should be considered.
Conclusions
The static bioassay system was stable during the entire period of the experiment, observed by the physico-chemical variables data measured at every 24 h. In this sense, fish response was only due to the effects of the studied chemicals.
The fate of metals depends not only on their inherent characteristics, but also on the abiotic medium composition. The low solubility product of Cu hydroxide in the pH
experimental range acts upon Cd at 10 mg L-1 (Cu + Cd)
through a co-precipitation when combined.
When considering both actual metal concentrations and bioavailable metal fractions to the biota, assessed by
the mathematical speciation model, the LC50 can reach
environmental realistic concentrations. This could not be stated in the Cd isolated assay, but only when this metal is in combination with Cu.
The acute toxicity of Cd and Cu to tilapia differs significantly, being higher for Cu, an essential element, than for Cd, which has no recognized biological function.
In combination (Cu + Cd), the LC50 is decreased nearly two
fold compared to that observed for Cu.
To state if tilapia is a good or not so good bio-indicator of Cd and Cu toxicity there is a need to consider not only the nominal metal concentrations, but also the characteristics of the abiotic medium which implies metals bioavailability.
Supplementary Information
Supplementary Information (water chemistry interactions conditioning metals availability) is available free of charge in PDF file at http://jbcs.sbq.org.br.
Acknowledgments
The authors express their gratitude to Fundação de Amparo à Pesquisa do Estado de São Paulo (FAPESP), SP, Brazil, for providing financial support to this research (Process No. 2010/19588-0) and the MSc scholarship to M. A. S. (Process No. 2010/14021-1).
References
1. Gupta, A. K.; Rajbanshi, V. K.; Acta Hydrochim. Hydrobiol.
1991, 19, 331.
2. Hartwell, S. I.; Alden, R. W.; Wright, D. A.; Ailstock, S.; Kerhin, R.; Environ. Toxicol. Chem 2000, 19, 1753.
3. Nogami, E. M.; Kimura, C. C. M.; Rodrigues, C.; Malagutti, A. R.; Lenzic, E.; Nozaki, J.; Ecotoxicol. Environ. Saf.2000,
4. Almeida, J. A.; Novelli, E. L. B.; Silva, M. D. P.; Junior, R. A.;
Environ. Pollut.2001, 114, 169.
5. Mansour, S. A.; Sidky, M. M.; Food Chem.2003, 82, 181. 6. Arkhipchuk, V. V.; Garanko, N. N.; Ecotoxicol. Environ. Saf.
2005, 62, 42.
7. Eroglu, K.; Atli, G.; Canli, M.; Bull. Environ. Contam. Toxicol. 2005, 75, 390.
8. Murano, H.; Matsuzaki, K.; Shiraishi, H.; Wakabayashi, M.;
Fish Sci.2007, 73, 1078.
9. Atli, G.; Canli, M.; Environ. Toxicol. Pharmacol.2008, 25, 33. 10. Costa, P. M.; Diniz, M. S.; Caeiro, S.; Lobo, J.; Martins, M.;
Ferreira, A. M.; Caetano, M.; Valec, C.; DelValls, A.; Costa, M. H.; Aquat. Toxicol.2009, 92, 202.
11. Atli, G.; Canli, M.; Ecotoxicol. Environ. Saf.2010, 73, 1884. 12. Biney, C.; Amuzu, A. T.; Calamari, D.; Kaba, N.; Mbome, I.
L.; Naeve, H.; Ochumba, P. B. O.; Osibanjo, O.; Radegonde, V.; Saad, M. A. H.; Ecotoxicol. Environ. Saf.1994, 28, 134. 13. Çoğun, H. Y.; Kargin, F.; Chemosphere2004, 55, 277. 14. Cicik, B.; Ay, O.; Karayakar, F.; Bull. Environ. Contam. Toxicol.
2004, 72, 141.
15. Benaduce, A. P. S.; Kochhann, D.; Flores, E. M. M.; Dressler, V. L.; Baldisserotto, B.; Arch. Environ. Contam. Toxicol. 2008,
54, 274.
16. Hollis, L.; McGeer, J. C.; McDonald, D. G.; Wood, C. M.;
Aquat. Toxicol.1999, 46, 101.
17. Li, J.; Quabius, E. S.; Wendelaar Bonga, S. E.; Flik, G.; Lock, R. A. C.; Aquat. Toxicol.1998, 43, 1.
18. Chen, Q. L.; Luo, Z.; Zheng, J. L.; Li, X. D.; Liu, C. X.; Zhao, Y. H.; Gong, Y.; Ecotoxicol. Environ. Saf. 2012, 76, 126. 19. Pelgrom, S. M. G. J.; Lamers, L. P. M.; Lock, R. A. C.; Balm,
P. H. M.; Bonga, S. E. W.; Environ. Pollut.1995, 90, 415. 20. Almeida, J. A.; Diniz, Y. S.; Marques, S. F.; Faine, L. A.; Ribas,
B. O.; Burneiko, R. C.; Novelli, E. L.; Environ. Int. 2002, 27, 673.
21. Girón-Pérez, M. I.; Santerre, A.; Gonzalez-Jaime, F.; Casas-Solis, J.; Hernandez-Coronado, M.; Peregrina-Sandoval, J.; Takemura, A.; Zaitseva, G.; Fish Shellfish Immunol.2007, 23, 760.
22. Wu, S. M.; Lin, H. C.; Yang, W. L.; Aquat. Toxicol.2008, 87, 296.
23. EPA; Methods for Measuring the Acute Toxicity of Effluents and Receiving Waters to Freshwater and Marine Organisms,
5th ed.; Environmental Protection Agency: Washington, DC,
USA, 2002.
24. Associação Brasileira de Normas Técnicas; NBR 15088: Ecotoxicologia Aquática - Toxicidade Aguda - Método de
Ensaio com Peixes; ABNT: São Paulo, Brasil, 2011.
25. APHA; Standard Methods for the Examination of Water and Wastewater, 17th ed.; American Public Health Association:
Washington, DC, USA, 1989.
26. Reis, B. F.; Vieira, J. A.; Krug, F. J.; Gine, M. F.; J. Braz. Chem. Soc.1997, 8, 523.
27. Tipping, E.; Lofts, S.; Aquat. Toxicol. 2013, 142-143, 114. 28. Hamilton, M. A.; Russo, R. C.; Thurston, R. V.; Environ. Sci.
Technol.1977, 11, 714.
29. Benli, A. C. K.; Koksal, G.; Turk.J. Vet. Anim. Sci.2005, 29, 339.
30. EPA/600/4-91/003; Short-Term Methods for Estimating the Chronic Toxicity of Effluents and Receiving Waters to Marine
and Estuary Organisms, 2nd ed.; Klemm, D. J.; Morrison, G.
E.; Norber-King, T. J.; Peltier, W. H.; Heber, M. A., eds.; EPA: Washington, USA, 1994.
31. Masutti, M. B.; Espíndola, E. L. G.; Nogueira, A. M.; Simões, F. C. F.; J. Braz. Soc. Ecotoxicol. 2006, 1, 37.
32. Seddek, A.; Assiut Vet. Med. J.1990, 23, 166.
33. Dorothy, R.; Roseboom, D. P.; Acute Toxicity of Copper to Some Fishes in High Alkalinity Water; Illinois State Water Survey:
Champaign, IL, USA, 1978. Available at http://webh2o.sws. uiuc.edu/pubdoc/C/ISWSC-131.pdf, accessed in May 2016. 34. Macdonald, S.; Bishop, A. G.; Prenzler, P. D.; Robards, K.;
Anal. Chim. Acta2004, 527, 105.
35. Oronsaye, J. A. O.; Ogunbor, E. O.; Indian J. Anim. Sci.1998,
68, 1001.
36. Annune, P. A.; Ebele, S. O.; Oladimeji, A. A.; J. Environ. Sci. Health, Part A: Toxic/Hazard. Subst. Environ. Eng. 1994, 29,
1357.
37. Garcia-Santos, S.; Fontainhas-Fernandes, A.; Wilson, J. M.;
Environ. Toxicol.2006, 21, 36.
38. Heath, A. G.; Water Pollution and Fish Physiology, 2nd ed.; CRC
Press: Boca Raton, USA, 1995.
39. Lichtenfels, A. J. F. C.; Lorenzi, G.; Guimaraes, E. T.; Macchione, M.; Saldiva, P. H. N.; J. Comp. Pathol.1996, 115, 47.
40. Handy, R. D.; Eddy, F. B.; Baines, H.; Biochim. Biophys. Acta 2002, 1566, 104.
41. Spry, D. J.; Wiener, J. G.; Environ. Pollut.1991, 71, 243. 42. Wren, C. D.; Stephenson, G. L.; Environ. Pollut.1991, 71, 205. 43. Buffle, J.; De Vitre, R.; Chemical and Biological Regulation of
Aquatic Systems; Lewis Publishers: London, 1995.
Submitted: February 25, 2016
Published online: May 19, 2016