1 School of Physical Therapy, Faculty of Health Sciences, Universidad de Talca, Talca, Chile 2 Department of Statistics, Institute of Mathematics and Physics, Universidad de Talca, Talca, Chile
*Abstract accepted at International Society for Electrophysiology and Kinesiology, Brisbane, Australia, 19-21st July 2012. Received: 06/23/2012 Revised: 12/03/2012 Accepted: 03/09/2013
a r t i c l e
Evaluation of the neuromuscular compartments
in the peroneus longus muscle through electrical
stimulation and accelerometry*
Guillermo A. Méndez1, Valeska F. Gatica1, Eduardo E. Guzmán1, Alex E. Soto2
ABSTRACT | Background: Muscles are innervated exclusively by a nerve branch and possess deinite actions.
However, mammalian skeletal muscles, such as the trapezius, the medial gastrocnemius, and the peroneus longus, are
compartmentalized. In the peroneus longus muscle, multiple motor points, which innervate individual neuromuscular compartments (NMC), the superior (S-NMC), anteroinferior (AI-NMC), and posteroinferior (PI-NMC), have been described. The contribution of each neuromuscular compartment to the inal action of the muscle is fundamental for the rehabilitation of patients aflicted by neurological and muscle dysfunctions. Interventions are often based on electrical principles that take advantage of the physiological characteristics of muscles and nerves to generate therapeutic effects.
Objective: To compare the effects of stimulating the different neuromuscular compartments (NMCs) of the peroneus
longus muscle on the motor threshold (MT) and acceleration of the foot. Method: This is a cross-sectional study
comprising 37 subjects. The three NMCs of the peroneus longus muscle were stimulated, and the acceleration of the foot and the motor threshold of each NMC were evaluated. A repeated measures analysis of variance with Bonferroni corrections of two intra-subjects factors was performed. Results: The stimulation of the different NMCs did not result in
any differences in MT (F=2.635, P=0.079). There were signiicant differences between the axes of acceleration caused by the stimulation of the different NMCs (F=56,233; P=0.000). The stimulation of the posteroinferior compartment resulted
in the greatest acceleration in the X-axis (mean 0.614; standard deviation 0.253). Conclusions: The posteroinferior
compartment primarily contributes to the eversion movement of the foot. NMCs have speciic functional roles that contribute to the actions of the muscles to which they belong.
Keywords: neuromuscular compartment; peroneus longus muscle; accelerometry; motor threshold; motor point;
physical therapy.
HOW TO CITE THIS ARTICLE
Méndez GA, Gatica VF, Guzmán EE, Soto AE. Evaluation of the neuromuscular compartments in the peroneus longus muscle through electrical stimulation and accelerometry. Braz J Phys Ther. 2013 Sept-Oct; 17(5):427-434. http://dx.doi.org/10.1590/ S1413-35552012005000110
Introduction
Conventionally, muscles have been described as
possessing deinite actions, with exclusive innervation by a nerve branch. However, mammalian skeletal
muscles, such as the trapezius1, the extensor carpi
radialis longus and brevis2, the tibialis anterior3, the brachialis anterior4, the long head of triceps5, the
sartorius6, the medial gastrocnemius and the soleus7, and the peroneus longus8, possess multiple actions that correlate with their muscular architecture and neural organization9. In 1974, Letbetter10 characterized the
subdivisions of the medial gastrocnemius in the cat, establishing the basis for the investigation of other
muscles in animals and humans. In 1982, English and Letbetter11 deined neuromuscular compartments
(NMCs) as muscle subdivisions that are innervated
by unique sets of motor neurons. This organization
occurs at the innervation level, particularly at the
union of a nerve with a muscle. An example of this
structure is the peroneus longus muscle, in which the presence of multiple motor branches has been detected, with each of them innervating a subdivision
or neuromuscular compartment (NMC), speciically, the superior (S-NMC), anteroinferior (AI-NMC), and posteroinferior (PI-NMC)12,13. The projection of these
subdivisions to the surface of the skin facilitates the localization of three motor points13.
The knowledge of the actions of muscle groups and
contribution of each NMC to the inal action of the
muscle, is fundamental for the effective rehabilitation
of patients aflicted by neurological and muscle
dysfunctions that impede basic movements, such as walking, jumping, sitting, and standing, as well as more demanding activities, such as sports14,15.
These movements require the constant activation of
stabilizing muscles in static and dynamic positions
at the joints of the lower limbs. For example, the
peroneus longus muscle stabilizes the frontal plane
through the eversion action of the foot. The direct
or indirect dysfunction of the peroneus longus muscle requires a rehabilitation process that includes various interventions, such as proprioception, neuromuscular and strength training16, neuromuscular
electric stimulation (NMES)17, functional electric
stimulation (FES)18, and implantable stimulators
of the ibular nerve19, among others. Interventions
based on electrical principles take advantage of the physiological characteristics of muscles and
nerves to generate therapeutic effects. One of these characteristics is the motor threshold (MT), which is deined as the minimum intensity at which a visible
and palpable contraction of the muscle is obtained20.
The MT varies between muscles and subjects and is used as a reference for localizing motor points.
Previous electromyographic (EMG) studies have
demonstrated selective NMC activation in animals and humans1,15,21. It has not been demonstrated
that these anatomic and physiologic characteristics
inluence the muscle functions that generate the movement of articulation. Triaxial accelerometry is
one of the most frequently employed biomechanical tools, and it has been used in studies on walking and physical activity22. Triaxial accelerometers can be positioned on different areas of the body, allowing for the measurement of acceleration values in three axes
of displacement. The aim of this study is to compare
the NMCs of the peroneus longus muscle through the
MT and acceleration of the foot. We hypothesized that the PI-NMC peroneus longus muscle has the lowest MT and that this same compartment contributes to greater acceleration of the foot on the X axes.
Method
This is a cross-sectional study with a non-probabilistic sampling per group. The STROBE
declaration was used to report the study23. The study
was performed in the Biomechanical Laboratory of the School of Physical Therapy at the University of Talca, Chile. The environment was restricted
to authorized personnel, and the illumination was
adequate. The participants were recruited at the School of Physical Therapy during a four-month period starting on May 2011. Each individual was evaluated once.
Participants
The criteria used to calculate the size of the sample based on the mean and variance of the MT were as follows: (1) a conidence level of 95%, (2) a precision value of 1, (3) a 12% variance from the MT average, and (4) a population of 220 students from the School of Physical Therapy from University of Talca. The sample size was calculated to be 37. A non-probabilistic sampling per group was conducted. Fifty young adult volunteers (18 to 24 years of age)
were evaluated according to the inclusion criteria
of a normal body mass index (BMI, 18.5-24.99 Kg/
m2). The exclusion criteria included the following:
(1) BMI classiication as overweight (≥25.00 Kg/m2)
or obese (≥30.00 Kg/m2), (2) chronic neuromuscular
and/or musculoskeletal disease, and (3) inferior
extremity lesions in the six months preceding the
evaluation. Figure 1 shows the design of the study.
All of the subjects included in the study signed an
informed consent form approved by the Bioethics Committee of the University of Talca (Folio 00058).
A total of 37 subjects, 23 women and 14 men, were analyzed in this study. The data for their age, BMI, and leg perimeter were grouped by gender and had a normal distribution (P>0.05). The study
participants’ fibula lengths were subjected to logarithmic transformation to test the assumption of
normality. Table 1 shows the basal demographic and anthropometric characteristics of the study subjects. There were no signiicant differences in terms of age (P=0.507), BMI (P=0.714), or leg perimeter (P=0.082) between the genders. In contrast, the length of the ibula was signiicantly different between males and females (P=0.001).
Procedure
Preparation and installation
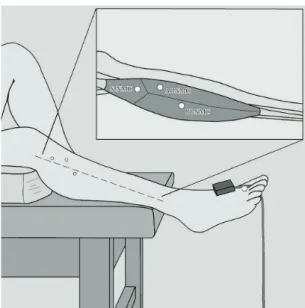
The weight and height of each subject were measured. The thickest region of the triceps surae was used to measure the perimeter of the leg. Finally, the length of the ibula from its apex to the most distal point of the lateral malleolus was measured.
Each participant was positioned on a stretcher in the supine decubitus position with support
Enraf Nonius Inc., PO Box 810, 2600 AV Delft, The Netherlands). The positive electrode was installed
proximal to the medial malleolus of the tibia, and the negative electrode was prepared as the stimulation
electrode (point). Finally, the triaxial accelerometer (ADXL335, Analog Devices Inc, One Technology Way, PO Box 9106, Norwood, Massachusetts 02062-9106, USA) was installed on the dorsal side of the irst metatarsus right foot using adhesive tape (Figure 2).
All of the measurements were obtained in a single reading in the following two consecutive and
uninterrupted stages (Figure 1): (1) MT measurement and (2) foot acceleration measurement. Both readings were obtained for the S-NMC, AI-NMC, and PI-NMC of each participant.
Motor threshold measurement
This study utilized information from previous
investigations that described the localization of the motor points of the NMCs in the peroneus longus muscle (Figure 2), which was performed
through a supericial projection based on a reference
system of two coordinates for each compartment13.
The following coordinates were used: S-NMC (41/4.9 mm), AI-NMC (59.9/6.2 mm), and PI-NMC (77.4/–3.1 mm). First, a reference axis between the apex of the head of the ibula and the lateral malleolus was established. Then, the irst coordinate was used to indicate the distance from the head of the ibula along the reference axis. Finally, the second coordinate
was used to indicate the perpendicular distance from
the irst coordinate, either anteriorly or posteriorly, according to positive or negative values, respectively.
The three compartments were stimulated with
a basal intensity of 2 mA, and the stimulus was
progressively increased by 0.1 mA until the MT was reached. This value was then recorded in a results
Figure 1. Study design. AS: ankle sprain; AFx: ankle fracture; UTAL: University of Talca (Universidad de Talca, in Spanish).
Table 1. Baseline characteristics of the sample population.
Characteristics Gender Mean (SD) P*
Age (years) Female 20.70 (1.66) 0.507
Male 21.00 (1.10) BMI (K/m2) Female 22.29 (1.68) 0.714
Male 22.48 (1.17) Leg Perimeter (cm) Female 34.33 (1.83) 0.082
Male 35.89 (3.48) Fibula Length (cm) Female 34.14 (2.18) 0.001
Male 36.82 (2.37)
spreadsheet. The stimulation was performed with a monopolar square pulse duration of 200 µsec.
Medium pulses (~200 µsec) were utilized to ensure torque generation and to avoid muscle fatigue and nociceptor activation24-28.
Foot acceleration measurement
After MT measurement, the basal intensity was
increased in a consecutive and uninterrupted manner
in 0.1 mA intervals until an evident movement of the foot was obtained. The accelerometer was positioned
so that the X-axis corresponded to the medio-lateral direction, the Y-axis to the anteroposterior direction,
and the Z-axis to the vertical direction. Due to the
arrangement of the accelerometer presented above, the acceleration in axes X and Y largely represents the
eversion movement of the foot. The acceleration axis Z represents the movement of foot dorsal lexion. The
acceleration values for the X-, Y-, and Z-axes of each
NMC were obtained and processed using the IGOR Pro 6.22A software (IGOR Pro 6.22A, WaveMetrics Inc., P.O. Box 2088, Lake Oswego, Oregon 97035, USA). After obtaining the records, we selected the
spike on each axis acceleration, and the maximum
amplitude was measured. The data were recorded on a data spreadsheet.
Statistical analysis
The data corresponding to age, BMI, leg perimeter, and ibula length were grouped by age and sex and
analyzed for normality. Independent samples were analyzed using the t-test with a P value of 0.05.
The MT variable was analyzed using a repeated
measures analysis of variance of an intra-subject
factor, the MT, which was obtained after the stimulation of each NMC. Three post-stimulation
repetitions of this measurement were obtained per
subject. The acceleration variable was analyzed
with a repeated measures analysis of variance of two intra-subject factors, the NMCs and the axes, as well
as the interaction among these parameters. The foot
acceleration was measured in three axes (X, Y, and
Z) after the stimulation of each NMC (AI-NMC,
PI-NMC, and S-NM), and nine repeated measurements
were obtained per subject.
Both variables were subjected to tests for
homogeneity of variance and Mauchly sphericity,
considering a P value of 0.05 to be signiicant. For the
analysis of variance, intra-subject tests and univariate
and multivariate approximations with a P value of 0.05 were performed. For multiple comparisons by pairs, the Bonferroni post-hoc correction was used. The software used for these analyses was SPSS 14.0 (SPSS 14.0, SPSS Inc., 233 South Wacker Drive, Chicago, Illinois 60606-6412, USA).
Results
Motor threshold
Table 2 shows the average MT for each NMC. A
repeated measures analysis of variance of an
intra-subject factor was used. The variance of the NMC factor was homogeneous (P>0.05), and its sphericity was assumed (P=0.556). There were no signiicant
differences in the test for univariate approximation
for intra-subject effects, and there were no signiicant differences between the compartments (F=2.635; P=0.079). Table 2 presents a comparison of the MT between compartments using the Bonferroni post-hoc correction. There were no signiicant differences for the MT between NMCs (P>0.05).
Foot acceleration
Table 3 presents the average acceleration of the axes for each neuromuscular compartment. A repeated
measures analysis of variance for two intra-subject
factors was used. The variance was homogeneous for all factors (P>0.05). Sphericity was assumed for all NMCs (P=0.206) and for the axes of acceleration (P=0.713). The test for univariate approximation did not reveal a signiicant difference for intra-subject effects between compartments (F=1.811, P=0.171).
Figure 2. Procedure. The location of motor points in the
In contrast, signiicant differences in the acceleration axes were found (F=56.233, P=0,000). Sphericity was not assumed for the NMC-axis interaction (P=0.003). Because the sphericity hypothesis was rejected,
and the size of the sample (n=37) was greater than
10+k (k, number of repeated measurements)29, a
multivariate approximation for intra-subject effects
was used. No signiicant differences were found in the effects of the NMC-axis interactions (F=2.553, P=0.057). Table 3 presents a comparison of the
acceleration between the axes in each of the NMCs
after a Bonferroni post-hoc correction. There were signiicant differences between the acceleration axes
for each compartment, except for the S-NMC, in
which no signiicant difference between the X- and Y-axes was detected (P=0.063).
Discussion
This study did not detect differences related to age, BMI, or leg diameter between men and women. These results indicate that the basal characteristics
were homogeneous between the subjects, thus
permitting the analysis of acceleration and MT without considering the gender of the subjects. Although the length of the ibula presented signiicant differences (P=0.001) between genders, this was not
taken into account. This factor was not taken into account because in the study by Méndez et al.13,
which was used as a topographic reference for this study, a differential analysis between men and women was not reported, thus precluding any differentiation
between subsequent measurements.
No signiicant differences in the MT were found between the NMCs (F=2.635, P=0.079), suggesting
that the bioelectrical behavior of each compartment
is the same. This result can be explained by the proximity of the motor points. As such, stimulation
may result in the depolarization of the muscle
ibers of the NMC, as well as of the neighboring compartments. Several factors should be taken into account when using the motor point and the MT as a reference for muscle stimulation. The motor point is deined as the location at which the nerve enters
the muscle, which is usually immediately proximal to
the initial ramiication of the nerve30. In addition, the motor point is the skin surface at which the maximal mechanical response is elicited with the minimum
applied current. However, English et al.14 described
a more complex organization of the studied region. They indicated that the nerve or primary motor branch
continues its path inside the muscle, dividing into two or more secondary branches that reach the NMCs14,31.
Lim et al.32 conirmed the presence of secondary
Table 2. Comparison of motor threshold between neuromuscular compartments.
Compartment Mean MT (SD) NMC/NMC Difference (CI 95%)
AI 14.53 (3.23) AI-NMC/PI-NMC 0.711 (0.126-1.547) PI 14.31 (2.08) AI-NMC/S-NMC 0.368 (0.410-1.145)
S 14.26 (2.78) PI-NMC/S-NMC 0.343 (1.057-0.371)
*P<0.05, post-hoc test Bonferroni correction for multiple comparisons by pairs (NMC/NMC). MT: motor threshold (mA); SD: standard deviation; NMC: neuromuscular compartment; AI: anteroinferior; PI: posteroinferior; S: superior.
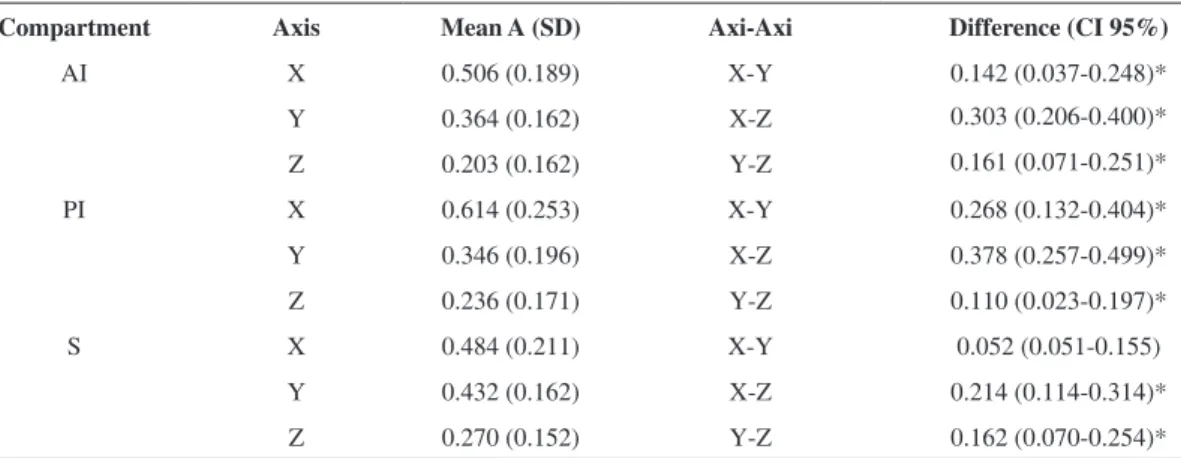
Table 3. Comparison of acceleration between the axes in each neuromuscular compartment.
Compartment Axis Mean A (SD) Axi-Axi Difference (CI 95%)
AI X 0.506 (0.189) X-Y 0.142 (0.037-0.248)*
Y 0.364 (0.162) X-Z 0.303 (0.206-0.400)*
Z 0.203 (0.162) Y-Z 0.161 (0.071-0.251)*
PI X 0.614 (0.253) X-Y 0.268 (0.132-0.404)*
Y 0.346 (0.196) X-Z 0.378 (0.257-0.499)*
Z 0.236 (0.171) Y-Z 0.110 (0.023-0.197)*
S X 0.484 (0.211) X-Y 0.052 (0.051-0.155)
Y 0.432 (0.162) X-Z 0.214 (0.114-0.314)*
Z 0.270 (0.152) Y-Z 0.162 (0.070-0.254)*
motor branches. These authors explained that the
distribution of the intra-muscular nervous branches is affected by the presence of aponeurosis and the
muscle-tendon junction. The nerves that penetrate
the muscle and reach these structures divide into secondary nervous branches that cross to each side of the tendon32.
The motor points used in this study were supericial projections of the intrafascicular secondary branches. Thus, they can be deined as secondary motor points.
Consequently, they are not comparable to the motor points used in NMES and FES, raising the possibility that these points may be superposed or in a close topographical relationship in small- or medium-sized
muscles. In contrast, major muscles, such as the rectus
femoris21, medial gastrocnemius7, and trapezius1,
among others, have NMCs with distant motor points. The intrafascicular motor branches subdivide into numerous branches that join the muscle iber sarcolemma, speciically in the area corresponding
to the neuromuscular junction or motor plate33. Consequently, the stimulation of the motor points of each NMC affects the entire area of the motor
plate. In the same manner, a group of motor plates
delimits an area that corresponds to the highest level of electrical activity in a muscle34,35. The motor plates
and the innervation zones are distal to the primary
motor branch ramiication3. The innervation zone in a small muscle can include more than one motor point,
thus making it impossible to detect the MT of each
NMC or to establish adequate electrical parameters
for NMES or FES. Watanabe et al.21 studied the
innervation zones and the NMCs of the rectus
femoris in humans using multi-channel surface EMG. They found that this muscle possesses two NMCs, proximal and distal, each with an innervation zone.
In this study, we found differences between the axes of acceleration within each NMC (F=56.233, P=0.000).
The AI-NMC and PI-NMC presented signiicant
differences in all of the acceleration axes, with the highest average acceleration in the X-axis (Mean
0.614; standard deviation 0.253) of the PI-NMC. This
observation explains why the electrical stimulation of
the PI-NMC in the peroneus longus muscle resulted
in a major contribution to foot acceleration along the X-axis, corresponding to the medial-lateral displacement that is part of the eversion movement
of the foot. These results are related to the anatomical
characteristics of this compartment, which is
posterior to the AI-NMC and distal to the S-NMC. The S-NMC acceleration presented no signiicant differences in the X- or Y-axes. This finding
corresponds to the anatomical position of the S-NMC,
which is located above the AI-NMC and PI-NMC. Upon stimulation, the S-NMC exerts traction through
via the connective tissues that are connected to the underlying compartments (intramuscular septum)12.
These compartments accelerate the foot along the X- and Y-axes with comparable intensity.
The AI-NMC behaves similarly to the other
compartments, but the resulting acceleration in the
X axis was smaller than that caused by the PI-NMC. These results support the indings of other authors,
who have shown that some muscles of mammals
are compartmentalized. Wolf et al.15 studied the
selective activation of the NMCs in the human medial
gastrocnemius. Similarly, Watanabe et al.21 used
multiple tests to show the differential activation of
the proximal and distal NMCs in the rectus femoris. Holtermann et al.1 also observed a selective activation
of the superior, medial, and inferior NMCs in the
trapezius muscle. All of these studies used surface
EMG to evaluate the NMCs in different functional
tests. In contrast, the present study evaluated foot
acceleration after electric stimulation by triaxial accelerometry, a feasible tool for evaluating differences in NMC muscle activation along different
activation directions.
The knowledge of NMCs and their actions on
articular segments could be used as a new approach
when designing the motor therapy of a patient. Speciically, it should be considered that a muscle
does not act as a unit but rather as a complex of
several subunits that coordinately inluence the joint segment. Furthermore, these data may be used in the
design of external and implantable stimulators, for example, in the sequelae paretic segments of stroke
patients. Finally, future investigations should focus on the following: (1) identifying the intrafascicular motor points of the NMCs in diverse muscle groups;
(2) identifying the existence of one or multiple
innervation zones; (3) establishing whether the NMCs possess speciic functional roles; and (5)
investigating the behavior of the NMCs in different
disorders. For these purposes, multi-channel surface
EMG could potentially allow for selective evaluation
of the NMCs.
Limitations
All of the measurements were performed on
points between genders were not taken into account.
Future investigations should determine the effects of
gender on these differences. Teepker et al.36 noted
that menstruating women had a lower pain threshold
for electrical stimuli. In the present study, we did
not consider the presence of menstruation cycle of women who were evaluated, which could have
inluenced the results36.
Conclusion
The NMCs of the peroneus longus presented the same MT. The PI-NMC contributed the most to foot
acceleration along the X-axis, corresponding to the direction of the medial-lateral displacement that is
part of the eversion movement of the foot.
Acknowledgments
This study was supported by the Research Direction (Project VAC 600 538) and the School of Physical Therapy, University of Talca, Talca, Chile.
References
1. Holtermann A, Roeleveld K, Mork PJ, Grönlund C, Karlsson JS, Andersen LL, et al. Selective activation of
neuromuscular compartments within the human trapezius
muscle. J Electromyogr Kinesiol. 2009;19(5):896-902. PMid:18585928. http://dx.doi.org/10.1016/j. jelekin.2008.04.016
2. Ravichandiran M, Ravichandiran N, Ravichandiran K, McKee NH, Richardson D, Oliver M, et al. Neuromuscular
partitioning in the extensor carpi radialis longus and
brevis based on intramuscular nerve distribution patterns: A three-dimensional modeling study. Clin Anat. 2012 Apr;25(3):366-72. http://dx.doi.org/10.1002/ca.21246 3. Bowden JL, McNulty PA. Mapping the motor point in
the human tibialis anterior muscle. Clin Neurophysiol. 2012;123(2):386-392. PMid:21802984. http://dx.doi. org/10.1016/j.clinph.2011.06.016
4. Galvas PE, Gonyea WJ. Motor-end-plate and nerve
distribution in a histochemically compartmentalized
pennate muscle in the cat. Am J Anat. 1980;159(2):147-156. PMid:7446445. http://dx.doi.org/10.1002/aja.1001590203 5. Liu J, Kumar VP, Lau HK, Pereira BP, Shen Y,
Pho RW. Neuromuscular compartments in the long head of triceps: a morphological study in rabbits. Muscle Nerve. 1997;20(7):897-899. http://dx.doi. org/10.1002/(SICI)1097-4598(199707)20:7<897::AID-MUS18>3.0.CO;2-P
6. Harris AJ, Duxson MJ, Butler JE, Hodges PW, Taylor JL, Gandevia SC. Muscle iber and motor unit behavior in the longest human skeletal muscle. J Neurosci. 2005;25(37):8528-8533. PMid:16162934. http://dx.doi. org/10.1523/JNEUROSCI.0923-05.2005
7. Kim MW, Kim JH, Yang YJ, Ko YJ. Anatomic localization of motor points in gastrocnemius and soleus muscles. Am J Phys Med Rehabil. 2005;84(9):680-683. PMid:16141745. http://dx.doi.org/10.1097/01.phm.0000176341.85398.a9 8. Bakkum BW, Russell K, Adamcryck T, Keyes M.
Gross anatomic evidence of partitioning in the
human fibularis longus and brevis muscles. Clin Anat. 1996;9(6):381-385. http://dx.doi.org/10.1002/ (SICI)1098-2353(1996)9:6<381::AID-CA4>3.0.CO;2-E 9. Monti RJ, Roy RR, Edgerton VR. Role of motor
unit structure in defining function. Muscle Nerve. 2001;24(7):848-866. PMid:11410913. http://dx.doi. org/10.1002/mus.1083
10. Letbetter WD. Inluence of intramuscular nerve branching
on motor unit organization in medial gastrocnemius
muscle. Anat Rec. 1974;178:402-414.
11. English AW, Letbetter WD. Anatomy and innervation patterns of cat lateral gastrocnemius and plantaris muscles. Am J Anat. 1982;164(1):67-77. PMid:7102574. http:// dx.doi.org/10.1002/aja.1001640107
12. El Gharbawy RM, Skandalakis LJ, Skandalakis JE. Protective mechanisms of the common ibular nerve in and around the ibular tunnel: a new concept. Clin Anat. 2009;22(6):738-746. PMid:19644970. http://dx.doi. org/10.1002/ca.20844
13. Méndez RG, Coronado GR, Suazo GI. Anatomical Study of the Fibularis Longus Muscle Motor Points and Electrical Stimulation Therapy Application. Int J Morphol. 2009;27(3):699-703.
14. English AW, Wolf SL, Segal RL. Compartmentalization of muscles and their motor nuclei: the partitioning hypothesis. Phys Ther. 1993;73(12):857-867. PMid:8248294. 15. Wolf SL, Segal RL, English AW. Task-oriented EMG activity
recorded from partitions in human lateral gastrocnemius
muscle. J Electromyogr Kinesiol. 1993;3(2):87-94. http:// dx.doi.org/10.1016/1050-6411(93)90003-F
16. Holmes A, Delahunt E. Treatment of common deicits associated with chronic ankle instability. Sports Med. 2009;39(3):207-224. PMid:19290676. http://dx.doi. org/10.2165/00007256-200939030-00003
17. Botter A, Oprandi G, Lanfranco F, Allasia S, Mafiuletti NA, Minetto MA. Atlas of the muscle motor points for the lower limb: implications for electrical stimulation procedures and electrode positioning. Eur J Appl Physiol. 2011;111(10):2461-2471. PMid:21796408. http://dx.doi. org/10.1007/s00421-011-2093-y
18. Peckham PH, Knutson JS. Functional electrical stimulation for neuromuscular applications. Annu Rev Biomed Eng. 2005;7:327-360. PMid:16004574. http://dx.doi. org/10.1146/annurev.bioeng.6.040803.140103
19. Kottink AI, Hermens HJ, Nene AV, Tenniglo MJ, Groothuis-Oudshoorn CG, IJzerman MJ. Therapeutic effect of an
implantable peroneal nerve stimulator in subjects with
chronic stroke and footdrop: a randomized controlled trial. Phys Ther. 2008;88(4):437-448. PMid:18218825. http:// dx.doi.org/10.2522/ptj.20070035
Neurophysiol. 2011;122(3):456-463. PMid:20739217. http://dx.doi.org/10.1016/j.clinph.2010.07.025
21. Watanabe K, Kouzaki M, Moritani T. Task-dependent
spatial distribution of neural activation pattern in
human rectus femoris muscle. J Electromyogr Kinesiol. 2012 Apr;22(2):251-8. http://dx.doi.org/10.1016/j. jelekin.2011.11.004
22. Godfrey A, Conway R, Meagher D, OLaighin G. Direct measurement of human movement by accelerometry. Med Eng Phys. 2008;30(10):1364-1386. PMid:18996729. http://dx.doi.org/10.1016/j.medengphy.2008.09.005 23. Von Elm E, Altman DG, Egger M, Pocock SJ, Gøtzsche
PC, Vandenbroucke JP; STROBE Initiative. The Strengthening the Reporting of Observational Studies in Epidemiology (STROBE) statement: guidelines for reporting observational studies. J Clin Epidemiol. 2008;61(4):344-349. PMid:18313558. http://dx.doi. org/10.1016/j.jclinepi.2007.11.008
24. Kantor G, Alon G, Ho HS. The effects of selected stimulus
waveforms on pulse and phase characteristics at sensory
and motor thresholds. Phys Ther. 1994;74(10):951-962. PMid:8090846.
25. Kesar T, Binder-Macleod S. Effect of frequency and
pulse duration on human muscle fatigue during repetitive
electrical stimulation. Exp Physiol. 2006;91(6):967-976. PMid:16873456. http://dx.doi.org/10.1113/ expphysiol.2006.033886
26. Scott WB, Causey JB, Marshall TL. Comparison
of maximum tolerated muscle torques produced by
2 pulse durations. Phys Ther. 2009;89(8):851-857. PMid:19541774. http://dx.doi.org/10.2522/ptj.20080151 27. Gorgey AS, Black CD, Elder CP, Dudley GA. Effects of
electrical stimulation parameters on fatigue in skeletal
muscle. J Orthop Sports Phys Ther. 2009;39(9):684-692. PMid:19721215.
28. Salmons S. Adaptive change in electrically stimulated muscle: a framework for the design of clinical protocols. Muscle Nerve. 2009;40(6):918-935. PMid:19902542. http://dx.doi.org/10.1002/mus.21497
29. Atkinson G. Analysis of repeated measurements in physical therapy research. Phys Ther Sport. 2001;2:194-208. http://dx.doi.org/10.1054/ptsp.2001.0071
30. Duchenne de Bolougne G. A Treatise on localized
electrization, and its applications to pathology and
therapeutics. Paris: J.B. Baillière; 1855.
31. Segal RL, Wolf SL, DeCamp MJ, Chopp MT, English AW. Anatomical partitioning of three multiarticular human muscles. Acta Anat (Basel). 1991;142(3):261-266. http:// dx.doi.org/10.1159/000147199
32. Lim AY, Pereira BP, Kumar VP, De Coninck C, Taki C, Baudet J, et al. Intramuscular innervation of upper-limb skeletal muscles. Muscle Nerve. 2004;29(4):523-530. PMid:15052617. http://dx.doi.org/10.1002/mus.10565 33. L i c h t m a n J W , S a n e s J R . W a t c h i n g t h e
neuromuscular junction. J Neurocytol. 2003;32(5-8 ) : 7 6 7 - 7 7 5 . P M i d : 1 5 0 3 4 2 6 6 . h t t p : / / d x . d o i . org/10.1023/B:NEUR.0000020622.58471.37
34. Masuda T, Miyano H, Sadoyama T. The position of
innervation zones in the biceps brachii investigated
by surface electromyography. IEEE Trans Biomed Eng. 1985;32(1):36-42. PMid:3980027. http://dx.doi. org/10.1109/TBME.1985.325614
35. Barbero M, Gatti R, Lo Conte L, Macmillan F, Coutts F, Merletti R. Reliability of surface EMG matrix
in locating the innervation zone of upper trapezius
muscle. J Electromyogr Kinesiol. 2011;21(5):827-833. PMid:21752668. http://dx.doi.org/10.1016/j. jelekin.2011.05.013
36. Teepker M, Peters M, Vedder H, Schepelmann K, Lautenbacher S. Menstrual variation in experimental pain: correlation with gonadal hormones. Neuropsychobiology. 2010;61(3):131-140. PMid:20110738. http://dx.doi. org/10.1159/000279303
Correspondence
Guillermo A. Méndez
Universidad de Talca
Faculty of Health Sciences
School of Physical Therapy Av. Lircay S/N,
Talca, Chile