Ar
ti
cl
e
0103 - 5053 $6.00+0.00
*e-mail: [email protected]
Automatic Photometric Titration Procedure Based on Multicommutation and
Flow-Batch Approaches Employing a Photometer Based on Twin LEDs
Milton B. da Silva,a Carla C. Crispinoa and Boaventura F. Reis*,b
aDepartamento de Química,Universidade Federal de São Carlos, São Carlos-SP, Brazil
bCentro de Energia Nuclear na Agricultura, Universidade de São Paulo,
Av. Centenario 303, 13400-970 Piracicaba-SP, Brazil
Neste trabalho, é descrito um fotômetro de baixo custo baseado em um par de LEDs idênticos, empregando um, como fonte de luz e o outro como fotodetector. O equipamento, incluindo o fotômetro e o módulo de análises, foi projetado para implementar um procedimento de titulação automático empregando o processo de multicomutação por injeção em luxo (MCFIA). O sistema proposto dispunha de meios para realizar a titulação fotométrica sem a necessidade de empregar curva analítica. A utilidade foi comprovada analisando amostras de vinagre e sucos de limão, laranja, abacaxi, maracujá e cajú. A exatidão foi veriicada comparando os resultados com outros, obtidos empregando procedimento manual, e não foi observada diferença signiicativa no nível de coniança de 95%. Amostras com diferentes concentrações de ácido, tais como suco de limão (1.084,73 mmol L-1) e suco de abacaxi (14,42 mmol L-1) foram tituladas usando a mesma solução
titulante, e sem modiicação do sistema de titulação.
In this work, a reliable and inexpensive photometer based on twin LEDs assembled as a radiation source and as a photodetector is described. The setup including the photometer and low system module was designed to implement an automated titration procedure employing the multicommuted low injection analysis (MCFIA) process. The proposed system was able to carry out photometric titration without using analytical curve to achieve the sample concentration. Its usefulness was proven by analyzing vinegar and lemon, orange, pineapple, maracock, and acajou juices. Accuracy was accessed comparing results with those obtained employing a manual procedure and no signiicant difference was observed at 95% conidence level. Samples presenting different acid concentrations such as lemon juice (1084.73 mmol L-1) and pineapple juice (14.42 mmol L-1)
could be titrated using the same titration solution without any modiication of the titrating setup.
Keywords: multicommuted low injection analysis, low-bath analysis, automated photometric titration, fruit juice, LED photometer
Introduction
The light emitting diode (LED) was utilized for the irst time as a radiation source for photometric detection by Flaschka et al.1 35 years ago, and afterwards by D.
Betteridge et al.2 After these pioneer studies, the use of
LEDs with an analytical purpose increased continuously, and today we can see that several analytical procedures employing LED as a radiation source have been published.3-6 Small size, low cost, high stability of the
radiation beam, and long lifetime are the main features of LEDs which explains its widespread use in different
analytical procedures.7-9 The availability of LEDs with
wavelengths ranging from ultraviolet (λ ca. 380 nm) to near infrared (λ ca. 900 nm) also is an additional incentive for the development of the LED based photometers.10-12
Although equipment for luorimetric detection has also been designed employing a LED as a radiation source,13,14
photometers predominate by far. The LED small size and fast response when it is switched on and off has allowed its application to low analysis-based analytical procedures for the simultaneous determination of two or more analytes15,16 and chemical speciation.2,17
There are a few studies on the use of LEDs as photodetectors.8,19 The measurement was done using the
between capacitor discharge time and the intensity of the light beam illuminating the LED employed as a photodetector. This effect occurred when the wavelength of the light beam was identical to that of the photodetector LED. The detection was carried out considering as the measurement parameter, the time interval elapsed while the potential difference at the LED decreased from 5 V to 1.7 V.
Recently, Tymecki and co-workers20,21 showed that
a LED acting as a photodetector generated a difference of electric potential proportional to the intensity of the light illuminating it. Aiming to prove that a LED could be a reliable photodetector, assays were carried out using solutions of FeIII and CoII complexes with SCN–.20
A more detailed study concerning the LED response as a photodetector was performed using a single-line low injection manifold and promothymol blue solutions as a model.21 In both cases, the measurements were taken
using a common potentiometric pH-meter.
In this work, we intend to develop a dedicated setup for photometric titration employing twin LEDs. The device designed involved coupling one LED as a radiation source to a detector LED in a transduction network with two operational ampliiers. Aiming to prove the setup applicability, a full automated titration procedure was developed. The low system module was designed combining the flow bath22,23 and the
multicommutation approaches.24,25
Experimental
Reagent solutions
Purified water with conductivity of less than 0.1 mS cm-1 was used throughout. A sodium hydroxide
solution (ca. 0.1 mol L-1) was prepared by appropriated
dilution from a 10 mol L-1 NaOH stock solution and
standardized by titration using a potassium biphthalate solution and a 0.01% (m/v) phenolphthalein solution as an indicator. Vinegar samples, and pineapple and acajou juices were purchased at the local market. The juices were centrifuged before use. Lemon, orange, and maracock juices were prepared before use by squeezing fresh fruits using a manual juicer. The juices were iltered to remove solid particles.
Apparatus
The equipment setup comprised the lab-made LED-based photometer as described below; a microcomputer furnished with a PCL711S electronic interface card
(PCL711S, Advantech Corp, Cincinnati, OH, USA); an IPC-8 Ismatec peristaltic pump with Tygon pumping tube; one 225P091-11 pinch solenoid valve and four 161T031 three-way solenoid valves (Nresearch, New Jersey, USA); one lab-made interface9 to power
the solenoid valves; a 12 V mini-motor; a regulated power supply (–12 V, +12 V) to power the LED-based photometer; an acrylic titration chamber as detailed below, two identical (twin) high brightness 5 mm LEDs (intensity of 10000 mcd) with maximum emission at
λ = 531 nm, and view angle of 15o; and a two-operational
ampliier (OP07).
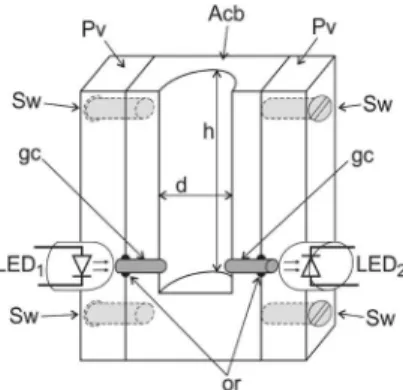
Titration chamber and photodetector assembling
Figure 1 shows a cutaway of the titration chamber. The glass cylinders (gc) conducted the radiation beam emitted by LED1 to the titration chamber and from this up to LED2. Figure 2 shows the electronic diagram of the photometer. LED1 was wired as a radiation source and the intensity of the radiation beam was adjusted by means of a variable resistor (10 kW) wired to the base of a transistor (Tr). LED2 was coupled to an operational ampliier (A1) to work as a photodetector. The signal S0 (mV) at the operational ampliier (A2) output presented a closed relationship with the intensity of the radiation beam emitted by LED1. The generate signal (S0) was monitored by a microcomputer through the analog input of a PCL711S interface card. When titration was carried out, the radiation beam crossed the solution in the titration chamber and was absorbed. The radiation intensity attenuation was sensed by the signal transducer network constituted by LED2 and the operational ampliier (A1). This feature was employed to develop the photometric titration procedure.
Flow system functioning and photometer calibration
The low system diagram is shown in Figure 3. In this coniguration, all valves are switched off; thus, all solutions are pumped back to their storage recipients. When the control software was run, the microcomputer carried out the titration procedure following the sequence depicted in Table 1. As shown in Figure 1, the 3.0 mm diameter glass cylinders (gc) were installed 1.0 mm from the bottom of the titration chamber, and the mixing bar (mb, Figure 3) was
placed ca. 2 mm over the glass cylinders. To ensure eficient mixing, it was established that a 7 mm high water column should be maintained into the titration chamber. Since the inner diameter of the titration chamber was 8.0 mm, a water volume of 360 µL was always inserted into the titration chamber prior titration.
The photometer calibration indicated in the second step was performed by reading the dark measurement (Sd), which was carried out with LED1 off. This measurement value (ca. 10 mV) was used to calculate the absorbance. Afterwards, the intensity of the radiation beam emitted by LED1 was adjusted in order to obtain a potential difference of 1200 mV at the output of the operational ampliier (A2). This adjustment was carried out by means of the variable resistor wired to the base of the transistor (Tr). This step was performed at the software start. As the photometer output signal (Figure 2) was negative, it was converted to positive for the calculation of the absorbance by software.
After the calibration step, the microcomputer carried out the titration following the sequence of steps shown in Table 1. Because pumping pulsation could affect the precision of the solution volumes inserted into the titration chamber, a synchronization step was carried out prior
Table 1. Sequence of the titration procedure
Step Event V1 V2 V3 V4 V5 Mm time/s Flow Rate/
(µL s-1 )
Volume/ µL
1 Insertion water into titration chamber 0 0 0 1 0 0 12 30 360
2 Calibration of photometer 0 0 0 0 0 0 - -
-3 Empty chamber 0 0 0 0 1 0 8 45
-4 Insertion water into titration chamber 0 0 0 1 0 0 12 30 300
5 Insertion of sample solution 1 0 0 0 0 0 4.0 12.02 48.08
6 Insertion of day indictor solution 0 0 1 0 0 0 2.0 11.2 22.40
7 Mixing solutions 0 0 0 0 0 1 2.0 -
-8 Reading of reference signal (Rs) 0 0 0 0 0 0 2.0 -
-9 Insertion of titrant solution and reads signal 0 1 0 0 0 1 ∆t1 12.32 VT1
10 Mixing solutions 0 0 0 0 0 1 3.0 -
-11 Read signal (S) 0 0 0 0 0 0 -
-12 Insertion of sample solution• 1 0 0 0 0 1 ∆t2 6.01 Vs2
13 Mixing solutions• 0 0 0 0 0 1 2.0 -
-14 Read signal (S) • 0 0 0 0 0 0 - -
-15 Insertion of titrant solution♦ 0 1 0 0 0 1 ∆t3 6.16 VT2
16 Mixing solutions♦ 0 0 0 0 0 1 3.0 -
-17 Read signal (S) ♦ 0 0 0 0 0 0 -
-18 Empty chamber 0 0 0 0 1 0 20 45
19 Washing chamber with water 0 0 0 1 0 1 20 30 600
20 Empty chamber 0 0 0 0 1 0 15 45
-The number 0 and 1 indicated that the corresponding device is switched OFF or ON, respectively. -The labels • and ♦ indicate that these events could be repeated, and for detail see text.
Figure 2. Electronic diagram of the photometric detection unit. Tr = transistor BC547; LED1 and LED2 = green light emitting diode,
to inserting each solution. This task was done reading the roller count signal generated by the peristaltic pump through the analog input of the PCL711 interface card.
General procedure
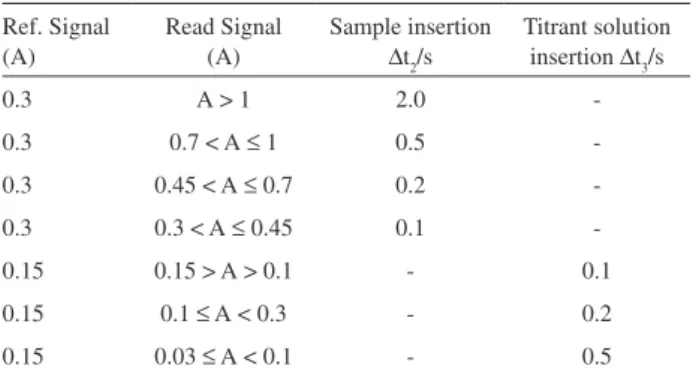
As is indicated in Table 1, steps 4, 5, and 6 were carried out to insert water, sample, and indicator solution aliquots into the titration chamber. After mixing (step 7), the reference signal (Rs) was read (step 8). Afterwards, valve V2 was switched on to insert the titration solution into the titration chamber (step 9). When the read signal became higher than the preset threshold (0.5 absorbance), valve V2 was switched off in order to direct the titration solution stream to its storage vessel. The signal read (S) at step 11 was used to calculate the absorbance using the equation: Absorbance A = –log[(S-Sd)/(Rs-Sd)], where Sd is the dark measurement obtained in the photometer calibration step. The software was instructed to end the titration when Ref ≤ A ≤ 2Ref. The Ref value was maintained at 0.15 A. The sets of steps 12, 13 and 14; 15, 16 and 17 comprised the ine adjustment, which was carried out using low low rates (ca. 6 µL s-1) as was indicated in Table 1. The pumping
low rate was controlled by the microcomputer through the serial interface RS232. Under this condition, the values of the timer intervals Dt2 and Dt3 were selected by software, as indicated in Table 2, which was done considering the relationship between the Ref value and the absorbance related to the last measurement. At steps 3, 18 and 20, valve
V5 was switched on to empty the titration chamber in order to abbreviate the washing step.
The assays to verify if the LED could be used as a photometric device, as well as to establish the optimum operating condition, was carried out using 0.1mol L-1 HCl
and NaOH solutions. To prove the applicability of the proposed setup, a set of samples including vinegar and juices of pineapple, acajou, lemon, orange, and maracock were titrated using standardized sodium hydroxide solutions. Samples were also titrated employing a manual procedure for assessment of accuracy.
Results and Discussion
The performance of the photodetector LED
Previous assays carried out using a sodium hydroxide solution and phenolphthalein as a day indicator, showed that the visual perception of the pink color was associated with an absorbance of ca. 0.15. Considering the results achieved by titrating hydrochloride acid solution using a sodium hydroxide solution, we established that titration could be ended when absorbance was within the range from 0.15 to 0.30. In this sense, after steps 4 to 11 (Table 1) had been carried out, the microcomputer performed the titration ine adjustment by varying the volumes of the solution aliquots using the time intervals and low rates as depicted in Table 2.
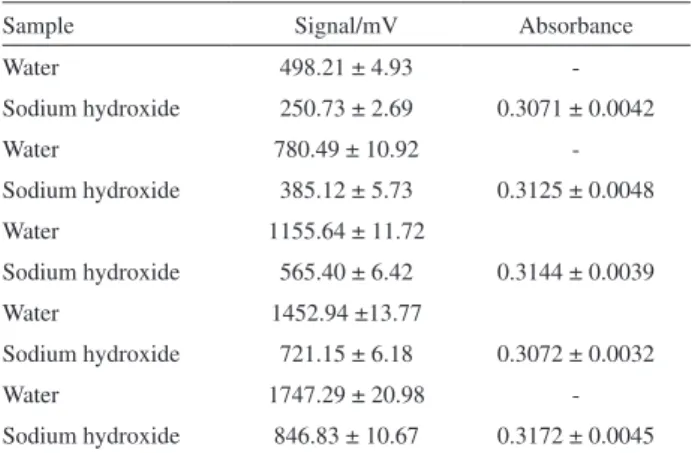
As was reported by Tymecki and co-workers20,21 in a
recent study, the signal generated by the LED wired as a photodetector increases with the electric current intensity. Therefore, the generated difference of potential (S0) was the parameter used to monitor light absorption as a function of the electric current intensity, yielding the results shown in Table 3. The absorbance did not vary signiicantly in multiple repetitions, as shown in this table. Considering these results, the output signal (Figure 2) was adjusted to 1200 mV at the photometer calibration (Table 1, step 2).
Figure 3. Diagram of the low system. Ti = titrant solution (NaOH); S = sample solution; H2O = carrier solution, low rate at 37.85 mL s-1;
In = dye indicator solution; V1, V2, V3 and V4 = three-way solenoid valves; Re = solution circulation; y = joint device machined in acrylic, Tc = titration chamber; Mb = magnetic stirring bar; Mm = DC mini-motor; Pp = peristaltic pump; W = waste. The solid and dashed lines into the valves symbols indicate the luid pathway when valves were OFF or ON, respectively; and arrows indicate the direction of the solutions streams.
Table 2. Time intervals to insert sample and titrant solution
Ref. Signal (A)
Read Signal (A)
Sample insertion
∆t2/s
Titrant solution insertion ∆t3/s
0.3 A > 1 2.0
-0.3 0.7 < A ≤ 1 0.5
-0.3 0.45 < A ≤ 0.7 0.2
-0.3 0.3 < A ≤ 0.45 0.1
-0.15 0.15 > A > 0.1 - 0.1
0.15 0.1 ≤ A < 0.3 - 0.2
Effect of the initial sample volume
As shown in Table 1, the titration run began by inserting an initial sample volume into the titration chamber. Considering that the volume of the irst sample aliquot could affect the precision of the results, a set of assays was carried out by varying the time interval to determine the conditions that would maintain valve V1 switched on at step 5 (Table 1). The results are given in Table 4. The initial sample aliquot varied from 24.40 to 195.20 mL. The inal sample solution volume was obtained summing the initial volume and those obtained for the time interval Dt2 (Table 1) and the related low rate. The inal titrant solution volume was calculated using time intervals Dt1 and Dt3 (Table 1) and the corresponding low rates. The average HCl concentration was estimated at 89.14 ± 1.16 mmol L-1;
therefore, indicating that the precision of the results did not depend on the initial sample volume.
Sample analysis
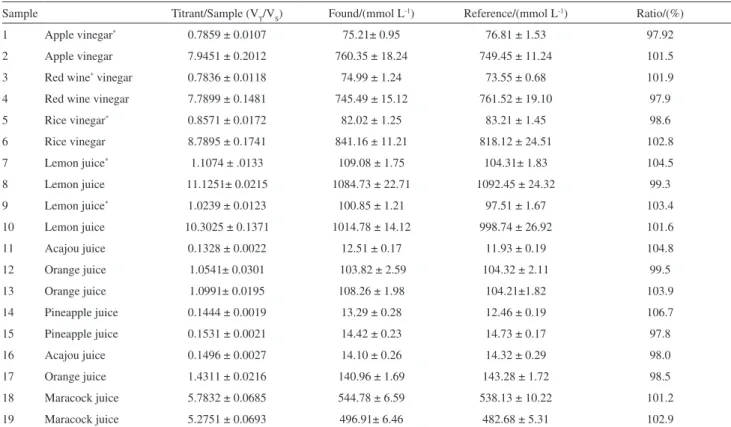
To demonstrate the effectiveness of the proposed photometric titration setup, a set of vinegar and fruit juice samples was analyzed employing the manifold showed in Figure 3 and the operating conditions in Table 1. The results are shown in Table 5. Samples 1 to 6, 7 to 17 and 14 to 19 were titrated using sodium hydroxide solutions with concentrations of 95.7, 98.5, and 94.2 mmol L-1, respectively.
Accuracy was accessed by applying the paired t-test. The tabulated value was t(0.05) =1.4558 and the value found was 0.1573, thus not indicating any signiicant difference at 95% conidence level. Except for the samples indicated with an asterisk, which were diluted 10 times with water, the samples were titrated without previous dilution, yielding concordant results. Comparing the results for samples numbers 8 and 11, we can observe that the acid concentration of lemon juice was 84 times higher than that of acajou juice. Both titrations were made using the same titrant solution (98.5 mmol L-1 NaOH); thus
proving that the system was able to select the appropriate time intervals to maintain valves V1 and V2(Figure 3) switched on for the insertion of the sample and titrant solution aliquots into the titration chamber. The results shown in Table 5 were obtained analyzing the sample at three days. As can be observed, accuracy and precision were maintained, therefore indicating that the overall performance of the system was very good. This could be considered as an indication that a LED is a reliable photometric device for analytical purposes.
The volumes of sample and titrant solution aliquots were a function of both the time interval to maintain valves V1 and V2 switched on and the pumping low rates of the sample and titrant solution. The precision of the time
Table 3.The LED response as a photodetector varying the light beam intensity
Sample Signal/mV Absorbance
Water 498.21 ± 4.93
-Sodium hydroxide 250.73 ± 2.69 0.3071 ± 0.0042
Water 780.49 ± 10.92
-Sodium hydroxide 385.12 ± 5.73 0.3125 ± 0.0048
Water 1155.64 ± 11.72
Sodium hydroxide 565.40 ± 6.42 0.3144 ± 0.0039
Water 1452.94 ±13.77
Sodium hydroxide 721.15 ± 6.18 0.3072 ± 0.0032
Water 1747.29 ± 20.98
-Sodium hydroxide 846.83 ± 10.67 0.3172 ± 0.0045
Results are average of ive consecutive measurements.
Table 4. Titration performance varying the initial sample volume
Sample Titration run Initial volume/µL Sample Final volume/µL Titrant Final volume/µL Found concentration/(mmol L-1)
HCl 1 24.40 37.02 39.60 88.25 ± 1.27
2 48.80 58.18 61.98 87.89 ± 1.40
3 73.20 78.61 86.79 91.08 ± 1.51
4 97.60 98.98 107.56 89.65 ± 0.82
5 122.00 140.68 153.28 89.88 ± 0.91
6 146.40 164.61 176.62 88.52 ± 1.05
7 170.80 183.40 197.87 88.91 ± 0.98
8 195.20 204.61 220.65 88.96 ± 0.92
Table 5. Results comparison
Sample Titrant/Sample (VT/VS) Found/(mmol L-1) Reference/(mmol L-1) Ratio/(%)
1 Apple vinegar* 0.7859 ± 0.0107 75.21± 0.95 76.81 ± 1.53 97.92
2 Apple vinegar 7.9451 ± 0.2012 760.35 ± 18.24 749.45 ± 11.24 101.5
3 Red wine* vinegar 0.7836 ± 0.0118 74.99 ± 1.24 73.55 ± 0.68 101.9
4 Red wine vinegar 7.7899 ± 0.1481 745.49 ± 15.12 761.52 ± 19.10 97.9
5 Rice vinegar* 0.8571 ± 0.0172 82.02 ± 1.25 83.21 ± 1.45 98.6
6 Rice vinegar 8.7895 ± 0.1741 841.16 ± 11.21 818.12 ± 24.51 102.8
7 Lemon juice* 1.1074 ± .0133 109.08 ± 1.75 104.31± 1.83 104.5
8 Lemon juice 11.1251± 0.0215 1084.73 ± 22.71 1092.45 ± 24.32 99.3
9 Lemon juice* 1.0239 ± 0.0123 100.85 ± 1.21 97.51 ± 1.67 103.4
10 Lemon juice 10.3025 ± 0.1371 1014.78 ± 14.12 998.74 ± 26.92 101.6
11 Acajou juice 0.1328 ± 0.0022 12.51 ± 0.17 11.93 ± 0.19 104.8
12 Orange juice 1.0541± 0.0301 103.82 ± 2.59 104.32 ± 2.11 99.5
13 Orange juice 1.0991± 0.0195 108.26 ± 1.98 104.21±1.82 103.9
14 Pineapple juice 0.1444 ± 0.0019 13.29 ± 0.28 12.46 ± 0.19 106.7
15 Pineapple juice 0.1531 ± 0.0021 14.42 ± 0.23 14.73 ± 0.17 97.8
16 Acajou juice 0.1496 ± 0.0027 14.10 ± 0.26 14.32 ± 0.29 98.0
17 Orange juice 1.4311 ± 0.0216 140.96 ± 1.69 143.28 ± 1.72 98.5
18 Maracock juice 5.7832 ± 0.0685 544.78 ± 6.59 538.13 ± 10.22 101.2
19 Maracock juice 5.2751 ± 0.0693 496.91± 6.46 482.68 ± 5.31 102.9
Results of the proposed procedure are average of 5 consecutive titrations, while results of manual procedure are related to 3 titrations. The label * indicated that the sample was diluted ten times with water from the next one.
interval was related to the microcomputer performance, thus attention was given to the pumping low rates, which were determined daily prior to beginning the work. No signiicant variation was observed, demonstrating that a pair of pumping tubes could be used for one week.
Conclusions
Working continuously for 4 h, no significant measurement variation was observed, thus we can conclude that the long-term stability of the proposed twin LED photometer is very good. This assay was repeated one day per week for two months, and the results had similar precision. We concluded that the use of twin LEDs as a photometric transducer for photometric titration is reliable.
Samples of lemon juice presenting acid concentration 84 times higher than that of acajou juice were titrated using the same titration solution without any modiication of the titrating setup. This feature could be considered as an advantage comparing with titration earlier procedures based on low-bath approach,21,26 where the range of the acid
concentration in the samples was around one tenth. These results allow us to conclude that the software was able to ind the appropriated pathway to carry out the titration.
Acknowledgments
Authors acknowledge CNPq (Conselho Nacional de Desenvolvimento Cientíico e Tecnológico do Brasil) and CAPES (Coordenadenação de Aperfeiçoamento de Pessoal de Nível Superior) for the inancial support and Grant to Milton B. Silva and Carla C. Crispino.
References
1. Flaschka, H.; Mckeithan, C.; Barnes, R.; Anal. Lett.1973, 6, 585. 2. Betteridge, D.; Dagless, E. L.; Fields, B.; Graves, F.; Analyst
1978, 103, 897.
3. Dasgupta, P. K.; Bellamy, H. S.; Liu, H. H.; Lopez, J. L.; Loree, E. L.; Talanta1993, 40, 53.
4. Ellis, P. S.; Lyddy-Meaney, A. J.; Worsfold, P. J.; McKelvie, I.
D.; Anal. Chim. Acta 2003, 499, 81.
5. Dasgupta, P. K.; In-Yong, E.; Morris, K. J.; Jianzhong, Li.; Anal.
Chim. Acta 2003, 500, 337.
6. Jambunathan, S.; Dasgupta, P. K.; Wolcott, D. K.; Marshall, G. D.; Olson, D. C.; Talanta1999,50, 481.
7. Yonehara, F. S.; Pasquini, C.; Jarbas, J. R. R.; J. Braz. Chem. Soc.2005,16, 928.
9. Rodenas-Torralba, E.; Rocha, F. R. P.; Reis, B. F.; Morales-Rubio, A.; de la Guardia, M.; J. Autom. Methods Manage. Chem.
2006, Article ID 20384.
10. Fonseca, A.; Raimundo, I. M.; Anal. Chim. Acta2005, 522, 223.
11. Araújo, M. C. U.; Santos, S. R. B.; Silva, E. A.; Veras, G.; Lima, J. L. F. C.; Lapa, R. A. S.; Quim. Nova 1997,20,137. 12. Feres, M. A.; Reis, B. F.; Talanta2005,68, 422. 13. Muller, M., Hauser, P. C.; Analyst 1996,121, 339.
14. Zang, T.; Fang, S. Q.; Wang, L.; Qin, L. F.; Wang, P.; Wu, Z. Y.; Fang, Z. L.; Talanta 2005,68,19.
15. Fernandes, R. N.; Reis, B. F.; Talanta2002,58, 729. 16. Luca, G. C.; Reis, B. F.; Spectrochim. Acta, Part A2004, 60,
579.
17. Rocha, F. R. P.; Reis, B. F.; Anal. Chim. Acta2000, 409, 227. 18. Lau, K. T.; Baldwin, S.; L.Shepherd, R.; Dietz, P. H.; Yerzunis,
W. S.; Diamond, D.; Talanta2004, 63,167.
19. O’Toole, M.; Lau, K. T.; Shepherd, R.; Slater, C.; Diamond,
D.; Anal. Chim. Acta 2004,597, 290.
20. Tymecki, L.; Pokrzywnicka , M.; Koneki, R.; Analyst2008,
133, 1501.
21. Tymecki L.; Roncki, R.; Anal. Chim. Acta2009, 639, 73. 22. Honorato, R. S.; Araujo, M. C. U.; Lima R. A. C.; Zagatto, E.
A. G.; Lapa, R. A. S.; Lima, J. L. F. C.; Anal. Chim. Acta1999,
396, 91.
23. da Silva, M. J.; dos Anjos, E. V.; Honorato, R. S.; Pimentel, M. F.; Paim, A. P. S.; Anal. Chim. Acta 2008, 629, 98.
24. Lavorante, A. F.; Feres, M. A.; Reis, B. F.; Spectrosc. Lett. 2006,
39, 631.
25. Rocha, F. R. P.; Infante, C. M. C.; Melchert, W. R.; Spectrosc.
Lett. 2006, 39, 651.
26. Garcia, A. J. C.; Reis, B. F.; J. Autom. Methods Manage. Chem.
2006, Article ID 83247;DOI 10.1155/JAMMC/2006/83247.
Submitted: October 10, 2009 Published online: June 18, 2010