Printed in Brazil - ©2007 Sociedade Brasileira de Química 0103 - 5053 $6.00+0.00
ArticleArticleArticleArticleArticle
*e-mail: [email protected]
Flow-Injection Spectrophotometric System for Captopril Determination in Pharmaceuticals
Willian T. Suarez, Alexandro A. Madi, Luiz C. S. de Figueiredo-Filho and Orlando Fatibello-Filho*
Departamento de Química, Universidade Federal de São Carlos, CP 676, 13560-970 São Carlos-SP, Brazil
Um procedimento de análise por injeção em fluxo espectrofotométrico simples, exato e preciso é descrito para determinação de captopril em formulações farmacêuticas. Nesse procedimento o captopril é oxidado pelo Fe(III) produzindo Fe(II) que foi espectrofotometricamente monitorado como complexo Fe(II)-1,10-fenantrolina em 540 nm. A curva analítica para o captopril foi linear no intervalo de concentração de 1,0 × 10⁻⁵ a 8,0 × 10⁻⁴ mol L-1 com um limite de detecção de 5,0 ×
10-6 mol L-1. A recuperação deste analito em cinco amostras variou de 98,5 a 102,4%. A freqüência
de amostragem foi de 60 h-1 e o desvio padrão relativo (RSD) foi menor do que 0,2% para uma
solução de captopril 4,0 × 10⁻⁴ mol L-1 (n=10). O test-t pareado mostrou que os resultados obtidos
para o captopril em produtos farmacêuticos, usando o procedimento em fluxo proposto e o método potenciométrico, foram concordantes em um nível de confiança de 95%.
A simple, accurate and precise flow-injection spectrophotometric procedure is reported for the determination of captopril in pharmaceutical formulations. In this procedure, captopril was oxidized by iron(III) and the iron(II) produced was spectrophotometrically monitored as iron(II)-1,10-phenantroline complex at 540 nm. The analytical curve for captopril was linear in the concentration range from 1.0 × 10⁻⁵ to 8.0
× 10-4 mol L-1 with a detection limit of 5.0
× 10-6 mol
L-1. The recovery of this analyte in five samples ranged from 98.5 to 102.4%. The analytical
frequency was sixty determinations per hour and the RSD was less than 0.2% for a captopril concentration of 4.0 × 10⁻⁴ mol L-1 (n= 10). A paired t-test showed that all results obtained for captopril in commercial formulations using the proposed flow injection procedure and a potentiometric procedure agreed at the 95% confidence level.
Keywords: captopril, pharmaceutical formulations, flow injection, spectrophotometry
Introduction
Captopril, 1-[(2S)-3-mercapto-2-methylpropionyl]-L-proline, is an angiotensin-converting enzyme (ACE) inhibitor used for the treatment of hypertension and some types of congestive heart failure.1-3
Captopril was the first ACE inhibitor to be developed and was considered a breakthrough both because of its novel mechanism of action and also because of the revolutionary development process.4,5
Currently, captopril is applied in a broad range of pharmaceutical products and is quantified by several analytical methods including potentiometry,6,7 differential pulse
polarography,8 condutometry,9 stripping voltammetry,10
fluorimetry,11 spectrophotometry12,13 and
chemilumi-nescence.14,15 The United States Pharmacopoeia16 (USP)
describes a titrimetric procedure for captopril determination
in pharmaceutical formulations, but this procedure is very slow and laborious, and thus less applicable to large-scale analysis. Flow injection analysis systems are appropriate for use in routine analysis in pharmaceutical quality control laboratories due to their simplicity, high analytical frequency and their value in reducing reagent consumption when compared with batch procedures.17,18
There are several flow-injection procedures describing in the literature for determining captopril in pharmaceuticals such as amperometric,19 biamperometric,20
chemi-luminescence,21-25 and spectrophotometric.26-28
A flow injection system with spectrophotometric detection was reported26 for the determination of captopril.
J. Braz. Chem. Soc.
4.6 × 10⁻³ mol L-1, with a detection limit of 1.8 × 10⁻⁵ mol
L-1 and sampling frequency of 120 h-1. In another article
published by this same research group,27 captopril was
determined in pharmaceutical using a reversed flow injection method. The method is based on the inhibitory effect of captopril on the complex formation of Co(II) with 2,2’-dipyridyl-2-pyridylhydrazone. The calibration graph was linear in the range from 2.2 × 10⁻⁵ to 1.1 × 10⁻³ L-1
captopril, with a detection limit of the 1.2 × 10⁻⁵ L-1 captopril
and sampling frequency of 60 h-1.
Albero et al.28 described the use of a flow injection
spectrophotometric method for captopril determination involving the formation of a captopril complex with palladium(II) in a 0.12 mol L-1 HCl medium at 400 nm.
The calibration graph was linear over a captopril concentration range from 2.0 × 10⁻⁵ to 6.0 × 10⁻⁴ mol L-1
and sampling frequency of 90 h–1.
However, the drawback of these flow injection procedures is the relatively high cost of reagent28 and low solubility of
2,2’-dipyridyl-2-pyridylhydrazone in water solution.26,27
In the present work, a simple and inexpensive analytical procedure using flow injection analysis was developed for the routine determination of captopril in pharmaceutical formulations. The proposed flow injection procedure is based on the oxidation of captopril by iron(III), and the resulting iron(II) was quantified spectrophotometrically as a stable iron(II)-1,10-phenanthroline complex at 540 nm.
Experimental
Reagents and solutions
All reagents were of analytical grade and all solutions were prepared with water from a Millipore (Bedford, MA, USA) Milli-Q system model UV plus ultra-low organics water.
The 5.0 × 10⁻³ mol L-1 acetate buffer solution (pH 4.6)
was prepared by mixing appropriate volumes of 0.2 mol L-1 sodium acetate and 0.2 mol L-1 acetic acid (Merck),
and then diluting to 500 mL with deionized water. A 1.0 × 10⁻³ mol L-1 captopril stock solution was prepared
by dissolving 0.0109 g of captopril (Sigma) in acetate buffer solution and the volume was made up to 50 mL in a calibrated flask using the same acetate buffer solution. Reference solutions containing from 1.0 × 10⁻⁵ to 8.0 × 10⁻⁴ mol L–1 of
captopril were prepared by dilution of appropriate volumes of stock solution with 5.0 × 10⁻³ mol L-1 acetate buffer solution
(pH 4.6) in a 50 mL calibrated flask.
A 5.0 × 10⁻³ mol L-1 Fe(NO3)3
.
9H2O (Aldrich) solutionwas prepared by dissolving 0.1010 g with 5.0 × 10⁻⁴ mol
L–1 nitric acid solution and the volume was made up to
100 mL in a calibrated flask using the same acid solution in order to prevent the hydrolysis of Fe(III) ion.
A 5.0 × 10⁻³ mol L-1 1,10-phenanthroline solution was
prepared by dissolving 0.1982 g of this reagent (Synth) in 100 mL of deionized water heated to approximately 70 °C to aid in dissolving the reagent. After cooling this volume was transferred to a 200 mL calibrated flask and the volume was completed with deionized water.
Apparatus
A model 7618-50 12-channel Ismatec (Zurich, Switzerland) peristaltic pump supplied with Tygon® pump
tubing was used for the propulsion of the solutions. Sample and reference solutions were inserted in the flow system with the aid of a three-piece manual injector-commutator made of Perspex containing two fixed bars and a sliding central bar.29
A Femto model 435 spectrophotometer (São Paulo, Brazil) equipped with a glass flow-cell (optical path of 1 cm) was used for the spectrophotometric measurements. Transient signals were recorded using a Cole-Parmer (Chicago, IL, USA) model 1202-0000 two-channel strip-chart recorder.
Preparation and analysis of pharmaceutical samples
Pharmaceutical formulations containing captopril, including Generic® (Medley), Generic® (EMS Sigma
Pharma), Captopiril® (Bunker), Capoten® (Bristol-Myers
Squibb) and Captotec® (Hexal), were obtained from local
drugstores. The proposed method was applied to the analysis of three commercial pharmaceutical tablets containing 12.5 and 25 mg captopril per tablet. Five tablets of each formulation were powdered and dissolved in 5.0 × 10⁻³ mol
L-1 acetate buffer solution (pH 4.6). This solution was injected
directly into the carrier stream. The final results were expressed as the mean value of three determinations. No other treatment of the sample was required. The percentage content of captopril in these samples was determined by interpolation in the analytical curve and compared with the results obtained using a potentiometric procedure.6
Comparative method
solution was transferred to a thermostatically controlled glass cell at 25.0 ± 0.1 °C and potentiometrically titrated with a 2.0 × 10⁻² mol L-1 NaOH standard solution.
Flow injection procedure
A schematic diagram of the flow manifold is shown in Figure 1. The injector-commutator (I) is in the injection position. In this position, the reagent (L1, 250 µL) and
the sample or reference solution (L2, 150 µL) were
simultaneously injected and propelled by carrier streams (5.0 × 10⁻³ mol L-1 acetate buffer solution (pH 4.6)),
merging at point X. Captopril oxidation by Fe(III) occurs in reactor coil B1 (50 cm) producing Fe(II) ions that meet the chromogenic reagent stream (1,10-phenanthroline) at confluence point Y, with the subsequent chelation of Fe(II) by 1,10-phenanthroline in reactor coil B2 (70 cm). This product is monitored spectrophotometrically as a stable tris(1,10-phenanthroline)iron (II) complex at 540 nm.
Results and Discussion
Optimization of chemical and physical parameters
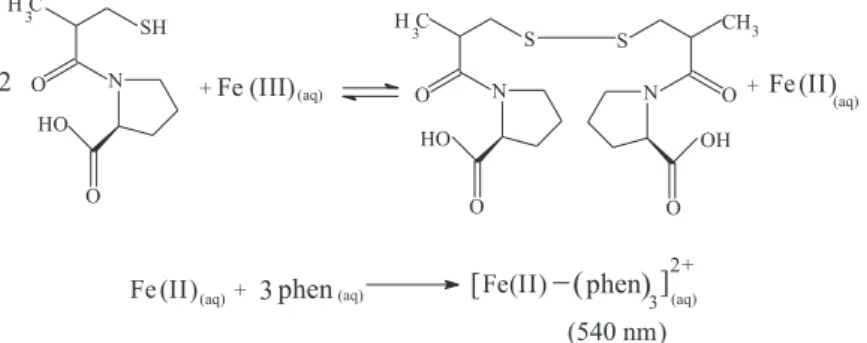
In this work, the development of the reaction occurs in two steps: the first step is the oxidation of captopril
by Fe(III) producing Fe(II) ions. In the second step Fe(II) is chelated by 1,10-phenantroline, and the product is monitored spectrophotometrically as a stable tris(1,10-phenanthroline)iron (II) complex at 540 nm (Scheme 1). The parameters of the flow injection system used in the quantification of the 1.0 × 10⁻³ mol L-1 captopril
solution were optimized by the univariate method with the purpose of maximizing the sensitivity, analytical frequency and reproducibility. Table 1 shows the chemical and flow injection parameters studied.
Preliminary experiments using the flow system were carried out to select the best carrier solution. Thus, the reproducibility, stability of baseline and analytical signal height as a function of the carrier solution were investigated. The response was examined in the presence of different carriers, such as: deionized water, 0.01 mol L-1 sodium nitrate solution and acetate buffer solutions at
pH 3.6, 4.6 and 5.6. Acetate buffer solution at pH 4.6 was selected as the optimum carrier solution due to the highest response and good reproducibility. The effect on the absorbance of varying the acetate buffer solution concentration was studied at 5.0 × 10⁻¹, 5.0 × 10⁻² and 5.0 × 10⁻³ mol L-1 concentrations. The best analytical signal
(S/N) was attained with a 5.0 × 10⁻³ mol L-1 acetate buffer
solution (pH 4.6) and this solution was used for further experiments.
Figure 1. Schematic diagram of the flow injection system used for the spectrophotometric determination of captopril. The central bar of the manual injector-commutator (I) shows the injection position. S, sample or reference solution; R1, Fe(NO3)3.9H2O (5.0 × 10⁻³ mol L-1 in 5.0 × 10⁻⁴ mol L-1 nitric acid); R2, 1,10-phenanthroline solution (5 × 10⁻³ mol L-1 at a flow rate of 1.3 mL min-1); L1, reagent loop (150 µL); L2, sample loop (250 µL); C, carrier solution (acetate buffer solution (pH 4.6) at a flow rate of 1.2 mL min-1); B1, reactor coil length (50 cm); B2, reactor coil length (70 cm); X and Y, confluence points; D, spectrophotometer (540 nm) and W, waste. X is the confluence point placed 5 cm from the injector-commutator.
)
D W
Y
B1 B2
X L1
L2
R1
S W
C C
I
W
R2
)
SH H C3
O N
O HO
2 +Fe (III)(aq)
H C3 3
O N
O
CH
O N
O
S S
OH
+Fe (II)
(aq)
HO
Fe (II)(aq)+ 3 phen(aq) [Fe(II) (phen
(
3
[ 2+
(aq)
(540 nm)
J. Braz. Chem. Soc.
The effect of ferric nitrate solution concentration upon the analytical response of the flow system was examined in the concentration range from 1.0 × 10⁻⁴ to 8.0 × 10⁻³ mol
L-1. It was observed that for ferric nitrate concentrations
higher than 5.0 × 10⁻³ mol L–1, the analytical signal
remained practically constant. Therefore, a 5.0 × 10⁻³ mol L-1
ferric nitrate solution was used for subsequent work. The influence of the 1,10-phenanthroline concentration was studied in the concentration range from 1.0 × 10⁻⁴ to
1.0 × 10⁻² mol L-1. The analytical signal increased with the
1,10-phenantroline concentration up to 5.0 × 10⁻³ mol L-1;
however, at concentrations higher than this the analytical signal remained practically constant. Consequently, a concentration of 5.0 × 10⁻³ mol L-1 of this chromogenic
reagent was selected in further investigations.
The effect of the sample and reagent injection volumes was studied by varying the volumes of L1 and L2 loops between 75-375 µL. The absorbance increased with greater
volumes up to 250 µL for sample and up to 150 µL for
reagent, above which the absorbance remained practically constant. Sample and reagent volumes of 250 µL and
150 µL were chosen as a good compromise between
analytical signal and sampling frequency.
The influence of the length of reactor coil B1, which determined the mixing conditions and the extent of the reaction of Fe(III) with captopril, was studied between 15 and 70 cm. The analytical signal increased up to 50 cm, with greater lengths leading to a decrease of the analytical signal as a result of excessive sample dispersion. Consequently, the reactor coil B1 length of 50 cm was selected for further experiments. The influence of the length of reactor coil B2 was also studied in the range from 30 to 100 cm. The chelation of Fe(II) with 1,10-phenanthroline occurs in this reactor. A reactor coil length of 70 cm was selected since this gave higher analytical signals and baseline stability. For the optimization of the reactor coils B1 and B2, the flow rates were kept at 1.2 mL min-1.
The influence of the flow rates of the carrier (C) and the reagent stream (R2) was examined in the range from 0.4 to 1.8 mL min-1 and from 0.7 to 2.3 mL min-1,
respectively. The analytical signal was increased by
increasing the flow rate up to 1.2 and 1.3 mL min-1 for the
carrier stream and reagent stream, respectively. When a higher flow rate of carrier stream was employed, the absorbance signal decreased probably due to a shorter residence time. Therefore, 1.2 mL min-1 (carrier stream)
and 1.3 mL min-1 (R2 stream) flow rates were selected,
taking into account the transient signals, stability of baseline and low reagent consumption.
Potential interference and recovery test
Recoveries from 98.5 to 102.4% of captopril were obtained from commercial formulations (n=3) using the proposed flow injection procedure under optimized conditions. In this study, 2.0 × 10⁻⁴, 4.0 × 10⁻⁴ and 6.0 ×
10-4 mol L-1 of captopril were added separately to each
sample. The recovery results obtained suggested an absence of matrix effect on those determinations and the accuracy of the proposed procedure.
In order to assess the possible analytical application of this spectrophotometric method to drug quality control, the effect of some common chemicals used as excipients, such as lactose, microcrystalline cellulose, starch and magnesium stearate was evaluated by comparison of the response for the reference solution containing 5.0 × 10⁻⁴
mol L-1 captopril with those produced by a similar
captopril solution with additions of the investigated excipients at final concentrations of 5.0 × 10⁻⁵ mol L-1
and 5.0 × 10⁻³ mol L-1. No interference in the response of
the flow system was observed up to a 10-fold excess of these studied substances, therefore it can be concluded that the proposed method is sufficiently selective for captopril determination.
Analytical characteristics and applications
The flow injection system gave a calibration curve for captopril in the concentration range from 1.0 × 10⁻⁵ to
8.0 × 10⁻⁴ mol L–1 (Abs = -0.00921 + 884.47 × [Cap];
r = 0.9996, where Abs is the absorbance and [Cap] is the captopril concentration in mol L–1.
A relative standard deviation (RSD) of less than 0.2% was obtained for a 4.0 × 10⁻⁴ mol L-1 captopril solution
(n= 10), with a detection limit of 5.0 × 10⁻⁶ mol L-1 (three
times blank standard deviation/slope of analytical curve) and an analytical frequency of 60 h-1. The proposed flow
injection system was applied under the optimized conditions to determine captopril levels in commercial formulations, and the results of this analysis are presented in Table 2. Applying a paired t-test in the results obtained by either procedure, it was found that all results are in
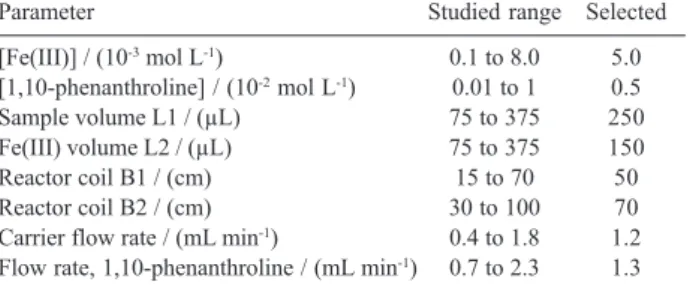
Table 1. Optimization of chemical and flow injection parameters
Parameter Studied range Selected
[Fe(III)] / (10-3 mol L-1) 0.1 to 8.0 5.0 [1,10-phenanthroline] / (10-2 mol L-1) 0.01 to 1 0.5
Sample volume L1 / (µL) 75 to 375 250
Fe(III) volume L2 / (µL) 75 to 375 150
Reactor coil B1 / (cm) 15 to 70 50
Reactor coil B2 / (cm) 30 to 100 70
close agreement at the 95% confidence level and within an acceptable range of error. Finally, beside the disadvantages pointed out in the introduction, the analytical curve range of the proposed flow injection is similar to that reported in the literature,26-28 and the
detection limits of those methods are high than that obtained in this work.
Conclusion
The proposed spectrophotometric flow injection procedure is fast, precise, accurate and sufficiently sensitive for the determination of captopril in pharmaceutical formulations and could be implemented in routine analysis.
Acknowledgments
Financial support from FAPESP, CAPES and CNPq is gratefully acknowledged.
References
1. Fiorey, K.; Analytical Profiles of Drug Substances, Academic Press: New York, 1982.
2. Romankiewicz, J.R.; Brogdon, R.N.; Heel, R.C.; Speight, T.M.; Avery, G.S.; Drugs1983, 25, 6.
3. Davis, R.; Ribner, H.; Keung, E.; Sonnenblick, E.; Le-Jemtel, T.; New England J. Med. 1979, 301, 117.
4. Patchett, A.A.; Harris, E.; Tristam, E.Q.; Nature1980, 288, 280.
5. Atkinson, A.B.; Robertson, J.I.S.; Lancet1979, 2, 836. 6. Ribeiro, P.R.D.; Santini, A.O.; Pezza, H.R.; Pezza, L.; Eclet.
Quim. 2003, 28, 39.
7. Nikolic, K.I.; Velasevic, V.R.; J. Pharm. Belg.1990, 45, 17. 8. Fraga, J.M.G.; Abizanda, A.I.J.; Moreno, F.J.; Leon, J.J.A.;
Talanta1998, 46, 75.
9. Nikolic, K.; Velasevic, K.; Pharmazie 1989, 44, 155. 10. Ziyatdinova, G.K.; Budnikov, G.K.; Pogoreltsev, V.I.; J. Anal.
Chem.2006, 61,798.
11. Al-Ghannam, S.M.; El-Brashy, A.M.; Al-Farhan, B.S.; Il Farmaco2002, 57, 625.
12. Askal, H.F.; Talanta1991, 38, 1155.
13. Panderi, I.; Parissipoulou, M.; Intern. J. Pharm.1992,86, 99. 14. Xinrong, Z.; Baeyens, W.R.G.; Vanderweken, G.; Calokerinos, A.C.; Nakashima, K.; J. Pharm. Biomed. Anal. 1995, 13, 425. 15. Zhang, X.R.; Baeyens, W.R.G.; Vanderweken, G.; Calokerinos,
A.C.; Nakashima, K.; Anal. Chim. Acta. 1995, 303, 121. 16. The United States Pharmacopoeia; Captopril; Rockville, 2000. 17. Martínez-Calatayud, J.; Flow Injection Analysis of
Pharmaceuticals - Automation in the Laboratory, Taylor and
Francis: New York, 1996.
18. Rocha, F.R.P.; Nóbrega, J.A.; Fatibello-Filho, O.; Green Chem. 2001, 3, 216.
19. Siangproh, W.; Ngamukot, P.; Chailapakul, O.; Sens. Actuators
2003, 91, 60.
20. Palomeque, M.E.; Band, B.S.F.; J. Pharm. Biomed. Anal. 2002,
30, 547.
21. Pulgarin, J.A.M.; Bermejo, L.G.F.; Lopez, P.F.; Anal. Chim. Acta. 2005, 546, 60.
22. Li, Y.H.; Zhang, A.H.; Du, J.X.; Lu, J.R.; Anal. Letters2003,
36, 871.
23. Economou, A.; Themelis, D.G.; Theodoridis, G.; Tzanavaras, P.D.; Anal. Chim. Acta2002, 463, 249.
24. Du, J.X.; Li, Y.H.; Lu, J.R.; Luminescence 2002, 17, 165. 25. Li, B.X.; Zhang, Z.J.; Wu, M.L.; Microchem. J. 2001, 70, 85. 26. Tzanavaras, P.D.; Themelis, D.G.; Economou, A.; Theodoridis, G.; Microchim. Acta 2003, 142, 55; Talanta.2002, 57, 575. 27. Tzanavaras, P.D.; Themelis, D.G.; Economou, A.; Theodoridis,
G.; Talanta2002, 57, 575.
28. Albero, M.I.; Sanchezpetreno, C.; Garcia, M.S.; Rodenas, V.;
J. Pharm Biomed. Anal.1993, 11, 887.
29. Martelli, P.B.; Reis, B.F.; Korn, M.; Rufini, I.A.; J. Braz. Chem. Soc.1997, 8, 479.
Received: December 12, 2006 Web Release Date: September 19, 2007
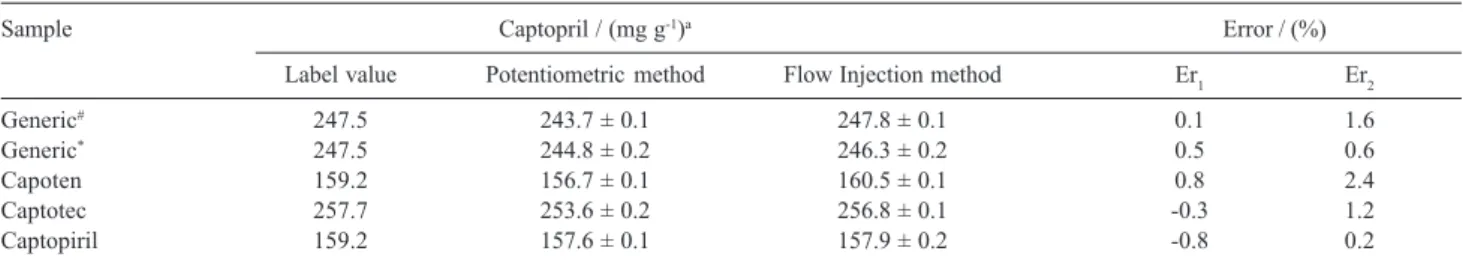
FAPESP helped in meeting the publication costs of this article. Table 2. Determination of captopril in pharmaceutical formulations employing the FIA system developed here and the potentiometric method6
Sample Captopril / (mg g-1)a Error / (%)
Label value Potentiometric method Flow Injection method Er1 Er2
Generic# 247.5 243.7 ± 0.1 247.8 ± 0.1 0.1 1.6
Generic* 247.5 244.8 ± 0.2 246.3 ± 0.2 0.5 0.6
Capoten 159.2 156.7 ± 0.1 160.5 ± 0.1 0.8 2.4
Captotec 257.7 253.6 ± 0.2 256.8 ± 0.1 -0.3 1.2
Captopiril 159.2 157.6 ± 0.1 157.9 ± 0.2 -0.8 0.2
aMean ± standard deviation; Er