Printed in Brazil - ©2007 Sociedade Brasileira de Química 0103 - 5053 $6.00+0.00
ArticleArticleArticleArticleArticle
*e-mail: [email protected]
Headspace Microextraction of Tin into an Aqueous Microdrop Containing Pd(II)
and Tributyl Phosphate for its Determination by ETAAS
Payman Hashemi,* Akram Rahimi, Ali Reza Ghiasvand and Mir Mehdi Abolghasemi
Department of Chemistry, Faculty of Science, Lorestan University, Khorram Abad, Iran
O estudo introduz um método para microextração por headspace (HS-SME) de hidreto de estanho em uma microgota aquosa contendo Pd(II) e tributil fosfato (TBP) como uma estratégia de enriquecimento e de modificação de matriz previamente à determinação por ETAAS. O hidreto de estanho foi gerado pela adição de um volume fixo de solução de borohidreto de sódio na amostra. Os efeitos de vários parâmetros, tais como volume da amostra, quantidade de NaBH4, Pd(II) e TBP na gota, tipo de ácido e concentração na amostra, tempo de extração e volume da gota, foram cuidadosamente estudados. Possíveis interferências causadas por concomitantes foram testadas e nenhum efeito significativo foi gerado por hidretos formados por outros elementos. Concentrações salinas de até 0,3 mol L-1 foram toleradas pelo método
HS-SME, porém aumentos drásticos nos sinais de absorbância e de fundo ocorreram em um método de injeção direta. O HS-SME mostrou-se um método sensível para determinação de estanho com um limite de detecção de 2,09 ng mL-1 e uma precisão melhor do que 4,04%
(RSD). O método foi aplicado com sucesso para a determinação de estanho em águas residuais e suspensões.
The study introduces a method for headspace solvent microextraction (HS-SME) of tin hydride into an aqueous microdrop containing Pd(II) and tributyl phosphate (TBP) as an enrichment and matrix modification method prior to ETAAS determination. The tin hydride was generated by injection of a fixed volume of sodium tetrahydroborate solution into the sample. Effects of several parameters including sample volume, amount of added NaBH4, Pd(II) and TBP concentrations in the drop, acid type and concentration in the sample, extraction time and drop volume were carefully studied. Possible interferences from a number of elements were tested and no significant interference from hydrides of other elements was observed. Salt concentrations up to 0.3 mol L-1 was tolerated by the HS-SME method while it drastically
increased the background and signal absorbances in a direct injection method. The HS-SME resulted in a relatively sensitive tin determination method with a detection limit of 2.09 ng mL-1 and a precision better than 4.04% (RSD). The method was successfully applied to the
determination of tin in waste water and slurry samples.
Keywords: tin determination, hydride generation, solvent microextraction, ETAAS
Introduction
Accurate tin determination is essential because of its importance from the biological and environmental points of views. Many different methods have been used for the determination of total tin or its species.1 ICP-MS has been
shown to be a sensitive method for the determination of
total tin2 but this method is highly influenced by the
interferences from matrix and is not suitable for high salt samples. In ETAAS methods also, interactions with the graphite furnace or reduced volatilities have been observed.3
The reaction of tin or organotin compounds with
sodium tetrahydroborate (NaBH4) to produce tin hydride
species has long been known.4-6 The reaction requires a
slight acidification of the water samples using acetic, hydrochloric or nitric acid. The use of this technique with ETAAS, however, is not straightforward and requires special settings and devices and/or modification of the graphite tube.7,8
Solid phase microextraction (SPME)9 and solvent
microextraction (SME)10,11 have been widely used in recent
years as powerful tools for the preconcentration and matrix separation of a variety of organic and inorganic
J. Braz. Chem. Soc.
have been often used in combination with a chromatographic separation step for tin speciation. Alternatively, direct coupling of a microextraction technique with a sensitive atomic spectroscopy method can lead to lower detection limits and faster tin determinations with substantially simpler and cheaper devices.19,20
To the best of our knowledge, there is no report on the coupling of HS-SME with ETAAS for the separation and determination of tin or tin species. However, this method has been successfully utilized for the extraction and determination of some other hydride forming elements in aqueous samples.21,22
The purpose of this work is to study the possibility of using a HS-SME-ETAAS method for the extraction and determination of tin in aqueous and slurry samples. The advantages and disadvantages of this method will be compared with an ordinary ETAAS technique with direct injection of tin solutions.
Experimental
Apparatus
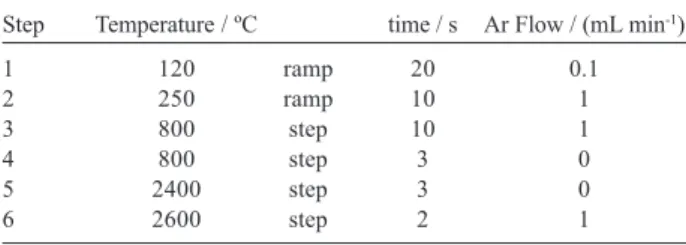
An ETAAS (Shimadzu AA6650, Japan) with a deuterium lamp background correction was used for tin determinations. Condensed Shimadzu graphite tubes of the wall atomization type were used for atomization. A Sn Shimadzu hollow-cathode lamp was employed as radiation source under the manufacturer’s recommended conditions. A wavelength of 224.61 nm was used for the spectrometer. The temperature program used for tin determinations is shown in Table 1. For pH determinations, a Jeneway model 3020 pH meter with a combined glass electrode was used after calibration against standard Merck buffers.
Chemicals and reagents
All chemicals and reagents were of analytical reagent grade (Merck, Germany) and used as received. Doubly
distilled water, prepared by a totally glass Fision (UK) double distiller, was used throughout. Tin stock solution (1000 mg L-1) was prepared by dissolving 0.1000 g of tin
powder in 10 mL of concentrated hydrochloric acid and dilution to 100 mL with pure water. Standard and test tin solutions were prepared by dilution of the stock solution with water. A sodium tetrahydroborate solution was prepared daily with a concentration of 2% (m/v) in 0.1
mol L-1 sodium hydroxide. A tributyl phosphate (TBP)
stock solution was prepared in acetone with a concentration of 3 mol L-1.
Methods
Solvent microextraction was performed in a 10 mL glass vial capped with a rubber stopper. The vial, containing 3 mL of an acidified sample and a small
magnetic bar, was placed on a magnetic stirrer. A 5 µL
microsyringe (Hamilton, Bonadoz AG, Switzerland) was fixed above the extraction vial such that the needle tip passed through the stopper and located in a fixed position
above the sample surface. Then, 0.5 mL of a 2% NaBH4
solution was injected through the stopper by a 1 mL polypropylene syringe. The generated tin hydride was sequestered onto a 3.5 µL drop suspended from the tip of the microsyringe. After a fixed extraction time, the drop was retracted back into the needle and injected directly onto the graphite tube of ETAAS.
A piece of welding lead (from a welding company in Khorram Abad, Iran) was dissolved in 10 mL of concentrated hydrochloric acid and diluted to volume with pure water in a volumetric flask and analysed as test solutions.
Waste water samples from an electroplating and an alloying plant (Army industries, Dorood, Iran) and from a battery manufacturing plant (Isfahan, Iran) were acidified
by 2 mol L-1 HCl and analysed with essentially the same
method as test solutions.
Results and Discussion
Effect of Pd(II) and TBP concentrations
Coating of graphite tubes by Pd or other platinum group elements is usually used for trapping hydrides prior to ETAAS determination.8 Fragueiro et al.22 used a Pd(II)
containing aqueous microdrop for sequestration of arsine from the headspace of their HS-SME system. In this work the effect of Pd(II) concentration on the tin signal was studied. As shown in Figure 1, the tin signal is increased by increasing Pd(II) in the microdrop up to a concentration Table 1. Temperature heating program for tin determinations by ETAAS
Step Temperature / ºC time / s Ar Flow / (mL min-1)
1 120 ramp 20 0.1
2 250 ramp 10 1
3 800 step 10 1
4 800 step 3 0
5 2400 step 3 0
of about 40 µg mL-1. Addition of this concentration of Pd(II) increases the Sn signal by a factor of about ten.
TBP is known as a sensitivity enhancing solvent for
tin compounds in ETAAS.23 Figure 1 shows the effect of
TBP concentration in the microdrop on the tin signal in our system. About five times sensitivity enhancement was observed for a TBP concentration of 0.1 mol L-1 or higher.
Effect of acid type and concentration
It is known that the production of tin hydride is sensitive to acid type and concentration.24-26 Hydrochloric and acetic
acids are among the most used acids for this purpose. In this work different concentrations of acetic acid and hydrochloric acid were tested for sample acidification prior to the addition of NaBH4. As it is shown in Figure 2, both acids were efficient but hydrochloric acid produced slightly higher tin signals than those of acetic acid.
Effect of NaBH4 volume and concentration
Different volumes and concentrations of sodium terahydroborate were used for the generation of tin
hydride. It was found that the tin signal increased by
increasing the concentration of NaBH4 solution in the
range of 0.5 to 2% (m/v). Using a concentration of 2%,
different volumes of NaBH4 solution were also tested.
As shown in Figure 3, the Sn signal increased by increasing the volume up to 0.4 mL and then leveled off. It should be mentioned that the use of higher
amounts of NaBH4 resulted in too high vapor pressures
in the vial that could cause gas leakages or even
detonations. A volume of 0.5 mL 2% NaBH4 solution
was taken as optimum.
Effect of sample and drop volumes
For the study of the effect of sample volume on the extraction efficiency of the HS-SME system, different sample volumes of 1 to 6 mL were tested in 10 mL extraction vials. As show in Figure 4, a maximum signal is observed for a sample volume of 3 mL. Further studies indicated that the optimum sample volume was dependent on the size of the vial used, as well. For instance, for a 15 mL bottle a maximum signal was observed for a sample volume of 5 mL.
Figure 4 also shows the effect of drop volume on the tin signal. An increase in the signal was observed with
Figure 2. Effect of HCl and acetic acid (HOAc) concentrations on the tin signal. Other experimental conditions are as in Figure 1.
0 0.05 0.1 0.15 0.2 0.25 0.3 0.35
0 0.2 0.4 0.6 0.8 1
Concentration / (mol L
Absorbance
-1 )
HCl HOAC
Figure 3. Effect of NaBH4 volume and concentration on the tin signal. Other experimental conditions are as in Figure 1.
0 0.05 0.1 0.15 0.2 0.25 0.3 0.35
0.5 1 1.5 2 2.5
Concentration / (mol L
Absorbance
-1 )
0.1 0.15 0.2 0.25 0.3 0.35 0.4 0.45 0.5 Volume / (mL)
Figure 4. Effect of sample and drop volumes on the tin signal. Other experimental conditions are as in Figure 1.
0 0.05 0.1 0.15 0.2 0.25 0.3 0.35
1 2 3 4 5 6
Sample volume / mL
Absorbance
1 1.5 2 2.5 3 3.5
Drop volume / µL
Figure 1. ETAAS tin signal as a function of Pd(II) and TBP concentrations in the drop solvent. Experimental conditions: sample volume, 3 mL; NaBH4 vo-lume, 0.4 mL; NaBH4 concentration, 2%; drop volume, 3.5 µL; tin concentra-tion, 20 ng mL-1; HCl concentration, 0.2 mol L-1; extraction time, 5 min.
0 0.05 0.1 0.15 0.2 0.25 0.3 0.35
0 10 20 30 40 50 60 70 80
Pd / (mg L
Absorbance
-1 )
0 0.05 0.1 0.15 0.2 0.25 0.3
J. Braz. Chem. Soc.
increasing the drop volume. However, large drop volumes were unstable with a high risk of falling down and hence,
a 3.5 µL volume was continued to be used in subsequent
experiments.
Effect of extraction time
Mass transfer is a time dependent procedure. In a closed extraction system, a time interval is needed for dissolution and evaporation phenomena to come to equilibrium. This time is dependent on the rates of the forward and backward processes. As shown in Figure 5, a maximum signal is obtained in about 5 min in our HS-SME system. In longer times some signal drift is observed that may be caused by partial evaporation of the microdrop.
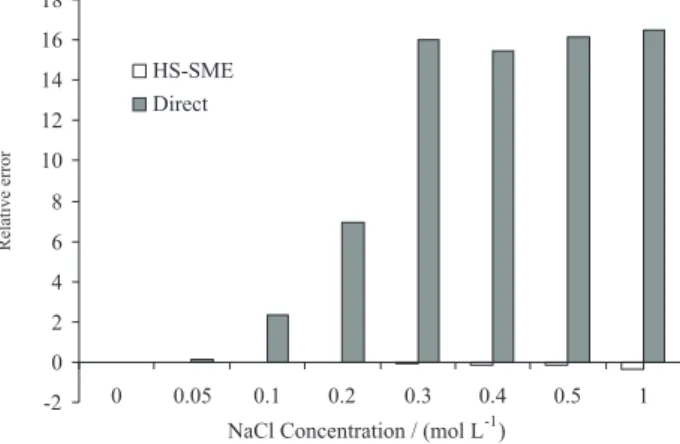
Effect of ionic strength
High salt samples have been always problematic in ETAAS determinations. A high concentration of NaCl in the sample matrix causes a high background signal that can not be compensated for easily. By using the proposed HS-SME method for tin determination this problem can be overcome. As shown in Figure 6, salt concentrations up to 0.3 mol L-1 did not have any significant effect on the
tin signal for the proposed method, while the signal was increased between 7 to 16 times when the same sample was directly injected into the graphite furnace of ETAAS instrument.
Effect of matrix ions
Effect of matrix ions was also studied by addition of some potentially interfering ions with a concentration of 20 µg mL-1 to a 20 ng mL-1 tin solution. As shown in Figure 7 the interferences from the studied diverse ions are lower for the proposed HS-SME method while they
are much higher for an ordinary ETAAS technique with direct injection of the same samples.
Detection limit and precision
Using the optimized conditions (i.e. TBP concentration, 0.1 mol L-1; Pd2+ concentration, 40 mg L-1; sample volume,
3 mL; NaBH4 volume, 0.4 mL; NaBH4 concentration, 2%;
drop volume, 3.5 µL; HCl concentration, 0.2 mol L-1 and extraction time, 5 min), a calibration graph with an equation of A= 0.0138C - 0.023 was obtained for standard solutions of 5 to 30 ng mL-1 Sn2+ with an R2 value of 0.9976. A
detection limit (3σ) of 2.09 ng mL-1 and a precision better that 4.04% (RSD) for ten measurements was obtained for the proposed HS-SME method.
Application for real samples
The proposed method was applied to the determination of inorganic tin in welding lead and three industrial waste water samples. The data given in Table 2 show a good agreement between the measured values using the Figure 5. Effect of extraction time on the tin signal. Other experimental
conditions are as in Figure 1.
Absorbance
0 0.05 0.1 0.15 0.2 0.25 0.3 0.35
0 1 2 3 4 5 6 7 8
Extraction time / min
Figure 6. Relative error in the tin signal determination as a function of NaCl concentration in the sample matrix for the direct ETAAS and HS-SME system. Other experimental conditions are as in Figure 1.
-2 0 2 4 6 8 10 12 14 16 18
0 0.05 0.1 0.2 0.3 0.4 0.5 1
NaCl Concentration / (mol L-1) HS-SME
Direct
Relative
error
Figure 7. Percent of relative error in the tin determination in presence of 100 times concentrations of matrix ions for the direct ETAAS and HS-SME methods. Other experimental conditions are as in Figure 1.
Zn(II) As(III)
Pb(II) Ni(II)
Se(IV) Bi(III)
Cd(II) Cu(II)
Zn(II) As(III)
Pb(II)
Ni(II) Se(IV)
Bi(III) Cd(II)
Cu(II)
-20 -15 -10 -5 0 5 10 15 20
Interfering ion
HS-SME Direct
Relative
error
/
proposed method and those reported by AAS laboratory at Lorestan University, Khorram Abad, Iran.
It may be concluded that the proposed HS-SME-ETAAS system can be successfully used for tin determinations in aqueous and slurry samples. In comparison to an ordinary ETAAS method with direct injection, the proposed method is somewhat more sensitive and tolerates much higher salt concentrations and less interferences by matrix ions. The method is also simpler and cheaper in comparison to a conventional hydride generation ETAAS method.
References
1. Leroy, M. J. F.; Quevauviller, P.; Donard, O.F.X.; Astruc, M.;
Pure Appl. Chem.1998, 70, 2051.
2. Yoshinaga, J.; Nakama, A.; Takata, K.; Analyst1999, 124, 257. 3. Subramanian, K. S.; Talanta1989, 36, 1075.
4. Nakahara, T.; Appl. Spectrosc.1983, 37, 539.
5. Tsalev, D. L.; Sperling, M.; Welz, B.; Analyst1992, 117, 1735. 6. Zhaolun, F.; Lijing, S.; Hansen, E. H.; Olesen, J.E.; Henriksen,
L.M.; Talanta1992, 39, 383.
7. Meinrat, O. A.; James, T.B.; Anal. Chim. Acta1984, 156, 147. 8. Sturgeon, R. E.; Willie, S. N.; Sproule, G.I.; Robinson, P.T.;
Berman, S. S.; Spectrochim. Acta, Part B1989, 44, 667. 9. Vas, G.; Vekey, K.; J. Mass Spectrom. 2004, 39, 233. 10. Psillakis, E.; Kalogerakis, N.; Trends Anal. Chem. 2003, 22,
565.
11. Felix, E. P.; Cardoso, A. A.; J. Braz. Chem. Soc.2006, 17, 296.
12. Millan, E.; Pawliszyn, J.; J. Chromatogr., A2000, 73, 63. 13. Centineo, G.; Gonzalez, E. B.; Sanz-Medel, A.; J. Chromatogr.,
A2004, 1034, 191.
14. Tripathi, R. M.; Mahapatra, S.; Sadasivan S.; Puranik, V. D.; J. Phys. IV France2003, 107, 1313.
15. Carpinteiro, J.; Rodriguez, I.; Cela, R.; Anal. Bioanal. Chem.
2004, 380, 853.
16. Liu, J. Y.; Jiang, G. B.; Zhou, Q. F.; Yang, K. W.; J. Sep. Sci.
2001, 24, 459.
17. Broeck, P. V. D.; Sandra, P.; Anal. Chem. 1997, 69, 1604. 18. Colombini, V.; Bancon-Montigny, C.; Yang, L.; Maxwell, P.;
Sturgeon, R. E.; Mester, Z.; Talanta2004, 63, 555.
19. Mester, Z.; Sturgeon, R.E.; Lam, J.W.; Maxwella P.S.; Peter, L.; J. Anal. At. Spectrom. 2001, 16, 1313.
20. Mester, Z.; J. Anal. At. Spectrom. 2002, 17, 868.
21. Chamsaz, M.; Arbab-Zavar M.H.; Nazari, S.; J. Anal. At. Spectrom. 2003, 18, 1279.
22. Fragueiro, S.; Lavilla, I.; Bendicho, C.; Spectrochim. Acta, Part B2004, 59, 851.
23. Li, H.; Gong, B.; Matsumoto, K.; Anal. Chem. 1996, 68, 2277. 24. Thompson, M.; Pahlavanpour, B.; Anal. Chim. Acta1979, 109,
251.
25. DeDoncker, K.; Dumary, R.; Dams R.; Hoste, J.; Anal. Chim. Acta1986, 187, 163.
26. Campbell, A. D.; Pure Appl. Chem. 1992, 64, 227.
Received: December 22, 2006 Web Release Date: September 4, 2007
Table 2. Application of the developed HS-SME method for determination of tin in real samples: mean values and standard derivationsa (µg L-1, n=3)
Sample Developed method Reference method
Welding lead (Khorram Abad, Iran) 181.50 (±5.1) 183.2 (±4.2)
Waste water (from an electroplating plant, Army industries, Dorood, Iran) 024.73 (±0.73) 25.92 (±0.49) Slurry waste water ( from an alloying plant, Army industries, Dorood, Iran) 010.00 (±0.38) 10b Waste water (from a battery manufacturing plant, Isfahan, Iran) 009.68 (±0.47) 10b
aExperimental conditions: TBP concentration, 0.1 mol L-1; Pd2+ concentration, 40 mg L-1; sample volume, 3 mL; NaBH