0103 - 5053 $6.00+0.00
Article
* e-mail: [email protected]
Synthesis, Spectroscopy and Photosensitizing Properties of Hydroxynitrophenylporphyrins
Ana Paula J. Maestrin, Antonio Cláudio Tedesco, Cláudio R. Neri, Maria Elisa F. Gandini, Osvaldo A. Serra* and Yassuko Iamamoto
Departamento de Química, FFCLRP, Universidade de São Paulo, Av. Bandeirantes 3900, 14040-901 Ribeirão Preto - SP - Brazil
As hidroxinitrofenilporfirinas, 5,10,15,20-tetrakis(2-hidroxi-nitrofenil)porfirina e 5-mono(carboxifenil)-10,15,20-tris(2-hidroxi-5-nitrofenil)porfirina, estudadas neste trabalho, foram preparadas pelo método de Adler e caracterizadas por 1H RMN e por espectroscopia de absorção e
emissão na região espectral visível. A formação de 1O
2 foi constatada através do teste do ácido úrico
(AU), o qual consiste na observação do decréscimo na absorbância da banda do AU em 293 nm, após irradiação da solução, com laser, contendo o fotossenssibilizador e o AU. Os resultado obtidos indicaram que as hidroxinitrofenilporfirinas podem ser consideradas potenciais fotossensibilizadores para terapia fotodinâmica.
The hydroxynitrophenylporphyrins, 5,10,15,20-tetrakis(2-hydroxy-5-nitrophenyl)porphyrin and 5-mono(carboxyphenyl)-10,15,20-tris(2-hydroxy-5-nitrophenyl)porphyrin described in this work were prepared through Adler’s method. These compounds were characterized by 1H NMR and light
absorption and emission spectroscopy in the visible region. In order to demonstrate the involvement of 1O
2 production, the uric (UA) acid test was carried out, which considers the decrease in the
absorbance of UA at 293 nm following laser light irradiation of a solution containing UA and a photosensitizer. The results obtained demonstrate that these hydroxynitrophenylporphyrins can be considered as promising photosensitizers in PDT.
Keywords:porphyrins, photodynamic therapy, singlet oxygen, uric acid
Introduction
Photodynamic therapy (PDT) is one of the most promising modalities currently explored for use in tumor
control.1 PDT involves selective retention of a
photosensitizer in the tumor, followed by irradiation with light of a particular wavelength, which initiates tumor necrosis presumably through the formation of singlet oxygen. Optimal tissue penetration by light occurs between 650-800 nm. The first generation of sensitizers, represented by Photofrin®, absorbs only weakly at about 630 nm. This
has led to the search for the so-called “second generation” sensitizers, which absorb at longer wavelengths and have well established structures. Porphyrins, and porphyrin-type macrocycles, such as chlorins, bacteriochlorins and purpurins, represent a major class of photosensitizing agents that are useful in an array of medical areas, including oncology, cardiology, ophthalmology, dermatology,
immunology, gynecology and urology.2 One example
concerning the ophthalmology area is a recent (November 1999) recommendation by the FDA scientific advisory
board for approval of Visudyne (verteporfin, a
benzoporphyrin mono-acid ring A, derivative BPDMA) as a PDT-type photosensitizer for the treatment of the age-related macular degeneration (AMD). Other porphyrin-type agents such as Purlytin (SnET2, by Miravant Medical and Pharmacia Upjohn) and Optrin, a Motexafin luteniun (Lu-Tex, by Pharmacyclics Inc.) are also under current clinical investigation for the treatment of AMD. Chlorin derivatives such as NPe6 (mono-L-aspartyl chlorin e6, developed by Nippon Chemical Co.) and m-THPC (Temoporfin, by Scotia QuantaNova) have been tested as sensitizing agents in the treatment of a number of malignancies for oncological applications.2
processes are oxidative, and usually involve singlet oxygen
or reactive radicalar oxygen species.3 Additional
information about the photobleaching behavior of sensitizers is needed to calculate the optimum PDT dose. The first relevant observation of photobleaching was reported in 1986 by Moan et al, using Photofrin.4 Studies
with m-THPC, which has been investigated in both
preclinical and preliminary clinical studies with promising results, have attracted interest in recent years.5 It is
noteworthy that m-THPC is a very powerful PDT photosensitizer and presents some advantages over HPD and Photofrin in many aspects: (i) it has been selected on the basis of tumor necrotic activity in vivo after examining a considerable number of photosensitizer preparations and because of its selectivity for tumor over normal tissue; (ii) it has strong absorption at 652 nm, and a Φ∆ value of 0.43; (iii) the synthetic route is convenient and short (iv) it is a single substance; (v) dark toxicity is low and it is not mutagenic.
Since substitution in phenyl groups confers some degree of hidrophilicity and may cause a bathochromic shift-moving Q Band to red, our goal is to find an innovative formulation for new photosensitizers based on hydroxyphenyl systems. In this paper we report the synthesis, photophysical characterizations and photodynamic properties of
5,10,15,20-tetrakis(2-hydroxy-5-nitrophenyl)porphyrin, T2H5NPPH2, and
5-
mono(carboxyphenyl)-10,15,20-tris(2-hydroxy-5-nitrophenyl)porphyrin, MCT2H5NPPH2.
Experimental
Ultraviolet-visible (UV-Vis) absorption spectra were recorded on a Hewlett-Packard 8453, Diode Array spectrophotometer. Emission spectra were recorded on a SPEX TRIAX FLUOROLOG 3, using spectroscopic grade methanol as solvent. Infrared (IR) spectra were recorded on a Nicolet FT-IR 5ZDX spectrometer. 1H NMR: Nuclear
magnetic resonance spectra were recorded on a Brüker DR XC 400 MHz, 9,4 T spectrometer in MeOD using TMS as internal standard. The chemical shifts are expressed in δ
(ppm).
The uric acid test was recorded on a Hewlett Packard 8543 spectrophotometer, and irradiation with a Radio Shack LX 1000, 5 mW, 671 nm.
All reagents were purchased from Aldrich or Sigma and used without further purification. Solvents were dried when necessary using standard techniques. Column chromato-graphy was carried out with silica gel 60 (Merck, 230-400 mesh) or aluminum oxide (Merck, 70-230 mesh).
Synthesis of 5,10,15,20-tetrakis(2-hydroxy-5-nitrophenyl)porphyrin, T2H5NPPH2
The synthesis of T2H5NPPH2 was carried out through the method described by Adler et al.,6 involving the
condensation of pyrrole and 2-hydroxy-5-nitroben-zaldehyde (15 mmol) in a 1:1 molar ratio in propionic acid, at 141 ºC. The crude product was purified by silica gel chromatography using dichloromethane as eluent.
T2H5NPPH2 was isolated by silica gel chromatography
using ethanol as eluent. The yield was 72%. UV-Vis in EtOH λmax nm (ε, mol
-1 L cm-1), 310, 416 (1.4
× 105) (Soret band), 510 and 653 (3.4 × 10⁴). 1H NMR (300
MHz, MeOD) δ 8.72 (br s, 8H), 8.76 (brs, 4H), 8.45 (s, 4H), 8.45 (d, 2H, J 1.57Hz), 7.23 (d, 2H, J 1.57Hz), 7.24 (s, 4H), -2.1 (s, 2H). Anal. cal. for C44H26N8O12.2H2O; C, 59.2; H, 3.5; N, 12.3. Found: C, 59.9; H, 4.2; N, 11.4%.
Synthesis of 5-mono(carboxyphenyl)-10,15,20-tris(2-hydroxy-5-nitrophenyl)porphyrin, MCT2H5NPPH2
The preparation of MCT2H5NPPH2 was carried out
through the method of involving Adler et al 6, the
condensation of pyrrole (1.1 mL, 16 mmol), 2-hydroxy-5-nitrobenzaldehyde (1.8 g, 10.8 mmol) and carboxy-benzaldehyde (0.6 g, 4 mmol) in 80 mL of propionic acid, at 141 ºC. Propionic acid was removed under reduced pressure. The crude product was initially purified by silica gel chromatography (250 g) using dichloromethane as eluent. The porphyrins formed during the synthesis were separated by aluminum oxide chromatography (25 g) using EtOH: HAc (1%) as eluent, and later silica gel chromatography (25 g) using ACN: HAc (1%). The yield was 30% (414 mg).
UV-Vis in (ACN) λmax nm (ε, mol
-1 L cm-1) 303, 370
(shoulder), 416 (3.0 ×10⁵, Soret band), 511 and 654 (weak).
IR νmax /cm
-1: 3419 (s) (OH group), 1578 (m) (asymmetric
stretching NO2 group), 3145 (m) (OH of carboxylic acid) and 1400 (vs) (COO-). 1H NMR (300 MHz, MeOD), δ 8.79
(br s, 8H), 8.70 (m, 3H), 8.54 (d, 3H, J 3.15Hz), 8.51 (d, 1H, J 3.15Hz), 8.30 (d, 2H, J 1.57Hz), 8.16 (d, 2H, J 1.57Hz), 8.02 (s, 3H), 7.32 (d, 3H J 1.57Hz). ESI+ spectra was
recorded for MCT2H5NPPH2, give as the major peak [MM] = 840.
Uric acid test 7
In order to verify the photodynamic activity of
T2H5NPPH2 and MCT2H5NPPH2 the uric acid test was
carried out.7 A mixture (3 mL) of UA (10-3 mol L-1) and
cuvette. For all measurements, the solutions were magnetically stirred and kept at 25 oC for 1800 s. After
irradiation at 671 nm, the absorbance spectra (200-700 nm) were registered every 3 min.
Photodynamic activity scale (PA). Based on the UA test, the data obtained for each porphyrin could be mathematically determined by the modified Fischer expression (1). All laser light is focused on the sample solution.
PA = ∆AUA 105 / Wt A
PSλirr (1)
PA = photodynamic activity; ∆AUA= UA absorbance
decrease at 293 nm in UA and PS solution after irradiation; W = laser power (mW); t= irradiation time (s) and APSλirr =
absorbance of PS in UA and PS solution at the irradiation wavelength (671 nm).
Results and Discussion
Synthesis
Synthetic schemes for the syntheses of T2H5NPPH2
and MCT2H5NPPH2 are presented in Figure 1. The
porphyrins were prepared as described in the literature by Adler et al.6 This synthesis involves the condensation of
pyrrole with benzaldehyde, under reflux in propionic acid at 141oC. In such reaction, no oxidant was added to the
reaction mixture and the porphyrins were directly obtained in their oxidized form by using atmospheric O2. This type
of reaction is often used for the preparation of pyridyl, carboxyl and hydroxyl substituted tetraphenylporphyrins. The synthesis of porphyrins bearing four identical meso-phenyl substituents, such as T2H5NPPH2, is provided by condensation of 2-hydroxy-5-nitrobenzaldehyde and pyrrole. In this case, a high crude porphyrin yield of 72% was obtained (estimated by UV-Vis), Figure 1a.
A mixed aldehyde condensation using stoichiometric amounts of two different benzaldehydes (A) and (B) and pyrrole affords a mixture of six different porphyrins, which can be separated chromatographically.8
In order to decrease the number of porphyrins obtained in the synthesis and to avoid extremely tedious chromatographic purification, the system was optimised with small-scale reactions using different rations of the
two aldehydes. In this way, in the synthesis of A3B
porphyrin, the initial ratio of pyrrole: 2-hydroxy-5-nitrobenzaldehyde: 4-carboxybenzaldehyde used was 4: 2,7: 1. This synthesis gave a crude yield of 30% (estimated by the absorption of the Soret band in the UV-Vis spectrum of the reaction mixture) corresponding to the mixture of A4 and A3B porphyrins, Figure 1b.The final yield of MCT2H5NPPH2 after purification was 5%.
Absorption and fluorescence spectra
UV-Vis absorption spectra of the porphyrins T2H5NPPH2 in ethanol and MCT2H5NPPH2 in acetonitrile are shown in Figure 2. T2H5NPPH2 displayed a intense Soret band at 416 nm (ε = 1.4×10⁵ mol-1 L cm-1) and a
Q(0,0) band (ε = 3.4×10 mol-1 L cm-1) at 653 nm.
MCT2H5NPPH2 presented a highly intense Soret band at 416 nm (ε = 3.9×10⁵ mol-1 L cm-1) and a Q(0.0) band (ε =
6.6×10³ mol-1 L cm-1) at 652 nm. The absorption spectra of
T2H5NPPH2 and MCT2H5NPPH2 are very similar to that of THPPH2 9, despite the presence of two different
substituents on the meso-phenyl rings.
Fluorescence emission spectra of T2H5NPPH2 and
MCT2H5NPPH2 in ethanol are shown in Figure 3. The
spectra of these porphyrins exhibited two maxima, a strong and broad Q(0,0) fluorescence band near 652 nm, instead of a weaker one and a weaker emission band in 713 nm. The same values of λem were obtained by exciting the
samples at the wavelength of maximum absorption of the Soret and the Q-bands. The two bands are characteristic of similar porphyrins such as THPPH2 ,9 and they have been
assigned to Q(0,0) and Q(0,1) transitions.10
Uric acid test
Uric acid, a known singlet oxygen scavenger, has been
used as a chemical dosimeter for the determination of the photodynamic action of different photosensitizers (PS). The production of 1O
2. appears to be associated with the
photodynamic action of sensitizers. The process involved in the photodynamic mechanism can be represented in the reactions described below, (where P = photosensitizer, S0, S1 =ground, first excited, singlet states, T1 first excited triplet state, isc = intersystem crossing, 3O
2 = ground state
triplet dioxygen, 1O
2 = first excited singlet state of
dioxygen). 11
hv isc
P(S0) P(S1) P(T1) P(T1) + 3O
2 P(S0) + 1O
2
Photosensitizers have a stable electronic ground state. Following absorption of a photon of specific wavelength the molecule is promoted to a short-lived excited state, which is deactivated by emitting a photon (fluorescence) or by internal conversion, with the energy loss as heat. It is also possible that the molecule is converted to the triplet
Figure 2. Absorption spectra: a) T2H5NPPH2 in ethanol and b)
Figure 3. Emission spectra: a) T2H5NPPH2 in ethanol and b) MCT2H5NPPH2 in acetonitrile. λexc = 400 nm.
state via intersystem crossing, which involves a change in the spin. The triplet state has lower energy than the singlet state and a longer lifetime (> 500 ns for photosensitizers), both of which increase the probability of energy transfer to other molecules. It has been shown that oxygen plays a fundamental role in the photochemistry of many photosensitizing drugs used in photodynamic therapy.7
The products of UA photosensitized oxygenation via
1O
2 in human serum are known
12 to be triuret, sodium
oxanate, allantoxaidin and CO2 (Figure 4).
In order to test the photodynamic action of T2H5NPPH2
and MCT2H5NPPH2 modulated by 1O
2, we irradiated, at
the same constant concentration, porphyrins in the presence of uric acid. The PS absorbance didn’t decrease in the absence of uric acid. This test procedure, under the same conditions, was also performed for THPPH2 to confirm our results. The absorbance versus irradiation time graph
of the solutions containing each porphyrin THPPH2,
T2H5NPPH2 and MCT2H5NPPH2 in the presence of UA
after laser irradiation (671 nm) are shown in Figure 5.
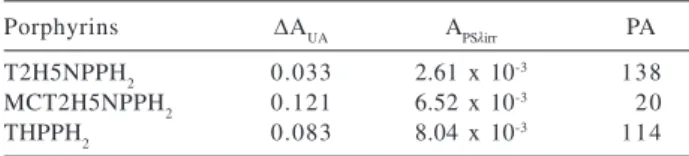
Irradiation parameters (wavelength, laser power and time) and PS concentration remained constant. After laser irradiation at 671 nm, specific degradation of uric acid was observed in the solution containing the porphyrins, as shown by the decrease in the absorbance of the 293 nm bandsuch decay was used to calculate the Photodynamic Activity (PA).13 These results were compared with THPPH
2
and are shown in the Table 1.
The photosensitizers T2H5NPPH2 and
MCT2H5NPPH2, present good stability due to the presence
of the NO2 and OH groups bound to the phenyl ring.
T2H5NPPH2 showed a high PA value (if compared to
THPPH2) even though it presents a low absorption
coefficient at 671 nm. Based on the UA test, it is possible to define a photodynamic activity scale, which may be a good tool for comparing the PA of different photosensitizers.13
Figure 4. Photo-oxidation of uric acid via 1O
2.
Figure 5. Graph of uric acid degradation (293nm) in the solution
Acknowledgements
Brazilian agencies CAPES, CNPq and FAPESP supported this work.
References
1. Mody,T. D.; J. Porphyrins Phtalocyanines2000, 4, 362. 2. Mody T. D. and Pandey R. K.; J. Porphyrins Phtalocyanines
2001, 5, 103; Sternberg E. D., Dolphin, D.; Tetrahedron1998,
54, 4151.
3. Hadjur, C.; Lange N., Rebstein, J.; Monnier, P.; van den Bergh, H.; Wagnieres, G; J. Photochem. Photobiol., B 1998, 45, 170. 4. Martinez, G.; Tetrahedron2001, 57, 9513.
Table 1. PA values for T2H5NPPH2, MCT2H5NPPH2 and THPPH2
in ethanol. determined by the modified Fischer expression13
Porphyrins ∆AUA APSλirr PA
T2H5NPPH2 0.033 2.61 x 10⁻³ 138
MCT2H5NPPH2 0.121 6.52 x 10⁻³ 02 0
THPPH2 0.083 8.04 x 10⁻³ 114
∆AUA = UA absorbance decrease at 293 nm in UA and PS solution after irradiation, APSλirr = absorbance of PS in UA and PS solution at 671 nm (laser irradiation wavelength), PA = photodynamic activity.
5. Wagnieres, G.; Hadjur, C.; Grosjean, P.; Braichotte, D.; Savary, J.-F.; Monnier, P.; van den Bergh, H.; Photochem. Photobiol.
1998, 68, 382.
6. Adler, A.D.; Longo, F.R., Finarelli, J.; Goldmacher, J.; Assour, J.; J. Org. Chem. 1967, 32, 476.
7. Fischer, F.; Granchew, G.; Sinn, H-J.; Maier-Borst, W.; Lorenz, W.J.; and Schlag, P.M.; Clin. Chim. Acta1998, 274, 89. 8. Schiavon, M.A.; Iwamoto, L.S.; Ferreira, A.G.; Iamamoto, Y.;
Zanoni, M.V.B.; Assis, M.D.; J. Braz. Chem. Soc.2000, 11, 458.
9. Bonnett, R; Charleseworth, P.; Djelal, B.D.; Foley, S.; McGarvey, D.J.; Truscott, T.G.; J. Chem. Soc., Perkin Trans. 1999, 2, 325. 10. Milanesio, M.E.; Morán, F.S.; Yslas, E.I.; Alvarez, M.G.; Rivarola, V.; Durantini, E.N.; Bioorg. Med. Chem. 2001, 9, 1943.
11. Bonnett, R.; Chem. Soc. Rev. 1995, 19.
12. Canellakis, E.S.; Cohen, P.P.; J. Biol. Chem.1955, 213,379. Matsura, T.; Saito, I.; Tetrahedron1968, 24, 6609.
13. Serra, O.A.; Ribeiro, A.O.; Iamamoto, Y.; Neri, C.R.; Maestrin, A.P.J.; Mater. Sci.2002, 20, 69.
Received: August 19, 2003
Published on the web: September 1, 2004