Nota Técnica
*e-mail: [email protected]
QUANTIFICATION OF THE URANIUM CONCENTRATION IN HUMAN URINE BY INDUCTIVELY COUPLED PLASMA-SECTOR FIELD MASS SPECTROMETRY (ICP-SFMS)
Héctor Hernández-Mendoza*
Departamento de Química, Instituto Nacional de Investigaciones Nucleares, Carretera México-Toluca s/n, 52750 La Marquesa Ocoyoacac, México
Estefanía Conde, Marta Fernández and Abel Yllera
Centro de Investigaciones Energéticas, Medioambientales y Tecnológicas (CIEMAT) Av. Complutense 22, Madrid 28040, Spain
Recebido em 23/5/12; aceito em 19/12/12; publicado na web em 24/5/13
In this study, the validation of a method for analyzing the uranium (U) concentration in human urine samples by inductively coupled plasma-sector field mass spectrometry (ICP-SFMS) was conducted. PROCORAD (the Association for the Promotion of Quality Control in Radiotoxicological Analysis) provided two urine samples spiked with unknown contents of U (Sample A = 33.6 ± 1.0 µg/L and Sample B = 3.3 ± 0.1 µg/L) and one unspiked sample as a blank. The analyses were directly performed on the diluted urine samples (dilution factor = 1:20) in 5% v/v HNO3. The results obtained by ICP-SFMS corresponded well with the reference values, and the limits of detection were 235U = 0.049 × 10⁻³ µg/L and 238U = 7.37 × 10⁻³ µg/L. The ICP-SFMS technique has been shown to be successful in the analysis of the U concentration in human urine samples and for the quantification of isotopic ratios.
Keywords: uranium; urine; ICP-MS.
INTRODUCTION
Uranium (U) is a naturally occurring radioactive element, which is found in varying amounts in the environment (soil: ~1 × 10³–5 ×
103 µg/Kg; water: ~0.1–5 µg/L), and the anthropogenic addition to
this natural background is insignificant, except near point sources of U release. Natural U consists of three radioactive isotopes with the following relative isotopic abundances: 234U (0.00515%), 235U
(0.71192%), and 238U (99.282%).1 Regarding toxicity for humans,
the aerosol exposure pathway is critical for hazard assessment in which inhalation exposure to relatively insoluble U oxide particles represents a potentially long-term reservoir of internal alpha decay activity that can cause cell damage.2 Although variable quantities of
either soluble or insoluble natural U are regularly ingested by con-sumption of food and drink, little of this U is absorbed into the blood stream.3 According to the World Health Organization,4 around 98% of
U entering the body via ingestion is not absorbed, but is eliminated via feces. Typical gut absorption rates for U in food and water are around 2% for soluble and around 0.2% for insoluble U compounds. For some soluble forms, more than 20% of the inhaled material can be absorbed into the blood. Of the U that is absorbed into the blood, approximately 70% will be filtered by the kidneys and excreted in the urine within 24 h; this amount increases to 90% within a few days after exposure. Average annual intakes of U by adults are estimated to be around 5 × 10² µg by ingestion of food and water and 0.6 µg
by breathing air.5
The human body contains, on average, approximately 90 µg of U from normal intakes of water, food, and air. Around 66% is found in the skeleton, 16% in the liver, 8% in the kidneys, and 10% in other tissues.5,6 U excretion in feces and urine for non-exposed subjects is
typically on the order of some nanogram per day,7 but it may depend
on the dietary habits.1
In the case of professionally exposed staff (such as workers in nuclear power plants, military industry, U mining, and scientific re-search), the occupational monitoring of workers exposed to the risk of
contamination in the workplace is imperative.8 The routine bioassay of
human urine samples using radiometric techniques normally requires preconcentration and purification of the radionuclides prior to measure-ments.9 As a result, these procedures are very time consuming, and this
represents a significant impediment in emergency situations. Moreover, the preconcentration and chemical separation processes could add vary-ing amounts of U owvary-ing to the presence of naturally occurrvary-ing U in the reagents. However, this contribution could be minimized by sub-boiling distillation of the acids used during the preparation of the samples (which is a common practice in mass spectrometry (MS) analysis).
MS techniques10 such as inductively coupled plasma mass
spec-trometry (ICP-MS), thermal ionization mass specspec-trometry (TIMS), and accelerator mass spectrometry (AMS) are applied to obtain accurate and precise isotopic information of actinides in several matrices. Although both TIMS and AMS provide low limit of detection (LOD), sample preparation is very time consuming compared with that for ICP-MS. The drawback of the AMS technique is that it requires higher operation and maintenance costs than ICP-MS. The ICP-MS technology has been developing for more than 30 years by building and augmenting instru-mentation, such as nebulizers,11 detectors,12 coupling with separation
techniques and laser ablation,13,14 and electronic devices15 and sample
introduction systems,11 and has been extensively used in a wide variety
of applications. More interesting information about the fundamentals, instrumentation, and applications of ICP-MS can also be found in a recent critical review reported by Jakubowski et al.16,17
can be shortly summarized as follows15: a) 90% of the elements can
be measured, b) around 50 elements are detectable in concentrations as low as 1.0 × 10⁻³ µg/L, c) isotopic ratios can be determined, d) it
offers high performance for routine analysis, and e) possesses a large dynamic range. However, polyatomic interferences and isotopic ratio uncertainty are the main drawbacks of this technique. The application of ICP-SFMS with a single ion collector has been demonstrated as a useful alternative for solving some of the problems involving poly-atomic interferences during measurements, and as a powerful tool for the analysis of actinides in biological samples at ultra-trace concentra-tions.18 The main characteristics of this technique are its extremely
high sensitivity, precision and accuracy, and an extended dynamic range up to ~1012.15 However, multiple ion collector instruments are
often better suited than ICP-SFMS for isotopic ratio determination because the isotope measurements are simultaneously performed, minimizing the influence of the counting dead time and increasing the precision and accuracy for the analysis of isotopic ratios.19 Therefore,
the application of ICP-MS techniques would provide significant support to dosimetry laboratories, which use radiometric techniques based on alpha spectrometry (AS) for the routine analysis of actinides in urine with the aim of providing comprehensive information to estimate dosages incorporated into the human body. 20,21
This study aims to validate a method for the determination of the U concentration in human urine samples by ICP-SFMS. The method employed was based on urine dilution followed by direct analysis and was validated by the participation with PROCORAD (the Association for the Promotion of Quality Control in Radiotoxicological Analysis) through the intercomparison exercise conducted in 2010. In addition, second analysis of samples was also carried out with ICP-QMS, and the results obtained in analysis of U were compared with those of ICP-SFMS.
EXPERIMENTAL
Instrumentation
Two different mass spectrometers were employed for measuring of U isotopes: an ICP-QMS (X-Series 2, Thermo Scientific, Bremen, Germany) and an ICP-SFMS (Element XR, Thermo Scientific, Bremen Germany). A Meinhard nebulizer with a Scott (Ryton) spray chamber (Elemental Scientific Inc., USA) was used for ICP-QMS, whereas a microflow nebulizer PFA-100 coupled to a Twister with a Helix 50 mL cyclonic borosilicate glass spray chamber (Elemental Scientific Inc., USA) was employed for ICP-SFMS. The torch of the ICP-SFMS instru-ment (Eleinstru-mental Scientific Inc., USA) was shielded with a grounded platinum electrode (GuardElectrodeTM, Thermo Scientific).
Materials and reagents
Two certified solutions of 235U (IRMM-050) and 238U
(IRMM-053) were supplied by the Institute for Reference Materials and Measurements (GEEL, Belgium). The standards were diluted with 5 mol/LofHNO3 to obtain stock solutions with a concentration of
1.182 × 10⁻⁴ µg/L of 235U and 1.175 × 10⁻⁴ µg/L of 238U. An aliquot
of 10 µg/L of a Lu external standard solution (Merck, Germany) was used during the measurements for monitoring the instrumental stability. Instrumental mass calibration of ICP-SFMS was performed using a certified multi-element solution XXIII (Ba, B, Co, Fe, Ga, In, K, Li, Lu, Na, Rh, Sc, Y, Tl, and U) from Merck (Germany). This solution had a concentration of 1.1 ± 0.2 µg/L of natural U. The mass calibration of ICP-QMS was carried out with a certified multi-element solution Tune A (As, Ba, Be, Bi, Ce, Co, In, Li, Ni, Pb, and U) supplied by Analytika Ltd. (Czech Republic). This
solution has a concentration of 10.0 ± 2.0 µg/L of natural U. Indium was used as an internal standard in both cases (ICP-SFMS: 1.0 ± 0.2 µg/L and ICP-QMS: 10.5 ± 2.0 µg/L). The remaining salts and solutions were prepared using analytical grade reagents from Merck (Germany). High purity water (> 18 MΩ/cm) was obtained from a Milli-Q Element A10 Century (Millipore Ibérica, Spain). Nitric acid was purified by distillation in a Milestone Duopur (Milestone s.r.l., Italy) sub-boiling system. Certified Ar gas (99.999%) was supplied by Air Liquide España. The U measurements were carried out in a clean room laboratory (ISO 6 class) at 24 ± 1 °C.
Sample preparation
Three 0.5 L human urine samples were received from PROCORAD. Two of them of unknown U concentrations (Sample A having a high concentration and sample B having a low concentration) and one unspiked sample for background measurements (sample C) were used. Sample aliquots were diluted with 5% v/v HNO3 (dilution
factor of 1:20; 10 replicates). The external calibration method was employed for U quantification (Figure 1). Calibration curves were prepared by addition of known quantities of 235U and 238U to sample C. RESULTS AND DISCUSSIONS
In Spain, the Research Center of Environment and Energy and Technology (CIEMAT) is responsible for monitoring people who are professionally exposed to ionizing radiation and for monitoring environmental radiation levels. CIEMAT’s laboratories undergo continued accreditation and certification. The accreditation of bio-assay analyses of actinides notably requires intercomparison tests between laboratories. PROCORAD is one of the most important providers in this field. The organization provides an opportunity to compare and contrast radiochemistry methods and metrology for the in vitro analysis of urine and feces. This focus, the development of new techniques such as ICP-MS, AS, and laser spectrofluorimetry, have been important for development of protocols of standardiza-tion and have made it possible to compare the effectiveness of these protocols with respect to radiation protection monitoring, both in routine and special situations. In intercomparison, the participants receive two urine samples spiked with unknown contents of U and one unspiked sample as a blank. The nature of the intercomparison process therefore affects the reporting process such that the LOD, flexibility, repeatability, reproducibility, and isotopic quantification are considered to be the main criteria.
Optimization of parameters for the measurement of U isotopes
The optimized instrumental conditions are summarized in Table 1. In the case of ICP-SFMS, the optimization for U isotopes was attained by tuning the instrument with the certified multi-element solution XXIII (235U = (10.2 ± 0.2) × 103 cps; 238U = (1.38 ± 0.03)
× 106 cps), with a U oxide content in the plasma less than 5%. The
ICP-QMS instrument was tuned with the Tune A solution giving a
238U peak at around (8.0 ± 0.2) × 104 cps.
LOD
Figure 1 shows the calibration curves for 235U and 238U in urine
samples. In the case of ICP-SFMS, a reasonably good linearity was obtained in the range from 1.0 × 10⁻⁶ µg/L to 2.5 × 10⁻² µg/L (235U)
and 5.0 × 10⁻⁶ µg/L to 4 µg/L (238U). For ICP-QMS, the calibration
curve for 238U also shows very good linearity in the range from
were calculated on the basis of the 3σ value of blank measurements (for n = 10) from Equation 1:
LOD = 3 × σB × DF × V, (1)
where the dilution factor (DF) was 1:20 and the total volume of the urine samples (V) was 500 mL.
Validation of the method
The method proposed with ICP-SFMS has been validated by performing blind analyses of standardized urine samples during
an international intercomparison exercise (PROCORAD 2010). The results of the reference materials are plotted in Figure 2. The experimental results indicate that the procedure performed can be applied to both ICP-MS instruments, although those obtained with ICP-SFMS showed greater accuracy and precision in the measured U values. Therefore, the results accorded better with the reference values in comparison with those provided by ICP-QMS. The re-sults of the quantification of the 238U concentration in human urine
samples conducted for the PROCORAD intercomparison of 2010 are summarized in Table 3. The results obtained in the analysis of
238U by ICP-QMS were not particularly accurate owing to the effect
of the sample matrix. Moreover, the 235U concentration could not be
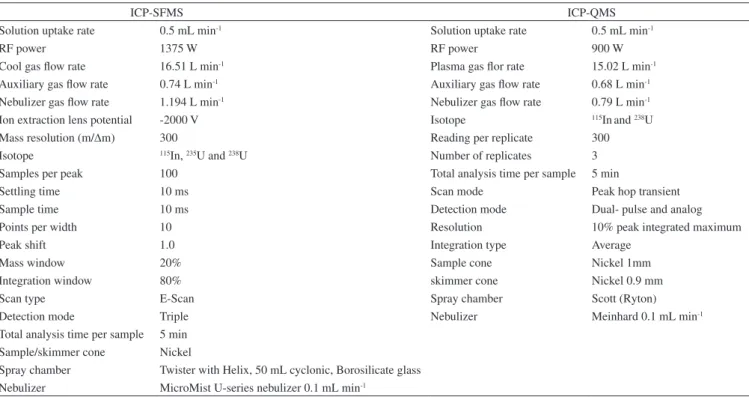
Table 1. ICP-SFMS and ICP-QMS optimized instrumental conditions for the measurement of U isotopes
ICP-SFMS ICP-QMS Solution uptake rate 0.5 mL min-1 Solution uptake rate 0.5 mL min-1
RF power 1375 W RF power 900 W
Cool gas flow rate 16.51 L min-1 Plasma gas flor rate 15.02 L min-1 Auxiliary gas flow rate 0.74 L min-1 Auxiliary gas flow rate 0.68 L min-1 Nebulizer gas flow rate 1.194 L min-1 Nebulizer gas flow rate 0.79 L min-1 Ion extraction lens potential -2000 V Isotope 115Inand 238U
Mass resolution (m/∆m) 300 Reading per replicate 300
Isotope 115In, 235U and 238U Number of replicates 3 Samples per peak 100 Total analysis time per sample 5 min
Settling time 10 ms Scan mode Peak hop transient
Sample time 10 ms Detection mode Dual- pulse and analog
Points per width 10 Resolution 10% peak integrated maximum
Peak shift 1.0 Integration type Average
Mass window 20% Sample cone Nickel 1mm
Integration window 80% skimmer cone Nickel 0.9 mm
Scan type E-Scan Spray chamber Scott (Ryton)
Detection mode Triple Nebulizer Meinhard 0.1 mL min-1
Total analysis time per sample 5 min Sample/skimmer cone Nickel
Spray chamber Twister with Helix, 50 mL cyclonic, Borosilicate glass Nebulizer MicroMist U-series nebulizer 0.1 mL min-1
Table 2. LOD of U in human urine samples by ICP-SFMS and ICP-QMS
ICP-SFMS ICP-QMS
235U µg L-1 238U µg L-1 238U µg L-1 0.049×10⁻³ 7.37×10⁻³ 1.02×10⁻²
Table 3. Summary of results for 238U in human urine samples during the PROCORAD 2010 exercise
Sample ICP-SFMS U/sample (µg)
ICP-QMS U/sample (µg)
Target value U/sample (µg) A 17.7±0.8 19.4±0.4 16.8±0.5 B 1.63±0.06 1.54±0.04 1.67±0.05
Figure 2. Analytical results for 238U measurements with SFMS and ICP--QMS normalized to the total volume of urine (0.5 L). a) Sample A; b) Sample B. The dotted line in the graphs indicates the target value, and the shaded area corresponds to the associated uncertainty
determined by ICP-QMS because of the low levels of 235U contained
within the samples. On the other hand, ICP-SFMS was also used to measure the 235U content in both urine samples by using the external
calibration method, and the results were Sample A = (5.43 ± 0.22) × 10−2 µg of 235U and Sample B = (4.59 ± 0.58) × 10−3 µg of 235U.
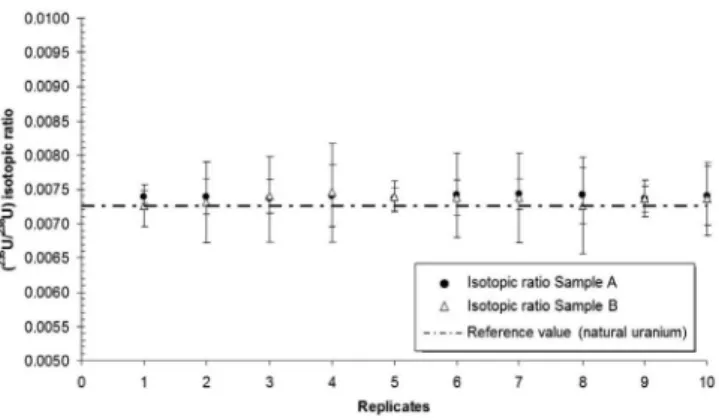
Finally, this study illustrated the capacity of SF-ICP-MS for the de-termination of isotopic ratios of U in urine samples (A and B). The results obtained for the (235U/238U) isotopic ratios of the PROCORAD
urine samples are given in Figure 3. Furthermore, the analysis of isotopic ratios of U for Samples A and B has not showed significant differences, and the results verified that the urine samples contained U levels isotopically consistent with the composition of natural U.
CONCLUSIONS
The results obtained by ICP-SFMS for the U concentration were reasonably in accordance with the target values of U provided by the PROCORAD 2010 urine samples, although the results obtained using ICP-QMS do not conform. Moreover, ICP-SFMS allows the quantification of isotopic ratios (and mass) of other minority isotopes contained in the sample. This study shows the utility of MS in the in vitro determination of long-lived radionuclides, both in routine or
Figure 3. Results of isotopic ratio in the PROCORAD 2010 human urine samples measured by ICP-SFMS. A comparison with the natural isotopic ratio is also given in the figure
ACKNOWLEDGEMENTS
H. Hernández-Mendoza thanks Centro de Investigaciones Energéticas, Medioambientales y Tecnológicas (CIEMAT) for the FPI predoctoral fellowship. This work was supported by Projects CIEMAT 2007/P1423.
REFERENCES
1. Roth, P.; Höllriegl, V.; Werner, E.; Schramel, P.; Radiat. Prot. Dosim. 2003, 105, 157.
2. The Royal Society; The health hazards of depleted uranium munitions Part I. The Royal Society: London, 2001, p. 5-8.
3. Agency for Toxic Substances and Disease Registry (ATSDR); Toxicological profile for uranium. ATSDR, Atlanta Georgia, 2011, p. 14-25.
4. World Health Organization (WHO); Depleted Uranium, Sources, Exposure and Health Effects. WHO, Geneva, 2001, p. 1-3.
5. Bleise, A.; Danesi, P. R.; Burkar, W.; J. Environ. Radioact. 2003, 64, 93. 6. United Nations Scientific Committee on the Effects of Atomic Radiation (UNSCEAR); Sources and Effects of Ionizing Radiation, ANNEX B Exposures from natural radiation sources. United Nations, New York, 2000, p. 84-113.
7. Dang, H. S.; Pullat. V. R.; Pillai, K. C.; Health Phys. 1992, 62, 562. 8. Xiongxin. D.; Kramer-Tremblay, S.; Health Phys. 2011, 101, 144. 9. Xiongxin. D.; J. Radioanal. Nucl. Chem. 2011, 289, 595. 10. Hou. D.; Ross. P.; Anal. Chim. Acta. 2008, 608, 105.
11. Larivière. D.; Taylor. V. F.; Evans. R. D.; Cornett. R. J.; Spectrochim. Acta, Part B. 2006, 61, 877.
12. Becker. J. S.; Spectrochim. Acta, Part B. 2003, 58, 1757.
13. Perna. L.; Doctoral Thesis, Universitat Politècnica de Catalunya. Departament d’Enginyeria Química, 2003.
14. Zoriy. M.; Doctoral Thesis, Berichte des Forschungszentrums Jülich, 2005.
15. Becker, J. S.; Inorganic Mass Spectrometry: Principles and Applications, John Wiley & Sons Ltd: Chichester, 2008, chap. 3. 16. Jakubowski, N.; Prohaska, T.; Rottmann. L.; Vanhaecke. F.; J. Anal. At.
Spectrom. 2011, 26, 693
17. Jakubowski, N,; Prohaska. T.; Vanhaecke. F.; Roos. P. H.; Lindemann, T.; J. Anal. At. Spectrom. 2011, 26,727
18. Hernández-Mendoza. H.; Doctoral Thesis, Univesidad Complutense de Madrid, 2011.
19. Becker. J. S.; J. Anal. At. Spectrom. 2005, 20, 1173.
20. Parrish. R. R.; Thirlwall. M.; Pickford, C.; Horstwood, M. S. A.; Gerdes. A.; Anderson, J.; Coggon, D.; Health Phys. 2006, 90, 127.