STRUCTURAL DEFORMATIONS ANALYSIS BY MEANS OF
KALMAN-FILTERING
Analise da deformação estrutural com filtros de Kalman
ENGIN GULAL Yildiz Technical University Faculty of Civil Engineering Department of Geomatic Engineering Davutpasa Campus, 34220 - Esenler- Istanbul, Turkey
engingulal@gmail.com
ABSTRACT
The surveillance of engineering structures like dams is an interdisciplinary task and mainly focused on the assessment of stability and reliability of the objects to be monitored. To show the co-operation of the disciplines involved in a comprehensible manner, it is suitable to use system analysis approaches. Structural deformations analysis by means of system analysis is explained in the following with an example of a dam. The determination of the dam deformations is demonstrated by an integration of computed and measured data by using Kalman Filtering.
Keywords: Dam; Deformation; Geodetic Monitoring; Kalman Filtering.
RESUMO
O monitoramento e controle de estruturas de engenharia como barragens, é uma tarefa multidisciplinar e focada principalmente na avaliação da estabilidade e confiabilidade do objeto a ser monitorado. Para mostrar a colaboração das disciplinas envolvidas de maneira compreensível, é conveniente usar a naálise de sistemas aproximados. A análise da deformação de estruturas através da análise de sistemas é explanada com um exemplo de barragem como a seguir. A determinação da deformação da barragem é mostrada pela integração de cálculos e de dados medidos usando Filtros de Kalman.
1 o F t i d s C C T b c p i a s c g ( n s l r 1. INTRODU Over the of new meth Federation of the areas of in integrated ana developing ne structures ( CHRZANOW Committee on The work of t by FIG as a pu Stability constructional purpose of any injury to the appropriately structure, geo concept. Here geometrical c (external and not limited to structure dam lifetime and replacement d
Figure 1 - Inte
UCTION
e past 20 year hods for the
Surveyors (F ntegrated geom
alysis. The ac ew methods, w (CHRZANOW WSKI and WH n Terminology
the committee ublication No y and operatio
l safety, surv y surveillance e safe operat and in time. I detic monitor ein, the measur changes but a internal loads aspects of no mage assessme
utilization ev decisions etc.
erdisciplinary Font: (
rs there has be analyses of IG) has been metrical analy ctivity of FIG which could b WSKI et HITAKER 20 y and Classifi e was comple . 25 (WELSC onal safety of veillance and e is the earlies
tion of a co In framework ring measurem
rements are n also to the de
s). The activi rmative and b ent; intensified
valuation; ma
y approach of (WELSCH an
een significan deformation leading in the ysis of structur G Working Gr be applied to m
al., 2003, 008). In 19 ication of Def eted in 2001 a CH and HEUN f a structure emergency c st possible dete onstruction in ks of the stabil ments must be ot only restric etermination o
ty and emerg budgetary con d surveillance aintenance an
stability and o nd HEUNECK
nt progress in measuremen e developmen ral deformatio roup 6.1 has monitoring an CHRZANO 992, an FIG
formation Mo and the result NECKE, 2001)
consist of th concept, (Figu
ection of dam n order to b lity and opera e seen as a par cted to the det
of the causal gency concept straints; integ e and diagnos nd repair, ou
operational saf KE, 2001). System (Kalm Geodetic Methods the developm nts. Internatio ts, particularly ons and combi
been focused nd analysis of OWSKI 20 WG 6.1 ad dels was crea s were publis ).
hree compone ure 1). Aim mage, failure or
be able to re ational safety o rt of surveilla ermination of input quanti ts include but rity, material stic technolog ut-of-service
fety of structu
Determination of stability and operational safety of a structure require interdisciplinary approach depending on the developments of measurement and analysis techniques. .
Engineering geodesy deals with planning, setting out, recording and the monitoring of structures and other objects. The task of geodetic monitoring measurements generally exists of determination of deviations from expected changes on selected object points. Widespread measurement techniques are terrestrial measurements, leveling and Global Navigation and Satellite System (GNSS) and other structural measurement techniques (inclinometers, pendulum etc.).
Structural mechanics is the computation of deformations, deflections and internal forces or stresses within structures, either for design or for performance evaluation of existing structures. The Finite element method (FEM) is a powerful technique originally developed for numerical solution of complex problems in structural mechanics, and it remains the method of choice for complex systems. As an aspect of systems theory is a method for understanding the dynamic behavior of complex systems. In system theory, the set-up of an appropriate mathematical-physical representation of the transfer function of a dynamic system is called system identification.
Setting up a model for the transfer function is important for the choice of a parametric or a non-parametric identification, (HEUNECKE and WELSCH 2000). A suitable tool for parametric identification is provided by the application of Kalman-filtering. Until now, Kalman-filtering was successfully used in civil engineering in combination with FE-models. Heunecke 1996 was determined the diurnal variation due to solarization of a suspension bridge pylon, Hesse 2002 analyzed a shell structure under varying loads, Eichhorn 2006 calculated the thermal deformations of bar-shaped machine elements and Teskey 1988 and Gulal 1997 used this technique for dam monitoring.
Figure 1 likes to show that there is an intersection of interdisciplinary approaches between system theory, engineering geodesy and mechanics for the stability and operational safety of structures. This intersection is explained and demonstrated in this paper with the analysis of the dam.
2. METHOD
Kalman 1960 published his famous paper describing a recursive solution to the discrete-data linear filtering problem. Since that time, due in large part to advances in digital computing; the Kalman filter has been the subject of extensive research and application. Kalman filter is used for the optimal estimation of the state of complex systems.
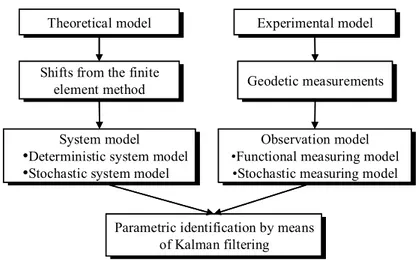
geodetic measuring techniques and process methods. Identification by means of Kalman filtering provides optimal estimation of both geometrical state and material parameters of the object.
Figure 2 - Identification by means of Kalman filtering.
The finite element method, briefly as FEM designation, is an effective numeric procedure for the computation of complex constructions in civil engineering. Basic idea of FEM applications in structural mechanics problems is analyzing the structure by dividing it into geometrical small elements. After the definition of the structure, ΔX shifts on knots can be obtained dependent on the rigidity matrix K and the affected forces Δf.
Δf K
ΔX= −1 (1) This relationship is called strength shift relation. This quantity can be derived from the coordinate changes between two different states (k+1/k) which are obtained by geodetic methods.
ΔX x x
Δxk+1,k=ˆk+1−ˆk= (2)
If one releases the correcting variables uk in the force vector F, filter adapted
notation can be indicated in that to the Kalman filter.
k k 1, k k k 1, k 1 1
k 1,
k K Δf (K F) u B u
Δx+ = − = − + = + (3) Shifts from the finite
element method Shifts from the finite
element method Geodetic measurementsGeodetic measurements
System model
•Deterministic system model •Stochastic system model
System model
•Deterministic system model •Stochastic system model
Observation model •Functional measuring model •Stochastic measuring model
Observation model •Functional measuring model
•Stochastic measuring model
Parametric identification by means of Kalman filtering Parametric identification by means
of Kalman filtering Theoretical model
Theoretical model Experimental modelExperimental model
Shifts from the finite element method Shifts from the finite
element method Geodetic measurementsGeodetic measurements
System model
•Deterministic system model •Stochastic system model
System model
•Deterministic system model •Stochastic system model
Observation model •Functional measuring model •Stochastic measuring model
Observation model •Functional measuring model
•Stochastic measuring model
Parametric identification by means of Kalman filtering Parametric identification by means
of Kalman filtering Theoretical model
The current object state can be computed for the static load case under a load on time k+1 by means of the shift vector ΔX.
k k 1, k k k 1, k k k 1, k 1
k T x B u C w
x + = + + + + + (4)
State vector of dam which is supplemented with the material parameter can be obtained with consideration of water pressure is uw and change of temperature uT.
Material parameters are young module E, the transverse contraction ratio μ and the thermal expansion coefficients α for an example application on dam, (GULAL 1997). ⎥ ⎥ ⎥ ⎦ ⎤ ⎢ ⎢ ⎢ ⎣ ⎡ ⎥ ⎥ ⎥ ⎦ ⎤ ⎢ ⎢ ⎢ ⎣ ⎡ + ⎥ ⎦ ⎤ ⎢ ⎣ ⎡ ⎥ ⎥ ⎥ ⎦ ⎤ ⎢ ⎢ ⎢ ⎣ ⎡ + ⎥ ⎥ ⎥ ⎦ ⎤ ⎢ ⎢ ⎢ ⎣ ⎡ ⎥ ⎥ ⎥ ⎦ ⎤ ⎢ ⎢ ⎢ ⎣ ⎡ = ⎥ ⎥ ⎥ ⎦ ⎤ ⎢ ⎢ ⎢ ⎣ ⎡ + + = + + + + + + + + + k M, k O, k R, M M O, O R k T, k W, k 1, k T, k 1, k W, k M, k O, k R, M M O, O R 1 k M, 1 k O, 1 k R, k k 1, k k k 1, k k k 1, k 1 k w w w I 0 0 T I 0 0 0 I u u 0 0 B B 0 0 x x x I 0 0 T I 0 0 0 I x x x w C u B x T x ˆ ˆ ˆ ˆ (5)
The sub vectors xR, and xO, contain the information about the coordinates of
the reference and object points and the sub vector xM represents the material
parameters, which are used in the model. The transition matrix Tk+1,k is the
derivative of the predicted shifts toward the material parameters at the time tk.
M M k 1, k M, O, x Δ dyn Δ x dyn
T ψ = ψ
∂ ∂ =
+ (6)
Bk+1,k is the derivative of the predicted shifts toward the correcting variables of
the filter process.
k k k 1, k u Δ dyn Δ u dyn
B ψ = ψ
∂ ∂ =
+ (7)
The product Ck+1,k wk remains here unconsidered, because the expectation
value is E{wk}=0. The application of the covariance propagation law supplies the
cofactor matrix of the predicted state vector.
T k 1, k k ww, k 1, k T k 1, k k uu, k 1, k T k 1, k k , x x k 1, k 1 k , x
x T Q T B Q B C Q C
Q + = + ˆˆ + + + + + + + (8)
[
]
⎥ ⎥ ⎥ ⎦ ⎤ ⎢ ⎢ ⎢ ⎣ ⎡ = + = + + + + + + + + + + + + 1 k M, 1 k O, 1 k R, 1 k O, 1 k R, 1 k 1 k 1 k 1 k x, 1 k 1 k x x x 0 A A v l x A v l ˆ ˆ ˆ ˆ (9)Accuracy conditions of the observations are expressed by the stochastic model.
{ }
ll,k12 0 T 1 k
ll, + =E = Q +
∑
εε σ (10)Unification of system equation (5) and observation equation (9) is performed in the Gauss-Markov model.
1 k 1 k x 1 k l x 1 k xˆ A I v v l x xˆ A v l + + + + ⎥⎦ ⎤ ⎢ ⎣ ⎡ = ⎥ ⎦ ⎤ ⎢ ⎣ ⎡ + ⎥ ⎦ ⎤ ⎢ ⎣ ⎡ = + , 1 k ll x x 2 0 1 k Q O O Q + + ⎥ ⎦ ⎤ ⎢ ⎣ ⎡ =
∑
σ (11)The unification of system equation and observation equation constitutes the nature of the Kalman filtering, whose results the filtered state vector xˆk+1 with its
covariance matrix Σxˆxˆk+1is.
Using the gain-matrix Kk+1 (Eq.12) that minimizes the a posterior error
covariance the output quantities of main interest can be comprehended by a vector Y for time tk+1 Eq.(13).
1 1 k T 1 k 1 k , x x 1 T 1 k 1 k , x x 1 k 1 k , ll T 1 k 1 k , x x 1
k Q A (Q A Q A ) Q A D
K + = + + + + + + + − = + + −+ (12)
1 k 1 k 1 ll 1 ll 1 k l x l x D Q A D Q K A K K A K I I A v v xˆ d Y + + − − + ⎥ ⎦ ⎤ ⎢ ⎣ ⎡ ⎥ ⎥ ⎥ ⎥ ⎦ ⎤ ⎢ ⎢ ⎢ ⎢ ⎣ ⎡ − − −− = ⎥ ⎥ ⎥ ⎥ ⎦ ⎤ ⎢ ⎢ ⎢ ⎢ ⎣ ⎡
= (13)
The difference dk+1 in Eq. 13 is called the innovation. The innovation reflects
3. MATERIAL
3.1 Presentation of Oymapinar Dam
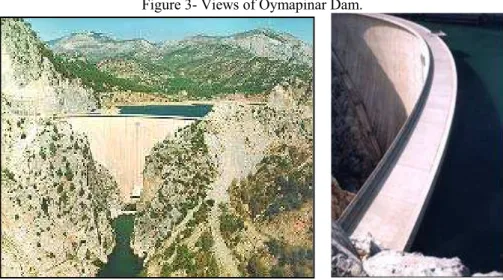
The hydroelectric plant Oymapinar is located on Turkey’s southern coast near the provincial capital of Antalya at the southern edge of the Taurus Mountains, approximately 18km inland from Mediterranean.
The construction site was opened in May 1977 and the work on the concrete dam in February 1983 was locked. Planning and consultation was undertaken by the consulting firms Coyne and Bellier of Paris-France. The execution of all construction work was in the hands of Bilfinger and Berger Company Wiesbaden-Germany.
The main body of Oymapinar Dam consists of 24 vertical concrete blocks, each of them is 15.2 m long. The concrete dam is 185m high, 25m wide at base, 5m wide at the crest and has a total crest length of 365m. The double curved arch dam transfers the water pressure as a three dimensional structure on the rock abutments which rise up from the valley at an incline of 600. The volume of concrete in the dam itself is 650.000m3. Altogether the project contains 900.000m3 of concrete.
Figure 3- Views of Oymapinar Dam.
3.2 Monitoring of Oymapinar Dam
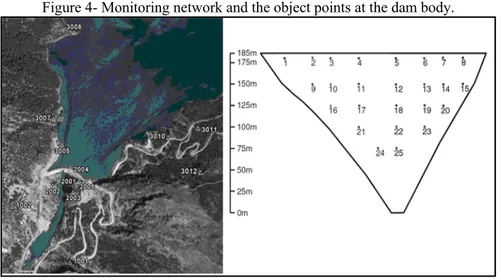
dam and 25 targets (object points) on the surface of the dam (Figure 4). Due to problems of limited sight only 22 targets are suitable for intersection observations.
Figure 4- Monitoring network and the object points at the dam body.
The task of the net is to supply statistically secured statements about the deformation behavior of the concrete dam. The deformation of the concrete dam can be determined by measuring the object points geodetically, which present the dam.
During lake filling (February 1983 to July 1984) the construction company (Bilfinger&Berger) was responsible for the monitoring and the network was observed 24 periods as the reservoir water level rose. When the operational phase began in 1984, Yildiz Technical University, Istanbul took charge of the observations. From 1984 till 2010 20 epochs were undertaken. In 1994 and 1996 observations were made by Yildiz Technical University in corporation with the University of Darmstadt and the University of Hannover, Germany (HOSBAS et al.1994, GRABOWSKI et al. 1997).
For the numerical application, two special cases were selected as representative epochs, in which the water levels are 176m and 184m in February 1984 and March 1984 respectively and the significant deformations are expected. The geodetic measurements in these epochs were conducted by Bilfinger Berger Co. by using Wild T2 theodolite.
4. RESULTS
4.1 The static behavior of Oymapinar Dam
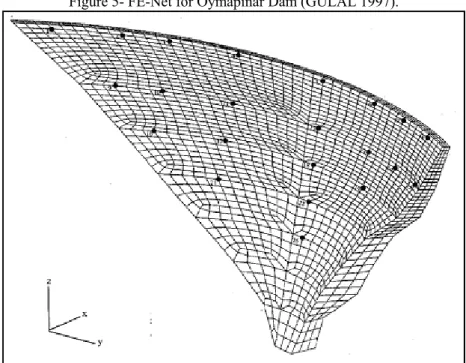
Dam was carried out by using the FE-Net represented in Figure 5 and the program system PATRAN (PATRAN 2012). The FE-Net was divided into 4221 volume elements with 5888 knots.
Figure 5- FE-Net for Oymapinar Dam (GULAL 1997).
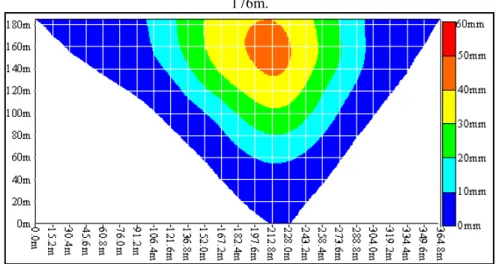
Figure 6- The horizontal shifts computed using FEM for the load case water level of 176m.
Figure 7- The horizontal shifts computed using FEM for the water level of 184m.
4.2 Identification of dam body by means of Kalman filtering
Current state of the system is predicted by using Eq. 5 after the deformations on the dam body are calculated. In the xk+1 predicted state vector; xR defines the
observation points coordinated around the dam, xO defines the 22 object points
coordinates on the dam body and xM defines the material parameters such as young
module, the transverse contraction ratio and the thermal expansion number. TO,M
the material parameters on the system state, was calculated for only object points on dam body. Bk+1,k matrix (Eq. 7) defines the effects of the water load and temperature
on the system state xk+1. Young module, the transverse contraction ratio and the
thermal expansion number was accepted as 20.000MN/m2, 0.2 and 8.10-6 1/°C respectively (COYNE et BELLIER, 1970) and system state was predicted for the time point on February 1984 when the water level uw is 176m. Observation equation
which is the second component of the filtering process was determined by processing the geodetic observations on February 1984 and by using Eq. 9. The system equation and the measuring equation were summarized in Gauss-Markov model (Eq. 11). After the filtering of the deformation behavior (Eq. 13) current state of the concrete dam (both geometrical condition and material parameter) was determined.
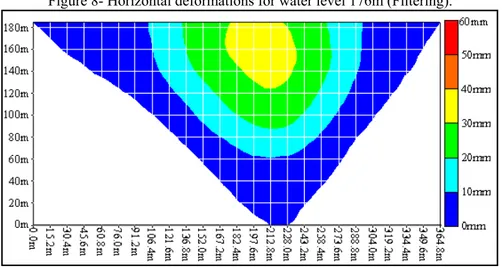
Deformation values determined for dam body after the filtering process is given in Figure 8. Deformations take the biggest values (31mm) on the middle axis of the dam and on the upper quarter of the dam.
Figure 8- Horizontal deformations for water level 176m (Filtering).
After the filtering process, young module was increased 3.252 MN/m2 and has 23251 MN/m2 value, the transverse contraction ratio was decreased 0.01 and has 0.19 value. There is no significant change on thermal expansion number. Second filtering process was executed for the March 1984 (k+1) period when the water level is 184m by accepting the February 1984 period as reference. After the filtering process, the behavior of Oymapinar concrete dam was represented in Figure 9 with a 184m water level.
d s
w i 3 y T d s e
deformations smaller.
Figur
After the wall in the fo illustrated wit
As is to 3.550MN/m2 year for instan The transvers decreased 0.0 smaller tempe expansion num
Figure
10-with increasi
re 9- Horizont
e diagram of ollowing figur th the time. o be seen in F
due to the co nce according se contraction 01 at the end erature differ mber does not
- Changes of y
ing distance f
tal deformatio
the deformat re the change
Figure 10, th omputations a g to amount to n ratio was n of the one y rence in Med t change signi
young module
from the wall
ons for water l
tions arising a es arising wit
he young mod accomplished o the value of not changed a year and takes diterranean du
ficantly.
e (E) and trans
centre and th
evel 184m (Fi
at the downst th the materia
dule increased here after ap for instance E after the seco s 0.19 values uring the epo
sverse contrac
he crest beco
iltering).
tream face of al parameters
d and conver pproximately E=23.550MN/ ond filtering . Because of ochs, the ther
ction ratio (μ). ome
the are
rged one /m2. and the mal
5. DISCUSSION
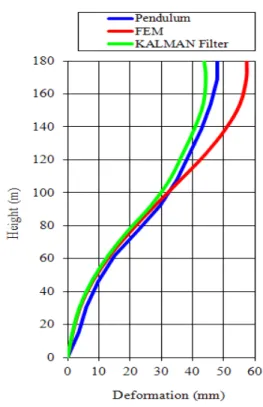
Figure 11 illustrates the deformation on the middle axis of the dam when the reservoir is full and the water level is 184m. Kalman filtering results and pendulum measurement results using FEM is given in figure. Results from the every three methods on the lower 2/3 section (120m) of the dam are well-matched with each other. Standard deviation of the three values is 2mm. This value is also the standard deviation of the deformations resulting from the filtering process.
Figure 11 – Deformation the middle axis of dam.
After the filtering process Young module Oymapinar dam is increased 3.550MN/m2 after 14 mount and is reached 23.550MN/m2. It can be said that Young Module is increased as 18% yearly by increasing 250MN/m2 monthly. Depending on the increase on the Young Module, displacement values resulting from FEM computations on the dam crest are decreased 7mm. It can be said that the FEM results and the filtering results are well-matched each other. In Simmler 1984 was stated that on the Spullersee, Weissee and Tauernmoos dams in Europe, young module was increased as 40% and 60% during 12 years depending on quality experiments. On the Kölnbrein dam in Austria which has similar characteristics with Oymapinar dam, young module was determined as 18000-23000MN/m2 during the planning process. In Herzog 1988, after the experiments and calculations this young module was determined as 28000MN/m2. This condition is similar with the conditions for Oymapinar dam.
Poison number was decreased 5% one year later from the construction was completed. This means that, with the demand of the building a proportional deformation in load direction develops and perpendicularly to the load direction. It offers itself therefore to take the transverse contraction ratio out of the filter process to reduce the model and the counting expenditure for to avoid. The transverse contraction ratio is to be regarded more than one auxiliary variable for the computation of the shifts in the FEM.
Because of the little temperature changes between the periods, thermal expansion number has no significant changes like transverse contraction ratio. From this consideration the thermal expansion number, with small temperature differences between air and waterside, can remain unconsidered during the filter process.
6. CONCLUSIONS
Already in the year 1920 probably first times in the world in Switzerland geodetic deformation measurements at dams were accomplished. With the development of the electronic data processing, the geodetic measuring procedures and the analysis procedures change in particular.
The presented procedures make a comprehensive analysis and interpretation possible of deformation processes. The adaptive Kalman filter in dynamic models presents itself as extensive complex subsection in the deformation analysis. The large advantage of the filter process is apart from the computation of the geometrical partition the examination and adjustment of the material parameters to the actual object behavior.
REFERENCES
CHRZANOWSKI A.; DING X.; ROBERTS G.; WHITAKER C. Goal and Achievements of FIG Working Group WG6.1 Deformation Measurements and Analysis. 11th FIG Symposium on Deformation Measurement, May 25-28 2003, Santorini, Greece.
CHRZANOWSKI A. Task and Achievements of FIG Working Group on Deformation Measurements and Analysis, 12th FIG Symposium, May 22-24 2006, Baden.
CHRZANOWSKI A.; WHITAKER C. Activity of the FIG Working Group 6.1 on Deformation Measurements-Progress Report 2006-2008, 13th FIG Symposium on Deformation Measurementand Analysis, May 12-15 2008, Lisbon.
COYNE ET BELLIER, Oymapinar Dam and Hydroelectric Project, Dam Analysis Report, Paris, 1970.
EICHHORN A. Analysis of Dynamic Deformation Processes with Adaptive Kalman-Filtering, 3rd IAG / 12th FIG Symposium, May 22-24 2006, Baden. GRABOWSKI J.; GULAL E.; HEER R.; HEUNECKE O.; PELZER H.; UZEL T.
Deformation surveys at the Oymapinar Dam - A Review on Some Results, Second Turkish-German Joint Geodetic Days, 28-30 May 1997, Berlin. GULAL E. Geodaetische Uberwachung einer Talsperre; eine Anwendung der
Kalman Filtertechnik, Dissertationen, Wissenschaftliche Arbeiten der Fachrichtung Vermessungswesen der Universitaet Hannover, 1997.
HESSE C. Deformation analysis of a shell structure under varying loads with Kalman-filter techniques, 2nd Symp. for Geotech. and Structural Engineering, May 21-24 2002 Berlin.
HERZOG M. Die Baugrundverformung bei Gewölbestaumauern, Bautechnik, Heft 65,1988.
HEUNECKE O. Zur Identifikation und Verifikation von Deformationsprozessen mittels adaptiver Kalman-Filterung (Hannoversches Filter). Wissenschaftliche Arbeiten der Fachrichtung Vermessungswesen der Universitaet Hannover, No. 208, 1995.
HEUNECKE O. Einige Gedanken zur fachübergreifenden Untersuchung von Deformationsvorgängen, dargestellt am Beispiel der Filterung der Biegelinie eines Pylons, Wissenschaftliche Arbeiten der Fachrichtung Vermessungswesen der Universitaet Hannover, pp. 75-92, 1996.
HEUNECKE O. WELSCH W. A Contribution to Terminology and Classification of Deformation Models in Engineering Surveys, Journal of Geospatial Engineering, vol.2. No.1, pp.35-44, 2000,Hong Kong.
KALMAN R. E. A New Approach to Linear Filtering and Prediction Problems, Journal of Basic Engineering, ASME , pp. 35-45,1960.
PATRAN 2012 Reference Manual, Part 3: Finite Element Modeling, http://www.mscsoftware.com/
SIMMLER H. Langzeitverhalten Österreicher Talsperren und Fluss-Stauwerke, Die Talsperren Österreichs, Heft 28, 1984
TESKEY W. F. Integrierte Analyse von geodätischen, geotechnischen und physikalischen Modelldaten zur Beschreibung des Deformationsverhaltens großer Erddämme unter statischer Belastung, DGK Reihe C, 1988, Nr. 341, München.
WELSCH W.; HEUNECKE O. Models and Terminology for the Analysis of Geodetic Monitoring Observations – Official Report of the Ad-Hoc Committee of FIG Working Group 6.1. The 10th FIG International Symposium on Deformation Measurements, March 19-22 2001, California.
