Paula Magrani
1,2e Fernando Augusto Monteiro Saboia Pompeu
1,2Universidade Federal do Rio de Janeiro1; Hospital dos Servidores do Estado2, Rio de Janeiro, RJ - Brazil
Mailing address: Fernando A. M. S. Pompeu •
Av. Carlos Chagas Filho, 540 - Ilha do Fundão - 21941-599 - Rio de Janeiro, RJ - Brazil
E-mail: [email protected]
Manuscript received January 31, 2009; revised manuscript received August 24, 2009; accepted October 22, 2009.
Abstract
Background: VO2 may be predicted with base on anthropometric and physiological parameters for determined populations.
Objective: To propose models for submaximal and maximal VO2 prediction in young Brazilian adults.
Methods: A total of 137 volunteers (92 men) underwent graded maximal exercise test (GXT) in a cycle ergometer (Monark™, Br). Gas exchange and respiratory measurements were performed in an open circuit (Aerosport™ TEEM 100, USA). In another group, 13 volunteers underwent GXT and a square wave test (SWT) in order to evaluate the external validity of Neder et al’s formula, ACSM’s formula, and of Åstrand-Ryhming nomogram. The study design chosen was a cross-validation and the significance level was set at p ≤ 0.05.
Results: For men during submaximal exercises, a mathematical model was deduced with base on workload, body mass, and age, which explained 89% of the VO2 variation, with SEE (standard error of the estimate) = 0.33 l.min-1. For the maximum load in the male group, another model with the same variables explained 71% of VO2 variation, with SEE = 0.40 l.min-1. For women, 93% of VO
2 variation could be explained, with SEE = 0.17 l.min-1, both in submaximal and maximal exercise, with only one equation by use e of the same independent variables.
Conclusion: The models derived in the present study proved to be accurate to predict submaximal and maximal VO2 in young Brazilian adults. (Arq Bras Cardiol. 2010; [online]. ahead print, PP.0-0)
Key words: Maximal voluntary ventilation; physical exertion; exercise; exercise test.
indirect calorimetry1,4. Indirect calorimetry is a noninvasive
method used for VO2 measurement by means of an ergospirometer5. Difficulty of access to and high costs of
ergospirometric evaluation, however, cause predictive methods to be more frequently used than ergospirometry in the assessment of functional capacity6. Consequently, several
equations have been proposed to estimate maximal and/ or submaximal oxygen uptake based on easy-to-measure morphological and functional variables such as: body mass; age; gender; height; perceived exertion; walk time; run time; and load in watts1,7-15. These equations may be used to
determine exercise intensity. However, these methods have considerable errors (15-20%)1 which increase unpredictably
when applied to populations different from the one used to develop them. And,to date, equations generally used in this country come from populations with anthropometric, cardiopulmonary and biomechanical characteristics different from those of the Brazilian population.
With the purpose of improving oxygen uptake prediction in our population, we conducted two studies. The objective of study 1was to develop equations to predict VO2in GXT, at submaximal and/or maximal intensities, with external validity equal to or higher than that of the equations developed by Storer et al15. Study 2 had the purpose of
comparing the external validity of the equations developed
Introduction
Exercise tolerance is an important predictor of cardiovascular, pulmonary, metabolic, and muscle and joint health. The ability of muscles to take up oxygen during exercise is also an index of physical fitness1. In order to
measure this parameter (VO2), a continuous graded maximal exercise test (GXT) is usually performed in a treadmill or cycle ergometer2. In Brazil, treadmills are more frequently used;
however many laboratories also use cycle ergometers, which are more adequate in the case of orthopedic lesions and lead to few artifacts on electrocardiogram and blood pressure measurement. Mechanical cycle ergometers are also more advantageous because of their lower cost and weight, and for not requiring electricity3.
here with predictions obtained by ACSM8, Neder et al14,
and Åstrand -Ryhming16.
Methods
Study 1 - Model proposed for VO2 prediction
The subjects of this study were 137 apparently healthy non-smoker, non-athlete adult volunteers. The subjects were classified according to their body mass and divided into two groups, by randomized systematic sampling. Seventy seven men (24 ± 5 years, 76.6 ± 10.9 kg, 178.4 ± 6.8 cm, VO2max= 3.68 ± 0.74 l.min-1, W
max = 271 ± 57 watts and AnT = 1.63 ±
0.31) and thirty women (25 ± 6 years, 58.4 ± 6.9 kg, 162.7 ± 7.1 cm, VO2max= 2.29 ± 0.48 l.min-1 and W
max = 184 ±
39 watts and AnT = 1.13 ± 0.22) were drawn for the internal validity group (VI); fifteen men (27 ± 7 years, 75.6 ± 9.3 kg, 176.9 ± 6.7 cm, VO2max= 3.92 ± 0.70 l.min-1, W
max = 273
± 44 watts and AnT = 1.67 ± 0.34) and fifteen women (25 ± 6 years, 59.3 ± 7.9 kg, 161.9 ± 8.1 cm, VO2max= 2.22 ± 0.55 l.min-1, W
max = 182 ± 35 watts and AnT = 1.08 ± 0.23)
comprised the external validity group (EV). Prior to undergoing the tests, the volunteers gave a written informed consent. The experimental study protocol was approved by our institutional Ethics Committee on Human Research. On the day before the test, the individuals were advised to refrain from engaging in strenuous physical activity (> 5 METs) and to keep a mixed diet. They were also advised to avoid caffeine and food in the three hours prior to the exercise.
Test protocol
The continuous graded maximal exercise (GXT) protocol17
was adopted, consisting of an initial six-minute rest with the individual sitting on the cycle ergometer (Monark™, Brazil), followed by a four-minute warm-up of pedaling with no load, and by the progressive phase with increments by 10% in VO2max per minute18. The maximum load was estimated by
using anthropometric parameters19. The graded phase lasted
between 8 and 12 minutes at most, and the pedal cadence was not changed during the exercise (approximately 1.23 Hz). Tests not interrupted by fatigue within the established time were disregarded.
The respiratory and gas exchange variables were recorded every 20 seconds and measured by a metabolic analyzer (Aerosport™ TEEM 100, USA) with a pneumotachograph (Hans Rudolph™, USA). Heart rate (HR) was measured by a cardiotachometer (Polar™Vantage NV, Finland) every five seconds.
Equipment was calibrated before each test was performed. All tests were performed in the same cycle ergometer and the pedal cadence was controlled by means of an audiovisual metronome. The ergospirometer was calibrated by means of a certified gas mixture (AGA™, Brazil) containing 17.01% oxygen, 5.00% carbon dioxide, and balanced with nitrogen. Flow was calibrated by using a three-liter syringe (Hans Rudolph™, USA), and the cycle ergometer by using a 3-kg weight.
The tests were considered maximal when at least three of the following criteria were observed, according to Howley et
al4: VO
2 plateau (increase ≤ 150ml.min-¹ or 2 ml.kg-¹.min-¹);
RER (respiratory exchange ratio)≥ 1.15; HRmax ≥ 90% of age-predicted HR (220 - age); perceived exertion rate ≥ 18. Maximal volitional fatigue with inability to keep the pre-established rhythm. VO2max was determined as the highest
value obtained during maximal exertion. In the present study, the maximum load was defined as that observed at VO2max. The anaerobic threshold (AnT) was established by using the V-slope method20, by determining the inflexion point in the
VO2 x VO2 curve21. The measurements mentioned were taken
by two independent observers and AnT was the mean of the two observations.
Study 2 - External validity of ACSM8, Neder et al14 and Åstrand-Ryhming16 VO
2 prediction models
Thirteen adult volunteers participated in the second study; of these, eight were men (24 ± 3 years, 81.5 ± 13.6 kg, 181.9 ± 5.6 cm) and five were women (22 ± 3 years, 63.2 ± 11.7 kg, 163.9 ± 2.2 cm), all apparently healthy, non smokers and non-athletes.
Test protocol
Following the same procedures for calibration and control used in study 1, the subjects underwent GXT and square wave test1 (SWT) alternated within a period from one to 14
days. SWT comprised two loads, the first one submaximal (SWTsub) and the second one maximal (SWTmax). The individuals cycled for six minutes at the submaximal load, and the mean HR measured in the last two minutes was used to estimate VO2maxby means of the Åstrand-Ryhming nomogram16. After
a 10-minute rest with the individual sitting on the cycle ergometer and connected to the ergospirometer, the second load of 110% to 115% of the estimated load for VO2maxwas started. The last load was controlled during the exercise in order to lead to exhaustion at between two and three minutes.
Statistical analysis
The statistical analysis was carried out by using the Statistical Package for the Social Sciences™ (SPSS, USA) and Microsoft Excel™ for Windows XP™ (USA). Descriptive statistics was used with mean ± standard deviation (SD). For group VI, regression equations were derived for VO2 prediction at several exercise intensities.The external validity of the derived equations was tested in cross-validation by applying them to group EV. The values predicted and measured were compared by using the paired t test. The external validity of Storer et al’s equation15 for men and women (03M and 03F, respectively)
proposed for the same GXT protocol were analyzed in group EV by using two-way ANOVA and post-hoc Tukey-HSD test. With the maximum values obtained in group VI, a specific regression equation was also derived to predict VO2maxfor the male group. The external validity of this equation was tested in group EV, and the values predicted and measured were compared by using two-way ANOVA and post-hoc Tukey-HSD test, together with the maximum predicted values for the same group by using Storer et al’s equation15.
Bland and Altman’s limits of agreement22 were used
error was also observed by means of the technical error of measurement (s = SDdif ÷Ö2) and of the coefficient of variation (CV).
Values measured in GXT and SWT were compared by using two-way ANOVA; post-hoc Tukey-HSD test with VO2max estimated by Åstrand-Ryhming nomogram16 by
using the workload (06M-NW and 06F-NW); and the VO2 value measured (06M-NV and 06F-NV). Åstrand-Ryhming16
normogram estimates corrected for age by using the equations proposed by Siconolfi et al23 (07M and 07F) were also
compared to the values measured. VO2maxand VO2accuracy, as estimated by recent (05M and 05f) and old equations (04M and 04F) proposed by ACSM8, was checked. Neder et
al 14 model (08M and 08F) for the Brazilian population was
compared only to the values measured in SWT. The level of significance for all statistical tests was set at ≤ 0.05.
Results
Submaximal VO2values measured and Watt for group EV were 2.01 (±1.11) l.min-1 and 273 (±44) watts for men and
1.25 (±0.63) l.min-1 and 182 (±35) for women. The prediction
equation for oxygen uptake derived for the male group was:
Equation 01M
VO2 = -0.131 + (0.01103 x Watt) + (0.007786 x Body Mass) - (0.00617 x Age)
R2 = 0.89 and SEE = 0.33 l.min-1
For the female group:
Equation 01F
VO2 = -0.461 + (0.01043 x Watt) + (0.007096 x Body Mass) + (0.01006 x Age)
R2= 0.93 and SEE = 0.17 l.min-1
Where: R2 = coefficient of determination; SEE = standard
error of the estimate.
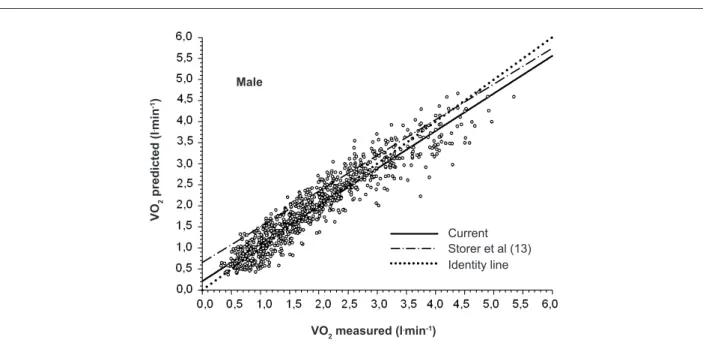
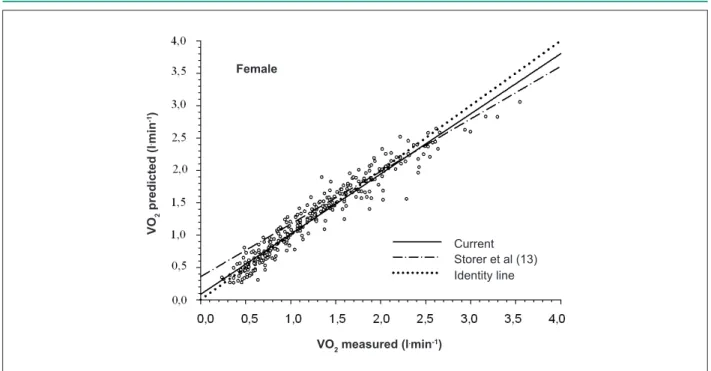
The results of the predictions through equations 01M, 01F, and 03F for submaximal values were not significantly different from the values measured in group EV. A significant difference between the submaximal values measured and predicted was detected for equation 03M (p = 0.02). Likewise, at peak exercise, equations 01F and 03F did not show significant differences between the values measured and predicted. Equations 01M and 03M, in turn, showed significant differences when used for VO2maxprediction (p = 0.001 and p = 0.04, respectively). The external validity of equations 01M, 03M, 01F and 03F are shown in Figures 1 and 2. In order to determine the quality of equations 01M and 01F at other intensities, the values measured and predicted at three submaximal loads were compared. No significant differences were found for equation 01M at 40% VO2max (p = 0.40), 60%VO2max (p = 0.72) and 80% VO2max (p = 0.13); or for equation 01F at 40%VO2max (p = 0.06), 60% VO2max
(p = 0.15) and 80% VO2max (p = 0.70). In order to improve VO2maxprediction for the male group, another equation was derived to be applied at peak exercise:
Equation 02M
VO2max = 0.518 + (0.01016 x Wattmax) + (0.01482 x Body Mass) - (0.0292 x Age)
R2 = 0.71 and SEE = 0.40 l.min-1
No significant difference was found between the maximum values measured and predicted in group EV when equation 02M was used.
In the second study, submaximal values of VO2 and of the load obtained in SWTsub were 1.55 (±0.46) l.min-1 and
Figure 1 -Scatter plot of the male group EV with VO2 values measured and predicted by equations 01M and 03M - Study 1.
VO
2
p
re
di
cte
d
(l
.m
in
-1)
Male
VO2 measured (l.min-1)
Figure 2 -Scatter plot of the female group EV with VO2 values measured and predicted by equations 01F and 03F - Study 1.
VO
2
p
re
di
cte
d
(l
.m
in
-1)
Female
VO2 measured (l.min-1)
Current Storer et al (13) Identity line
100 (±19) watts for men, and 0.93 (±0.35) l.min-1 and 70
(±21) watts for women. Submaximal VO2 values predicted by all models were not significantly different from the values measured (Table 1). The maximum oxygen uptake value (VO2max) obtained in GXT was 3.09 (±0.99) and 1.49 (±0.13) l.min-1 for men and women, respectively. For the female group,
there were no significant differences between VO2maxvalues predicted and measured by GXT. For the male group, VO2max values measured by GXT were statistically different from the values predicted by 07M-NV (p= 0.04, CV = 35.31%, s = 0.90 l.min-1, r2= 0.46) and by 07M-NW (p= 0.03, CV=
39.3%, s = 1.01 l.min-1, r2= 0.25) when Siconolfi et al’s
correction23 was applied to Åstrand-Ryhming nomogram16.
VO2max and Wmax obtained in SWTmax were 3.12 (±0.73) l.min-1
and 215 (±46) watts for men, and 1.63 (±0.14) l.min-1 and 139
(±22) watts for women. For the female group, no significant difference was found between VO2max values predicted and
measured in SWTmax. For the male group, in turn, VO2max values obtained in SWTmax were statistically different from the values predicted by 07M-NV (p = 0.01) and by 07M-NW (p = 0.01), when the Siconolfi et al’s correction23 was applied to
Åstrand-Ryhming nomogram16. The male group also showed
VO2maxvalues statistically different from those predicted by equation 08M (p = 0.02). Results from the analysis carried out by using VO2maxpredictive methods compared to values
measured in SWTmax are shown in Table 1.
Discussion
Despite the large number of VO2prediction equations, very
few of them are not specific for a determinate population. The high correlation and moderate standard error of the estimate found in the present study showed that VO2can be predicted with satisfactory accuracy by using body mass, age,
and workload as independent variables.
Quality control of measurements by means of calibration procedures and operation of equipment by experienced technicians24 is fundamental for respiratory and gas
exchange parameters to be accurately reproduced. In tests where these procedures are adopted, there is low variation in measurements repeated a short time apart24,25. The
ergospirometer used in this study was validated by another group26. The quality of measurements taken by our equipment,
in turn, was determined by means of the intraclass correlation coefficient for test and retest measurements of the respiratory and gas exchanges, which were 0.91 for EV; 0.95 for VO2 and 0.93 for VO2. These results were obtained at loads between 15 and 340 watts in the cycle ergometer. The difference in the accuracy of the measurements obtained with equipments more sophisticated than the one we used (3.8%27versus 5.5%)
may lead to a small error in the application of our equations, but this error could not be determined.
The results obtained by cross-validation of equations 01M and 01F (study 1) showed an accurate VO2prediction. When
equations 01M and 03M were used to predict VO2max, a significant difference was observed between values measured and predicted. Unlike the results found for the male group, equations 01F and 03F were accurate for VO2maxprediction in the female group. This result can be explained by the fact that men are more aggressive during peak exercise, which leads to an increased aerobic component and activation of fast muscle fibers, consequently increasing power production and changing the linear VO2/wattratio28. In order to improve VO
2max
prediction for the male group, equation 02M was proposed, which proved to be superior to equation 03M.
Malek et al29 analyzed the external validity of Storer et
al’s equations15 for VO
Table 1 - Cross-validation for VO2 in the cycle ergometer - Study 2
Equation Predicted VO2 (l.min-1)
(Mean ± SD) Limits of agreement s r CV
Submaximal effort
Present study
01M 1.46 ± 0.25 0.09 ± 0.27 0.19 0.87 12.71
01F 0.94 ± 0.18 - 0.01 ± 0.30 0.22 0.50 23.10
ACSM8 r
04M 1.67 ± 0.25 -0.12 ± 0.28 0.20 0.85 12.18
04F 1.21 ± 0.19 -0.29 ± 0.33 0.23 0.39 12.68
ACSM8 a
05M 1.51 ± 0.25 0.04 ± 0.29 0.20 0.82 13.37
05F 1.08 ± 0.23 -0.15 ± 0.37 0.26 0.24 26.16
Neder et al14
08M 1.48 ± 0.21 0.06 ± 0.66 0.23 0.08 16.43
08F 1.15 ± 0.23 -0.22 ± 0.77 0.16 0.14 17.00
Maximal effort
Present study
01M 2.73 ± 0.55 0.39 ± 0.33 0.23 0.90 7.96
01F 1.66 ± 0.29 - 0.07 ± 0.29 0.20 0.22 11.42
02M 3.22 ± 0.57 -0.10 ± 0.33 0.23 0.90 7.30
ACSM8 r
04M 2.94 ± 0.54 0.19 ± 0.34 0.24 0.90 7.83
04F 1.98 ± 0.28 -0.35 ± 0.29 0.21 0.17 11.40
ACSM8 a
05M 2.92 ± 0.58 0.21 ± 0.32 0.23 0.90 7.61
05F 1.93 ± 0.29 -0.30 ± 0.31 0.22 0.00 12.28
Åstrand-Ryhming16
06M-NW 3.14 ± 0.49 -0.02 ± 0.66 0.47 0.45 14.88
06F-NW 2.14 ± 0.31 -0.51 ± 0.42 0.30 0.72 15.89
06M-NV 3.15 ± 0.91 -0.03 ± 0.42 0.30 0.89 9.48
06F-NV 1.83 ± 0.24 -0.20 ± 0.13 0.09 0.90 5.26
Siconoli et al23
07M-NW 2.09 ± 0.17* 1.03 ± 0.66 0.46 0.52 17.82
Equation Predicted VO2 (l.min-1)
(Mean ± SD) Limits of agreement s r CV
07F-NW 1.83 ± 0.15 -0.20 ± 0.26 0.19 0.68 10.82
07M-NV 2.10 ± 0.28* 1.03 ± 0.48 0.34 0.92 12.99
07F-NV 1.73 ± 0.05 -0.10 ± 0.11 0.08 0.68 4.69
Neder et al14
08M 2.76 ± 0.52* 0.36 ± 0.69 0.25 0.89 9.23
08F 1.92 ± 0.24 -0.29 ± 0.56 0.20 0.84 12.99
M - male; F - female; ACSM8 r - current equation; ACSM8 a - old equation; s - technical error of the measurement; r - correlation coeficient between values measured and
individuals, and showed that these had the lower standard error of the estimate (SEE) among the equations they analyzed. The SEE found by Malek et al29 was 0.32 and 0.27 l.min-1 for
men and women, respectively, whereas in the original study, Storer et al15 found SEE of 0.20 and 0.13 l.min-1 for men and
women, respectively. In the present study, the SEE found for these equations were 0.41 and 0.15 l.min-1,for men and
women, respectively. These values were close to those found for equations 01F and 02M derived here.
The results obtained in study 2 demonstrated accuracy in the prediction of VO2values by equations 01M, 01F and 02M. Equations 01M and 01F proved to be as good as ACSM’s8
and Neder et al14 (04M, 04F, 05M, 05F, 08M and 08F) for the
prediction of submaximal values (Table 1). In an attempt to analyze the applicability of equations 01M, 01F and 02M in different protocols, two maximal tests were performed, one graded (GTX) and another by using square wave (SWTmax). In both protocols, equations 01M, 01F and 02M predicted VO2maxaccurately. Equation 02M, however, was superior for it showed a lower coefficient of variation and total error (TE= - 0.10 l.min-1), in comparison to equation 01M (TE= 0.39
L.min-1). Maximum values obtained in GXT and in SWT max were
only different from the values predicted by Åstrand-Ryhming nomogram16 when using the workload (NW) and VO
2 (NV),
when corrected by equation 07M. Siconolfi et al23 derived
equations (07M and 07F) that modify VO2maxvalues obtained by the original method of Åstrand-Ryhming nomogram16. We
noticed that equation 07M worsens the original prediction made by Åstrand-Ryhming method16, producing a total error
of 1.03 l.min-1. The high workload increments in
1-minute-duration stages and the plateau criterion of 250 ml.min-1 and
RER ≥ 1.00 at peak exercise may have caused VO2maxto be
underestimated in Siconolfi et al’s study23. There was also a
significant difference between the VO2maxvalues measured and predicted when equation 08M was applied14. This method,
which was developed for the Brazilian population, did not prove accurate in predicting the VO2max of active subjects in SWT.
Analysis of limits of agreement showed a trend to overestimate VO2max when the Åstrand-Ryhming nomogram16
was used in the female group (Table 1). Zwiren et al30analyzed
the external validity of Åstrand-Ryhming nomogram16 in
women aged between 30 and 39 years with VO2maxof 2.4 (± 0.45) l.min-1 and concluded that the Åstrand-Ryhming
method16 overestimated VO
2max by 20%. When
Åstrand-Ryhming nomogram16 was used to infer this parameter in
the male group, the values predicted were not significantly different from those measured. On the other hand, Table 1 shows that 06M-NW and 06M-NV had higher coefficients of variation, typical measure error, and lower correlation in comparison to the male equations 01M and 02M. Davies et al31 studied a male group aged 22 (± 2) years with higher
VO2max(50.7 ml.kg-1.min-1) and found a confidence interval (CI
= 95%) of -0.96 (±0.47) l.min-1 (HR = 120<140 bpm) and
-0.64 (±0.39) l.min-1 (HR = 140<180), as predicted by the
workload, by using Åstrand-Ryhming nomogram. For Davies et al31, this method has a CV of 15% for estimates using VO
2
and of 21% using the load.
Recent studies showed that the relationship between oxygen uptake and workload is linear up to the intensity of 50% to 60%VO2max. After this point, the function becomes exponential32. We analyzed this relationship by using the
single-phase or two-phase linear model. In the latter, it is understood that there is a linear function up to the transition point, from which VO2 starts to increase in exponential function. For the male group, the linear model showed R2
= 0.88, SEE = 0.34 and mean square errors (MSE) = 0.12. When the two-phase model was used, the values obtained were adjustment of R2 = 0.80, SEE = 0.34 and MSE = 0.11.
These results were quite similar and suggest that the two-phase model was not superior.
In conclusion, the models derived in the present study proved to be accurate in predicting submaximum and maximum VO2in young Brazilian adults. Based on study 1, equation 01M did not prove to be valid at maximal intensities. The other equations (01F and 02M) may be used with satisfactory external validity at peak exercise. VO2maxprediction significantly improved for the male group when equation 02M was used. The equations derived by Storer et al15 did
not show a higher accuracy in predicting VO2max. In study 2, the equations derived were valid both for submaximal and maximal intensities. The equation proposed by Siconolfi et al23 (07M) to correct Åstrand-Ryhming method16, and Neder
et al’s equations14 for men did not show a satisfactory result
for the local population. We also concluded that the equations derived in this study showed satisfactory external validity in protocols with or without steady state.
Limitations
Factors such as variation in the mechanical efficiency at a given workload, medication or alcohol intake, heat, hypobaric environments and individuals with diseases or body mass and age different from those of the subjects of this study may increase prediction error. Thus, this study does not present a form of replacing, with the same accuracy, direct VO2 measurement. Other equations for other age ranges and different patient groups should be further derived.
Acknowledgements
References
1. Åstrand PO, Rodahl K, Dahl HA, Stromme SB. Textbook of work physiology. Champaign: Human Kinetics; 2003. p. 273-97.
2. Sanada K, Midorikawa T, Yasuda T, Kearns CF, Abe T. Development of nonexercise prediction models of maximal oxygen uptake in healthy Japanese young men. Eur J Appl Physiol. 2007; 99 (2): 143-8.
3. American College of Sports Medicine, Davis SE (editor). In: ACSM’s health-related physical fitness assessment manual. 2nd ed. Philadelphia: Lippincott Williams & Wilkins; 2007.
4. Howley ET, Basset Jr DR, Welch HG. Criteria for maximal oxygen uptake: review and commentary. Med Sci Sports Exerc. 1995; 27 (9): 1292-301. 5. Marson F, Martins MA, Coletto FA, Campos AD, Basile-Filho A. Correlação
entre o consumo de oxigênio obtido pelo método de Fick e pela calorimetria indireta no paciente grave. Arq Bras Cardiol. 2003; 82 (1): 72-6.
6. Rondon MUP, Forjaz CLM, Nunes N, Amaral SL, Barreto ACP, Negrão CE. Comparação entre a prescrição de intensidade de treinamento físico baseada na avaliação ergométrica convencional e na ergoespirométrica. Arq Bras Cardiol. 1998; 70 (3): 159-66.
7. Peterson MJ, Pieper CF, Morey MC. Accuracy of VO2max prediction equations in older adults. Med Sci Sports Exerc. 2003; 35 (1): 145-9.
8. American College of Sports Medicine – Appendix D: Metabolic calculations. In: Guidelines for exercise testing and prescription. 6th ed. Philadelphia: Lippincott Williams & Wilkins; 2000. p. 300-12.
9. Bradshaw DI, George JD, Hyde A, LaMonte MJ, Vehrs PR, Hager RL, et al. An accurate VO2max nonexercise regression model for 18-65-year-old adults. Res Q for Exerc Sport. 2005; 76 (4): 426-33.
10. Bruce RA, Kusumi F, Hosmer D. Maximal oxygen intake and nomographic assessment of functional aerobic impairment in cardiovascular disease. Am Heart J. 1973; 85 (4): 546-62.
11. Faulkner J, Parfitt G, Eston R. Prediction of maximal oxygen uptake from the ratings of perceived exertion and heart rate during a perceptually-regulated sub-maximal exercise test in active and sedentary participants. Eur J Appl Physiol. 2007; 101 (3): 397-407.
12. Foster C, Jackson M. Pollock L, Taylor MM, Hare J, Sennett SM, et al. Generalized equations for predicting functional capacity from treadmill performance. Am Heart J. 1984; 107 (6): 1229-34.
13. Malek MH, Housh TJ, Berger DE, Coburn JW, Beck TW. A new nonexercise-based VO2max equation for aerobically trained females. Med Sci Sports Exerc. 2004; 36 (10): 1804-10.
14. Neder JA, Nery LE, Castelo A, Anderson S, Lerario MC, Sachs A, et al. Prediction of metabolic and cardiopulmonary responses to maximum cycle ergometry: a randomised study. Eur Respir J. 1999; 14 (6): 1304-13. 15. Storer TW, Davis JA, Caiozzo VJ. Accurate prediction of VO2max in cycle
ergometry. Med Sci Sports Exerc. 1990; 22 (5): 704-12.
16. Åstrand PO, Ryhming I. A nomogram for calculation of aerobic capacity from pulse rate during submaximal work. J Appl Physiol. 1954; 7 (2): 218-21. 17. Wasserman K, Whipp BJ, Koyal SN, Beaver WL. Anaerobic threshold and
respiratory gas exchange during exercise. J Appl Physiol. 1973; 35 (2): 236-43. 18. Buchfuhrer MJ, Hansen JE, Robinson DY, Sue DY, Wasserman K, Whipp BJ. Optimizing the exercise protocol for cardiopulmonary assessment. J Appl Physiol. 1983; 55 (5): 1558-64.
19. Nogueira FS, Pompeu FAMS. Modelos de predição da carga máxima no teste clínico de esforço cardiopulmonar. Arq Bras Cardiol. 2006; 87 (2): 137-45. 20. Beaver WL, Wasserman K, Whipp BJ. A new method for detecting the
anaerobic threshold by gas exchange. J Appl Physiol. 1986; 60 (6): 2020-7. 21. Yazbek Jr P, Carvalho RT, Sabag LMS, Batistella LR. Ergoespirometria: teste
de esforço cardiopulmonar, metodologia e interpretação. Arq Bras Cardiol. 1998; 71 (5): 719-24.
22. Bland JM, Altman DG. Statistical methods for assessing agreement between two methods of clinical measurement. Lancet. 1986; 1: 307-10. 23. Siconolfi SF, Cullinane EM, Carleton RA, Thompson PD. Assessing VO2max in
epidemiologic studies: modification of the Åstrand-Ryhming test. Med Sci Sports Exerc. 1982; 14 (5): 335-8.
24. Guimarães JI, Stein R, Vilas-Boas F, Galvão F, Nobrega ACL, Castro RRT, et al. Normatização de técnicas e equipamentos para a realização de exames em ergometria e ergoespirometria. Arq Bras Cardiol. 2003; 80 (4): 458-64. 25. Granja Filho PCN, Pompeu FAMS, Ribeiro AP. A acurácia da determinação do
VO2máx e do limiar anaeróbio. Rev Bras Med Esporte. 2005; 11 (3): 167-71. 26. Novitsky S, Degal KR, Chatr-Aryamontri B, Gubakov D, Katch Vl. Validity
of a new portable indirect calorimeter: the Aerosport TEEM 100. Eur J Appl Physiol. 1995; 70 (5): 462-7.
27. Hopkins WG, Schabort EJ, Hawley JA. Reliability of power in physical performance test. Sports Med. 2001; 31 (3): 211-34.
28. Pedersen PK, Sørensen, JB, Jensen K, Johansen L, Levin K. Muscle fiber type distribution and nonlinear VO2-power output relationship in cycling. Med Sci Sports Exerc. 2002; 34 (4): 655-61.
29. Malek MH, Berger DE, Housh TJ, Coburn JW, Beck TW. Validity of VO2max equations for aerobically trained males and females. Med Sci Sports Exerc. 2004; 36 (8): 1427-32.
30. Zwiren LD, Freedson PS, Ward A, Wilke S, Rippe JM. Estimation of VO2max: a comparative analysis of five tests. Res Q Exerc Sports. 1991; 62 (1): 73-8. 31. Davies CTM. Limitations to the prediction of maximum oxygen intake from
cardiac frequency measurements. J Appl Physiol. 1968; 24 (5): 700-6. 32. Zoladz JA, Szkutnik Z, Majerczak J, Duda K, Pedersen PK. Non-linear