Relative price variability in Brazil:
an analysis of headline and core inflation rates
Cleomar Gomes da Silva*
Resumo
O objetivo deste artigo é estudar a relação cau-sal entre inlação e variabilidade de preços re-lativos no Brasil, para o período entre janeiro de e junho de . O foco é o IPCA e seu núcleo, levando-se também em conta o período das metas de inlação. A análise de séries tem-porais mostra que: ) a correlação entre inlação e dispersão de preços relativos é positiva e sig-niicante (o mesmo se aplica ao núcleo da inla-ção); ) para o período referente às metas para a inlação, há queda da dispersão de preços; ) há bi-causalidade entre inlação total e dispersão total de preços, ao passo que a causalidade é do núcleo de inlação para sua respectiva variabi-lidade; ) as funções de respostas a impulsos mostram que choques no núcleo do IPCA não afetam a dispersão dos preços do núcleo tanto quanto os choques ao IPCA total afetam a dis-persão total de preços; ) a decomposição de variância relacionada ao núcleo do IPCA e seu respectivo RPV parece estar reduzida em rela-ção aos dados do IPCA cheio.
Abstract
he aim of this article is to study the causal relationship between inlation and relative price variability in Brazil. he period under analysis spans from January to June . It focuses on both headline and core
inlation rates, and also takes the inlation targeting regimeinto account. he time series analysis shows that: i) the correlation between inlation and relative price variability is positive and signiicant (the same applies to core inlation); ii) price dispersiondecreases ater the implementation of inlation targeting; iii) there is bi-causality between Headline-IPCA and Headline-RPV, but causality from Core-IPCA to Core-RPV; iv) the impulse response functions show that shocks to Core-IPCA don’t afect Core-RPV as much as shocks to Headline-IPCA afect
Headline-IPCA; v) the variance decomposition related to Core-IPCA and Core-RPV seems to be reduced when compared to headline inlation.
Key Words
Relative Price Variability, Inlation, Monetary Policy
JEL Classification
C33, E31, E52
Palavras-Chave
Dispersão dos Preços Relativos, Inlação, Política Monetária
Classificação JEL
C33, E31, E52
*Instituto de Economia -
1_Introduction
heoretical and empirical researchers pay special attention to the relationship between inlation and relative price variability (RPV). his is a legitimate concern given that it signiicantly contributes to the understanding of inlationary processes, its transmission mechanisms, and the welfare costs involved in (dis)inlation policies.
his issue is even more relevant when the conduct of the monetary policy is embedded in a context of low inlation.1
he economic environment depends on the relationships involving relative prices for the allocation of scarce resources. Any discrepancy in these prices causes a similar discrepancy in the decisions of economic agents. Consequently, the allocation of resources within the economy is not maximized.
In other words, it is well-established that price stability is essential and positive. herefore, the
assessment of the efects of inlation on the relative price dispersion (and vice-versa) can provide policy makers with efective instruments in relation to actions against inlation pressures, at the lowest possible cost, in terms of product and employment variability.
his discussion is also important for Brazil,
especially following the implementation of the Real Plan in , which ended a long period of high inlation in the country. In , the country abandoned
the ixed exchange regime, ater years of an anchored exchange rate system, and implemented a monetary reform with a nominal anchor based on an inlation targeting (IT) regime.
he goal of this article is to analyze thecausal relationship between inlation and relative price variability in Brazil. he analysis starts in and continues until the middle of , taking into
consideration the Brazilian Consumer Price Index (IPCA)
and its core inlation. We also look at the period ater the adoption of inlation targeting.
By making use of OLS estimations, as well as Generalized Impulse Response Functions, Generalized Variance Decomposition and Granger Causality tests, the
main indings are: i) the correlation between inlation and relative price variability is positive and signiicant (the same applies to core inlation); ii) price dispersion decreases ater the implementation of inlation targeting; iii) there is bi-causality between Headline-IPCA and
Headline-RPV, but causality from Core-IPCA to Core-RPV; iv) the impulse response functions show that shocks to
Core-IPCA do not afect Core-RPV as much as shocks to Headline-IPCA afect Headline-RPV; v) the variance decomposition related to Core-IPCA and Core-RPV seems to be reduced when compared to headline inlation.
In addition to this introduction, the article provides an empirical literature review in Section . Section
addresses the RPV measures and the database used. Section discusses the econometric methodology. Section reports the estimation results and the inal section concludes.
2_Literature Review
From a theoreticalperspective, the relation between inlation and RPV is explained by two main approaches: i) signal extraction (imperfect information) models; ii) menu cost models.
According to the signal extraction models (Lucas,
the optimum quantity being produced, or a change in the aggregated level, maintaining the optimum production unaltered. As expected, the producer attributes part of the change to an increase in the price level and part to an increase in the relative price (Romer, ). Given this information asymmetry, when a general aggregated demand shock hits the economy, each producer interprets the variation inthe general price level as a relative price variation (at least in part) and increases the supply of the product being produced. Consequently, the aggregated demand shock can induce involuntary increases of aggregated supply and, therefore, yield a production deviation in relation to its natural level even within rational expectations. In other words, within an imperfect information environment, a higher inlation rate renders aggregated demand shocks less predictable. As such, in comparison to irms with low supply elasticity,
those with high supply elasticity make small price adjustments in reaction to unexpected demand shocks (Bakhshi, ).
As such, we can say that the imperfect information model demonstrates that unanticipated changes in price levels and RPV increases are the result of unanticipated alterations in the money stock. If, in individual markets, the change in supply elasticity is diferent from the change in demand elasticity, the relative price variations will result in efective alterations. Given that the real economic conditions remain unaltered, changes in relative prices cause poor allocation of resources. Finally, this approach assumes that shocks result in inlation and relative price dispersion; and such dispersion only occurs when there is an erroneous perception of inlation –although the opposite does not hold true (Fischer, ).2
As for the second approach, the New Keynesians started to seek to provide microfoundations for the
nominal prices stickiness phenomenon, as researchers began to observe that nominal prices were not so lexible because of two main reasons: the decision to adjust prices involved costs and the decision not to adjust did not substantiallyalter the irm’s proits. hese models are known as Menu Costs (Rotemberg, , ; Ball & Mankiw, , ). As an example, derisory costs of price changes involved in the making of a new menu for a restaurant lead to sporadic and scaled price adjustments which, in turn, result in a slow adjustment of inlation. Firms respond dynamically to inlation through an appraisal rule based on superior and inferior limits. Nominal prices are kept constant until a reduction of real prices reaches the inferior limit. Only then are nominal prices adjusted up to the superior limit. If, hypothetically, irms are incapable of increasing prices simultaneously, the menu costs model anticipates that a rise in inlation also increases the optimum diference between the superior and inferior limits (Bakhshi, ). herefore, menu cost models predict a positive relation between RPVand anticipated/unanticipated inlation and assume that inlationary processes cause price dispersion.
Another approach related to menu cost models uses the asymmetric responses of prices to perturbations, i.e., prices are more lexible when they increase than when they decrease. his approach derives a positive association between inlation and RPV. For example, suppose that: i) prices are lexible downwards; ii) in the absence of
Ball & Mankiw () propose a model in which irms make regular price changes and, when paying for the costs of a new menu, make additional pricing adjustments in response to perturbations. In this model, asymmetries occur naturally with a tendency of additional positive inlation. As such, positive shocks in prices, chosen by irms, generate a larger adjustment if compared to negative shocks of the same magnitude. Intuitively, inlation process decreases the irm’s relative prices automatically among adjustments. When a irm wants smaller relative prices, it does not need to pay for a menu cost, because inlation alone does all the necessary work. In contrast, a positiveshock generates an increase in the irm’s relative price (desired), but also generates an increase in its relative efective price. As a result, a large gap between the desired and the efective prices is created. herefore, the possibility of price adjustments is more eminent in cases of positive shocks than in cases of negative shocks. hus, the authors’ model is consistent with the evidence documented by Fischer (), among others: inlation and RPV are positively correlated, with causality of inlation to dispersion. Nevertheless, such causality can go in the opposite direction if price stickiness is asymmetric as pointed out by Fischer (Ball & Mankiw, ).
According to Gali (), the fact that irms do not adjust their prices continuously constitutes a source of ineiciency due to two main reasons. Firstly, it implies that, in response to shocks, the economy´s average markup will vary over time. his violates the eiciency condition as it entails either too low or too high a level of aggregate employment and output. Secondly, the lack of synchronization in price adjustments means that the occurrence of RPV has no link to changes in preferences or technologies. herefore, prices are not adjusted in the same period, causing distortions which
will lead to the production and consumption of diferent goods in distinct quantities. As a result, eiciency is once again violated.
Regarding the empirical literature, one of the irst works about the relation between inlation and RPV wasthat of Mills (), who analyzed the American case. Another important article, by Parks (), developed one
of the most famous measures of relative price variability, which is used in this article. In order to ind the positive correlation between inlation and RPV, Parks () used disaggregated data of consumption goods from the USA and the Netherlands and showed that changes in relative prices are related to alterations in supply, in real income, and in unanticipated inlation (the diference between the efective rate and the observed perturbations).
Ater Parks (), several researchers contributed to the related literature. For the American case: Vining & Elwertowski (), Parsley (), Debelle & Lamont (), Jaramillo (), Chang & Cheng (), and Caglayan & Filiztekin (). All the results corroborated the positive relationship between inlation and RPV. On the other hand, Driill, Mizon & Ulph () and Bomberger & Makinen (), among others, emphasized that those results were due to the inclusion of variables related to large supply shocks.3
be refuted. Furthermore, they argued that the positive relationship between inlation and RPV strengthened when the downward price stickiness phenomenon was taken into consideration.
Fielding & Mizen () studied the functional relationship between RPV and inlation using quarterly PCE data in the U.S. for the period ranging from
to . According to the authors “the empirical RPV function yields a plausible ‘optimal’ value of inlation in the region of ive percentage points.”Bick & Nautz () studied the impact of inlation on RPV in U.S. cities and argue that “if monetary policy aims at minimizing the impact of inlation on relative prices, our estimates suggest that U.S. inlation should range between .
percent and . percent.”
Following this line of research, other authors looked at relative price dispersion in diferent countries. Domberger (), for instance, analyzed the British case; Fielding & Mizen () investigated European countries; Van Hoomissen () and Lach & Tsiddon (, ) considered the Israeli case; Tommasi () and Dabus () looked at the Argentinean case; Nautz & Scharf () explored the German context; Berument, Sahin & Saracoglu () studied the Turkish case, while Choi () focused on Japan and the USA.
In relation to Brazil, Moura da Silva & Kadota () examine the correlation between RPV and inlation for the period between and . he main interest of the authors was to show that the price dispersion was connected to the Brazilian inlationary process at that time. A higher inlation rateused to produce a greaterstandard deviation of relative prices. Moreover, this greater relative price dispersion was associated with inlation outbreaks derived from supply shocks. Resende & Grandi () used Granger causality tests to study the
price variability of goods included in the wholesale price index for the - period. he authors did not reach a solid conclusion regarding the direction of the causal relation (Fava & Cyrillo, ). Fava & Cyrillo ()made use of a price index elaborated by FIPE-USP for the period between and . he authors examined
the theoretical approach of the menu cost models and also the asymmetric response of prices to random shocks. he results implied a dual causality between
inlation and RPV, which did not corroborate with the menu cost theory. On the other hand,
the asymmetric response theory was not refuted in cases of sub-periods of the analysis.
3_Data and Measures of Relative Price Variability
he disaggregated data set used in this article is extracted from the IBGE Database and refers to goods included in the Consumer Price Index (IPCA), which is the Brazilian oicial inlation rate used in the inlation targeting system. he purpose of analyzing the Core-IPCA is to take into account the possibility of endogeneity among variables given that higher prices strongly associated with supply shocks can be eliminated from the RPV. he period under analysis spans from January to June
. Ater this initial analysis, we consider the period ater the adoption of IT, from August to June , since it is important to study the behavior of important items included in the IPCA during theIT period.
For the RPV calculation, we use an -digit disaggregation available at IBGE´s database4
In line with Parks (), Fischer (), Domberger (), and Nautz & Scharf (), among others, our RPV measure takes into account the weight related to each one of the items used in the inal price index. his is important assome categories are more (or less) important within the inal calculation of the consumer inlation. herefore, the RPV is calculated as follows:
()
where is the price variation related to item ‘i’ in the period ‘t’;is the monthly inlation measured by IPCA in the period ‘t’; ‘n’ is the number of categories;‘w’ is the category’s weight.
RPV
n
w
t i i
n
it t
=
1
∑
=1(
π
−
π
)
2Figure 1_Headline-IPCA and Headline-RPV (Jan/1995 – Jun/2011)
Table reports the descriptive statistics of the data used in this article. When the IPCA and Core-IPCA are compared, we notice that the values related to the latter are more prominent, which is something that has to be analyzed more deeply.
Source: IBGE
Table 1_Inflation and RPV: Descriptive Statistics (Jan/1995 – Jun/2011)
Headline-IPCA Headline-RPV Core-IPCA Core-RPV
Mean 0.60 1.18 1.19 0.58
Median 0.48 1.04 1.04 0.47
Maximum 3.02 3.48 3.49 2.70
Minimum -0.51 0.61 0.62 -0.35
Std. Dev. 0.52 0.47 0.49 0.46
Obs. 198 198 198 198
Figures and show the behavior of inlation and RPV for the Headline-IPCA and Core-IPCA, respectively. For the consumer price as a whole, Figure shows four signiicant peaks in the RPV between and , which are not associated with strong inlationary processes. he causes relate to several international events, such as
the Russian and Asian crises. Moreover, it is easy to see that the exchange rate lexibility did not produce a considerable variation in relative prices. For the period ater IT was adopted, the most outstanding relative price
dispersion refers to the Lula crisis, and it is correlated to the inlation of that period. It is also possible to see that the period ater the exchange rate lexibility shows a decrease in RPV, approaching the country’s inlation rate. Considering the Core-IPCA, Figure does not show prominent peaks as in the case of the Headline-IPCA. For instance, the outstanding relative price dispersion referred to the Lula crisis, very clear in the former igure, does notoccur in the case of Core-IPCA and its Core-RPV.
Figure 2_Core-IPCA and Core-RPV (Jan/1995 – Jun/2011)
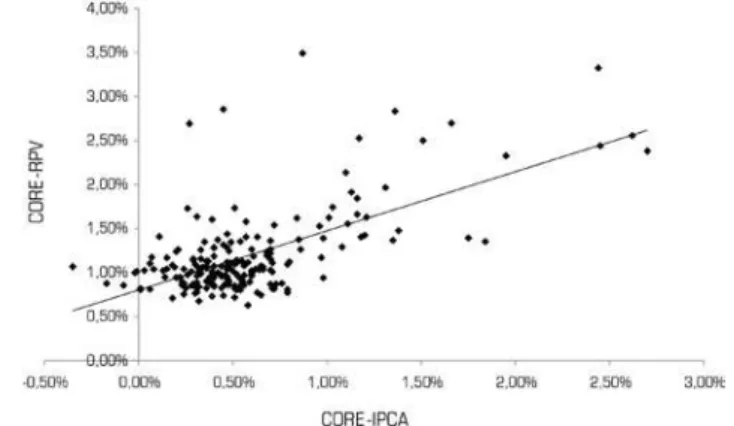
Figure displaysscatter plot graphs between inlation and RPV for all the series analyzed. One can see that the regression lines, generated in both graphs, have a positive slope, which indicates that, at least visually, there is a positive relationship between RPV and inlation in the Brazilian case.
4_Econometric Approach
he irst stage of the analysis is the following estimation:
()
where RPV
t is the square root of the relative price
variability ands*πt is the absolute value of the inlation rate. We should also mention that other lags of RPV may be used as an RHS variable. Our aim is to study whether the positive relation between inlation and RPV holds and whether the lagged RPV is important when diferent measures of IPCA are taken into consideration.
In addition to this basic model, we examine the role of the disinlationary processes in the RPV, aiming to test if
prices respond symmetrically or asymmetrically to inlation and disinlation cases. his methodology is also used in several works, such as in Parks (), Debelle & Lamont () and Jaramillo () for the American case, Tommasi () for the Argentinean case, and Caglayan & Filiztekin () for the Turkish data. he procedure is as follows:
()
where is the multiplication of the absolute value of inlation and a dummy variable (d
abs), which is equal to
for disinlation and for inlation. As mentioned by Jaramillo (), this term takes into account the distinct degrees of RPV response to shocks derived from inlation or disinlation and, as such, it allows for diferent slopes of disinlationary periods. In sum, if the data used in the analysis disregards any asymmetry in the response to inlation or disinlation processes, the β3parameter in equation () should not be signiicantly diferent from zero. Figure 3_Scatter Plot: Headline-IPCA vs Headline-RPV and Core-IPCA vs Core-RPV
Source: IBGE
RPVt=β0+β π1 t +β2RPVt p− +εt
()
In the second stage of our analysis, we apply Granger Causality tests and VAR methodology,as in Fischer (), in order to analyze inlation and RPV reactions when perturbations are imposed on the variables. We make use of Generalized Impulse Response Functions and Generalized Variance Decomposition.
5_Results
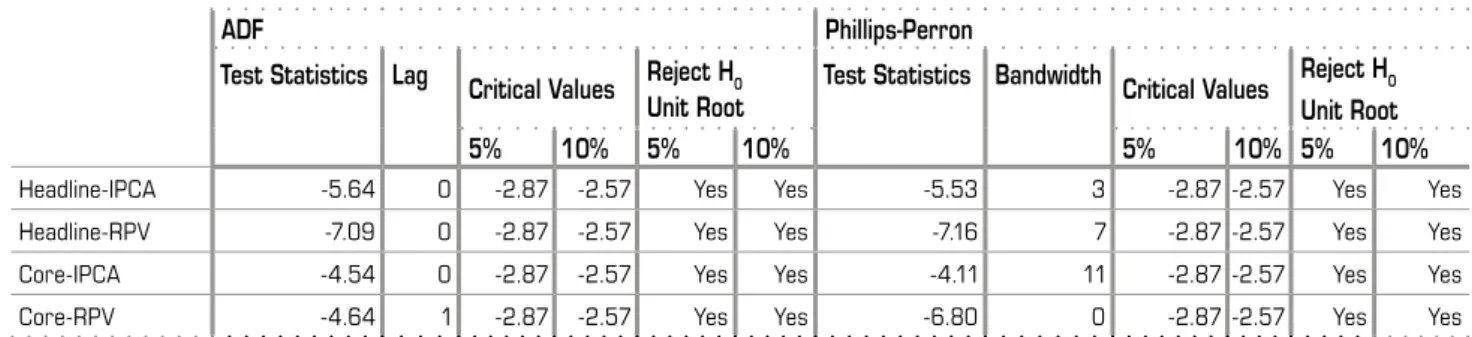
First of all, we start by estimating ADF and Phillips-Perronunit root tests for all series (Table ). For all estimations, the null hypothesis of a unit root
(nonstationarity) is rejected, using a % level of signiicance. Table shows the estimations related to equations
and . In general, we notice that the usual result is a positive correlation between inlation, as reported by the graphs in Figure . For the Headline-IPCA the coeicient found is . and, when the asymmetric adjustment
RPVt=β0+β π1 t +β2RPVt p− +β3dummyIT+εt
Table 2_Unit Root Tests
ADF Phillips-Perron
Test Statistics Lag Critical Values Reject H0 Unit Root
Test Statistics Bandwidth Critical Values Reject H0 Unit Root
5% 10% 5% 10% 5% 10% 5% 10%
Headline-IPCA -5.64 0 -2.87 -2.57 Yes Yes -5.53 3 -2.87 -2.57 Yes Yes
Headline-RPV -7.09 0 -2.87 -2.57 Yes Yes -7.16 7 -2.87 -2.57 Yes Yes
Core-IPCA -4.54 0 -2.87 -2.57 Yes Yes -4.11 11 -2.87 -2.57 Yes Yes
Core-RPV -4.64 1 -2.87 -2.57 Yes Yes -6.80 0 -2.87 -2.57 Yes Yes
Note: Estimations with constant only.
Table 3_Estimation Results
s
*
π
t RPVt-1 RPVt-2 Constantd
abs*
π
t DWLM Auto-corr. F stat. Dependent Variable Headline-RPV 0.391 (0.055) [0.000] 0.229 (0.069) [0.001] 0.251 (0.081) [0.002] 0.363 (0.052) [0.000] -1.959 0.271 [0.762] 0.389 (0.056) [0.000] 0.228 (0.069) [0.001] 0.252 (0.082) [0.002] 0.364 (0.053) [0.000] -0.019 (0.054) [0.719] 1.960 0.283 [0.753] Dependent Variable Core-RPV 0.363 (0.059) [0.000] 0.247 (0.079) [0.002] 0.252 (0.091) [0.005] 0.368 (0.060) [0.000] -2.026 0.116 [0.890] 0.356 (0.064) [0.000] 0.256 (0.086) [0.003] 0.252 (0.094) [0.008] 0.369 (0.059) [0.000] -0.133 (0.094) [0.159] 2.022 0.067 [0.934]
is taken into consideration, the coeicient practically remains the same (.).In both cases, the regression delivers a coeicientrelated to the asymmetry, which is not statistically signiicant, meaning that prices are lexible downwards. In addition to that, RPV is strongly determined by its lagged value.
As for the Core-IPCA, there is a slight decrease in price dispersion with and without the asymmetric response, even though the latter is not statistically signiicant. In all cases, prices vary downwards in the same way as they do upwards, which means that they increase in the same proportion as they decrease. hus, we can infer that RPVis higher for the headline inlation and there is no diference when prices go up or down, although there are only around ten cases of disinlation.
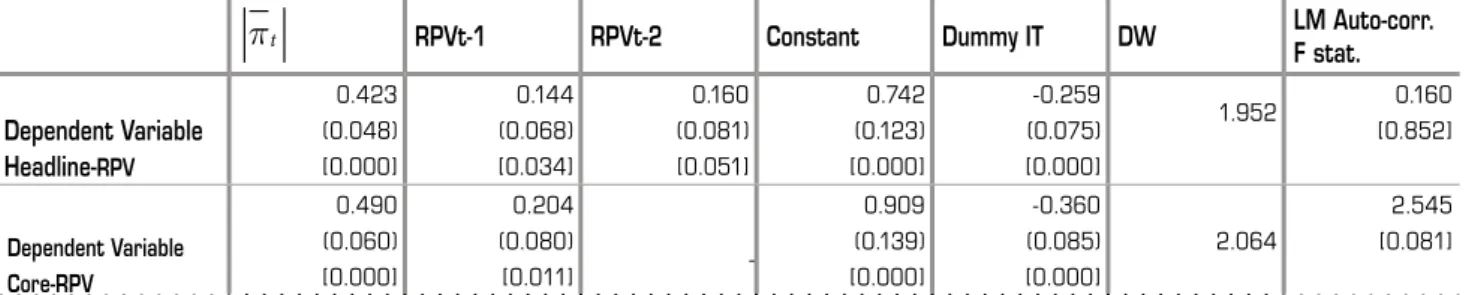
Table shows the estimations related to equation , which accounts for the IT period. We also notice that the usual positive relationship between inlation and RPV is found.Furthermore, it is clear that the IT dummy is negative and statistically signiicant.
his is a very important result because it means that inlation shocks increase relative price variability in Brazil, as usually found in other countries. It also means that the introduction of the targets played an important
role in the process of anchoring inlation in Brazil and, as a result, reduced the variability of prices.
Having shown the usual positive correlation between inlation and relative price variability, we now turn to Granger Causality Tests to address some other issues more speciically for the whole period (January – June ), with or without a dummy variable for the inlation targeting period.
5.1_Granger Causality Tests
Granger causality tests are useful to answer the question whether how much of a current value can be explained by past values of other variables, and if additional lags are also needed5
. In this stage, we aim to analyze if the causal relationship between inlation and RPV, as anticipated by the menu cost models, is applicable to the Brazilian case. If the prediction made by Sheshinski & Weiss () is correct, the causality relationship should range from inlation to the dispersion of prices. However, the opposite causality could occur, or there could be no causality at all.As we needed to estimate Granger causality tests with an exogenous variable (IT dummy), and address autocorrelation problems in the estimations as well, we ran speciic test regressions.
Table 4_Estimation Results (with Inflation Targeting Dummy)
πt
RPVt-1 RPVt-2 Constant Dummy IT DW LM Auto-corr.F stat.
Dependent Variable Headline-RPV
0.423 (0.048) [0.000]
0.144 (0.068) [0.034]
0.160 (0.081) [0.051]
0.742 (0.123) [0.000]
-0.259 (0.075) [0.000]
1.952 0.160
[0.852]
Dependent Variable Core-RPV
0.490 (0.060) [0.000]
0.204 (0.080)
[0.011]
-0.909 (0.139) [0.000]
-0.360 (0.085) [0.000]
2.064
2.545 [0.081]
he models to be analyzed are the following:i) Model:
Headline-IPCA and Headline-RPV (withoutIT dummy); ii) Model: Headline-IPCA and Headline-RPV (with IT
dummy); iii) Model: Core-IPCA and Core-RPV (without
IT dummy); iv) Model: Core-IPCA and Core-RPV (with
IT dummy). In order not to run the risk of estimating causalities with wrong lags, we estimated OLS regressions until we found the correct lag via Wald tests.
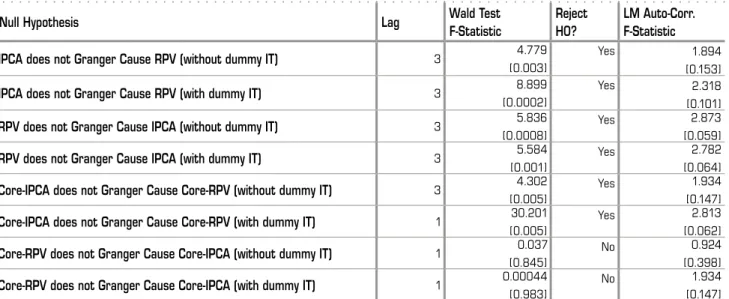
Table presents these results. For the Headline IPCA and RPV, the null hypothesis is rejected in all four cases, meaning that there is a bi-causality, IPCA Granger-causes RPV and RPV Granger-causes IPCA (with and without the IT dummy). As for the core inlation, Core-IPCA Granger-causes Core-RPV (with or without the IT dummy). But the opposite is not true, i.e., Core-RPV does not Granger Cause Core-IPCA. It means that the Granger causality tests show that the direction goes from core inlation to the dispersion of core prices, which is inline with the indings of Sheshinski & Weiss ().
5.2_VAR Estimations
he Granger causality tests do not show a clear pattern of time precedence between RPV and Headline-Inlation, even though causality was found for core inlation. According to the tests, it is still uncertain whether any of the variables should be considered predominant. Probably, each variable causes the other, or both are afected by the same disturbances. Most likely, this mutual causality between inlation and RPV can be examined using the VAR methodology (Fischer, ).he models to be analyzed are Models through described previously. We then make use of the statistics related to VAR models: i) Generalized Impulse Response Functions; ii) Generalized Forecast Error Variance Decomposition.
Table reports the models selected, via Schwarz Information Criterion (SC). Model requests lags to be estimated, whereas models , and request lag. However, when VAR Residual Serial Correlation LM Tests Table 5_Granger Causality Tests
Null Hypothesis Lag Wald Test
F-Statistic
Reject H0?
LM Auto-Corr. F-Statistic
IPCA does not Granger Cause RPV (without dummy IT) 3 4.779
[0.003]
Yes 1.894
[0.153]
IPCA does not Granger Cause RPV (with dummy IT) 3 8.899
[0.0002]
Yes 2.318
[0.101]
RPV does not Granger Cause IPCA (without dummy IT) 3 5.836
[0.0008]
Yes 2.873
[0.059]
RPV does not Granger Cause IPCA (with dummy IT) 3 5.584
[0.001]
Yes 2.782
[0.064]
Core-IPCA does not Granger Cause Core-RPV (without dummy IT) 3 4.302 [0.005]
Yes 1.934
[0.147]
Core-IPCA does not Granger Cause Core-RPV (with dummy IT) 1 30.201 [0.005]
Yes 2.813
[0.062]
Core-RPV does not Granger Cause Core-IPCA (without dummy IT) 1 0.037 [0.845]
No 0.924
[0.398]
Core-RPV does not Granger Cause Core-IPCA (with dummy IT) 1 0.00044 [0.983]
No 1.934
[0.147]
are applied, it is clear that lag is not enough to address autocorrelation problems in models , and . herefore, all models are estimated with lags.
5.2.1_Generalized Impulse Response Functions
We employ the Generalized Impulse Response Functions6
to further study the properties of the system. he analysis of the response functions to impulses is of great importance because if irms adjust their prices more frequently, along with an unanticipated inlation rise, a greater initial increase is expected in the average price of a certain product proportionalto the inlation rate. Table 6_VAR Lag Order Selection - Schwarz Information Criterion (SC)
Lag
IPCA Core-IPCA
Model 1 Model 2 Model 3 Model 4
Without IT Dummy
With IT Dummy
Without IT Dummy
With IT Dummy
0 1.72 1.49 1.32 1.06
1 1.05 0.95* 0.46* 0.35*
2 1.04* 1.00 0.47 0.42
3 1.10 1.06 0.56 0.51
* indicates lag order selected by the criterion.
Figure 4_Generalized Impulse Response Functions
(A) Response of RPV to IPCA (B) Response of IPCA to RPV
Figure displays the Generalized Impulse Response Functions for the Headline-IPCA and its RPV. Graphs A and B show the responses of RPVto IPCA, and vice-versa. Shocks to the IPCA (RPV) cause a positive efect in the RPV (IPCA) with complete dissipation only ater years. It means that the positive relationship between inlation and RPV is conirmed, as it was in the previous tests: a shock in inlation increases the variability of prices in Brazil.Graphs C and D display the accumulated impulse response functions.
When a dummy for the inlation targeting period is included, responses are less intensive,
irrespective of if they come from RPV or IPCA. As already mentionedthe adoption of the inlation targeting system seems to be an important step towards a lower dispersion of relative prices in Brazil, as IT is able to anchor inlation expectations and, as result, increase eiciency in the economy.
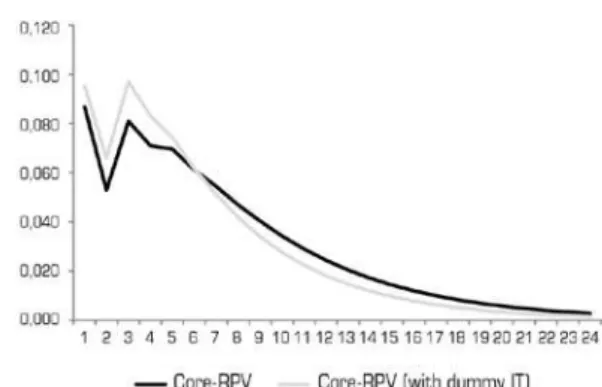
Figure shows the Generalized Impulse Response Functions for Core-IPCA and Core-RPVas the result of shocks coming from both variables.Graphs A and B show that both shocks generate responseswhich areless intensive than those observed in the Headline-IPCA,
Figure 5_Generalized Impulse Response Functions
(A) Response of Core-RPV to Core-IPCA (B) Response of Core-IPCA to Core-RPV
even though the convergence of the responses is quite similar. his could be an indication that when volatility is excluded from the Headline-IPCA, shocks to core inlationdo not afect Core-RPV, and vice-versa. Notice, also, that the accumulated response of Core-RPV (Graph D)is closer when one compares the series with and without the IT dummy. Again, this indicates that only when the core inlation is analyzed, does the dispersion of prices respond less intensively.
5.2.2_Generalized Forecast Error Variance Decomposition As in the case of the Impulse Response Functions, the
Generalized Forecast Error Variance Decomposition is also invariant to the ordering of the variables7
. Table
shows that, for the Headline IPCA (with and without a dummy for IT), the results are very similar, that is, ater one year, % of the variance decomposition is related to the variables themselves. For the RPV, ater one year,
% do the Forecast Error Variance Decomposition is explained by the RPV itself, whereas % is explained
by the CPI inlation. When the IT dummy is taken into consideration there is not much change in the igures:
% for the RPV and % for the IPCA.
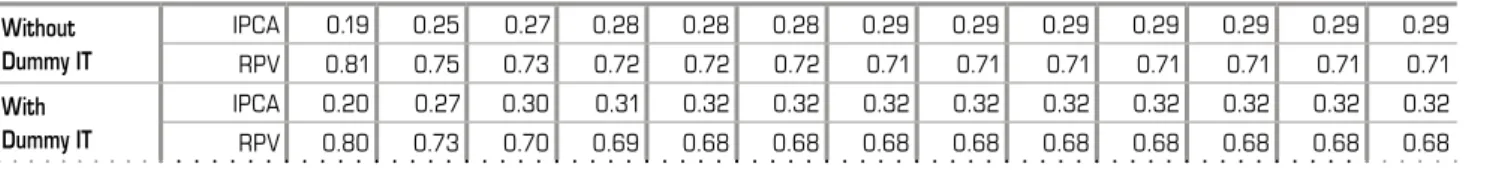
Table shows the results for the Core-IPCA and its RPV (with and without a dummy for IT). For the Core-IPCAwithout a dummy for IT, the results are very similar to the ones reported on Table : ater one year, % of the variance decomposition is related to the Core-IPCA itself. On the other hand, for the Core-IPCAwithout a dummy for IT, the results difer. For the RPV, ater one year, % do the Forecast Error Variance Decomposition is explained by the RPV itself, whereas % is explained by the CPI inlation. When a dummy is included, the results are % and % respectively. Again, this has something to do with the exclusion of volatile prices from the core inlation.
Another interesting comparison can be made between the results reported on Tables and . Comparing the Generalized Forecast Error Variance Decompositions for IPCA (Table ) with Core-IPCA (Table ), the results remain almost the same, when a dummy for the inlation targeting
Table 7_Generalized Forecast Error Variance Decomposition (Headline IPCA and RPV)
Generalized Forecast Error Variance Decomposition for Variable IPCA
Horizon 0 1 2 3 4 5 6 7 8 9 10 11 12
Without Dummy IT
IPCA 0.81 0.85 0.82 0.80 0.78 0.77 0.77 0.76 0.76 0.76 0.75 0.75 0.75
RPV 0.19 0.15 0.18 0.20 0.22 0.23 0.23 0.24 0.24 0.24 0.25 0.25 0.25
With Dummy IT
IPCA 0.80 0.83 0.80 0.79 0.78 0.77 0.77 0.76 0.76 0.76 0.76 0.76 0.76
RPV 0.20 0.17 0.20 0.21 0.22 0.23 0.23 0.24 0.24 0.24 0.24 0.24 0.24
Generalized Forecast Error Variance Decomposition for Variable RPV
Without Dummy IT
IPCA 0.19 0.25 0.27 0.28 0.28 0.28 0.29 0.29 0.29 0.29 0.29 0.29 0.29
RPV 0.81 0.75 0.73 0.72 0.72 0.72 0.71 0.71 0.71 0.71 0.71 0.71 0.71
With Dummy IT
IPCA 0.20 0.27 0.30 0.31 0.32 0.32 0.32 0.32 0.32 0.32 0.32 0.32 0.32
system is not included, and are slightly smaller (around
percentage points) in favor of Core-IPCA with the inclusion of a dummy for inlation targeting.
On the other hand, results change when one makes a comparison between the Generalized Forecast Error Variance Decompositions for RPV (Table ) and
Core-RPV(Table ). Without a dummy for the inlation targeting period, the variance decomposition for Headline-RPV shows that % of the error comes from the variable itself. his igure increases to % when the Core-RPV is analyzed. With a dummy for inlation targeting, the percentages are
% and %. It means that the variance decomposition of RPV faces important changes (around percentage points) between the headline and core calculations.
6_Conclusion
his article proposed an empirical analysis of the
correlation between inlation and relative price variability in Brazil. To this purpose, we focused on both headline and core inlation rates, and also took into account the
inlation targeting regime. he period under analysis went from January to June . We found a positive and signiicant correlation between inlation and relative price variability in all estimations (the same applying to core estimations). As well as that, wefound a signiicant decrease in the relative price variability ater the implementation of the inlation targeting framework.In addition, bi-causality between Headline-IPCA and Headline-RPV was reported. Impulse response functions showed that shocks to Core-IPCA did not afect Core-RPV as much as shocks to Headline-IPCA afected Headline-RPV. Lastly, the variance decomposition related to Core-IPCA and Core-RPV seemed to be reduced when compared to headline inlation.
In sum, our results show that, as it is usually found in other countries, inlation shocks increase relative price variability in Brazil, Our results also illustrate that the introduction of the inlation targeting framework was very important in anchoring inlation in Brazil and, consequently, reducing the variability of prices. It was also possible to notice that that relative price variability has Table 8_Generalized Forecast Error Variance Decomposition (Core-IPCA and RPV)
Generalized Forecast Error Variance Decomposition for Variable Core-IPCA
Horizon 0 1 2 3 4 5 6 7 8 9 10 11 12
Without Dummy IT
Core-IPCA 0.89 0.82 0.81 0.79 0.78 0.77 0.77 0.76 0.76 0.76 0.76 0.76 0.76
Core-RPV 0.11 0.18 0.19 0.21 0.22 0.23 0.23 0.24 0.24 0.24 0.24 0.24 0.24
With Dummy IT
Core-IPCA 0.88 0.79 0.76 0.74 0.73 0.72 0.71 0.71 0.71 0.71 0.71 0.71 0.71
Core-RPV 0.12 0.21 0.24 0.26 0.27 0.28 0.29 0.29 0.29 0.29 0.29 0.29 0.29
Generalized Forecast Error Variance Decomposition for Variable Core-RPV
Without Dummy IT
Core-IPCA 0.11 0.09 0.12 0.13 0.15 0.16 0.17 0.18 0.18 0.18 0.19 0.19 0.19
Core-RPV 0.89 0.91 0.88 0.87 0.85 0.84 0.83 0.82 0.82 0.82 0.81 0.81 0.81
With Dummy IT
Core-IPCA 0.12 0.11 0.15 0.17 0.18 0.19 0.20 0.20 0.21 0.21 0.21 0.21 0.21
declined over the years in Brazil and that part of such dispersion is related to the presence of volatile prices as core inlation seems to deliver less price dispersion.
In terms of economic policy, the dispersion of relative prices, in the face of inlationary shocks, can disrupt allocative eiciency, as mentioned in Gali (). his might beevidence that the lack of synchronization in price adjustments may cause welfare losses, meaning that monetary policy tools are important in ighting inlation. herefore, the adoption of an inlation targeting framework is an important tool for anchoring inlation expectations and bringing social welfare gains and more credibility to monetary policy actions.
Notes
In a context of high inlation, costs are usually related to inlation tax, among others.
In simpliied versions of these models, anticipated changes in the money stock do not afect relative prices, and as such, the anticipated inlation should not be associated with additional RPV. In sophisticated versions, the anticipated inlation may not be neutral and might afect the real interest rate and, therefore, the relative prices. Nevertheless, the emphasis is on the role of unanticipated changes in the money stock (Fischer, ).
See Danziger () for a detailed discussion.
In relation to this, Fischer () highlights that the RPV is more efectively measured the more
disaggregated the price index is, which is our case. If resource allocation failures, associated with unexpected inlation, are the result of excessive searching, such demand might be due to the belief in price diferences of very similar goods.
It is helpful to remember that Granger causality does not imply causality, as popularly meant, but is related to precedence and information content.
he impulse response functions, proposed by Pesaran & Shin (), avoid the use of the Cholesky decomposition in the deinition of the most suitable variable ordering. It is well known that the results can be substantially afected by arbitrary orderings.
References
BAKHSHI, H. Inlation and relative price variability. Economics Letters, n. , p. -, .
BALL, L.; MANKIW, N. G.
Asymmetric price adjustment and economic luctuations.
Economics Journal, n. , p. -, .
BALL, L.; MANKIW, N. G.
Relative price changes as aggregate supply shocks.
Quarterly Journal of Economics, n. , p. -, .
BARRO, R. J. Rational expectations and the role of monetary policy. Journal of Monetary Economics, n. , p. -, .
BERUMENT, M. H.; SAHIN, A. & SARACOGLU, B. he choice of monetary policy tool(s) and relative price variability: evidence from Turkey.
Journal of Applied Sciences, n. , p. -, .
BICK, A. & NAUTZ, D. Inlation thresholds and relative price variability: evidence from U.S.
cities. International Journal of Central Banking, n. (Sept.), p. -, .
BOMBERGER, W. A.; MAKINEN,
G. E. Inlation and relative price variability: parks’ study reexamined. Journal of Money, Credit and Banking, n. , p. -, .
CAGLAYAN, M.; FILIZTEKIN, A.
Relative price variability and inlation: new evidence from Turkey. Mimeo, .
CAGLAYAN, M.; FILIZTEKIN, A. Nonlinear impact of inlation on relative price variability.
Economics Letters, v. , n. , p.
-, .
CHANG, E. C.; CHENG, J. W.
Further evidence on the variability of inlation and relative price variability.
Economics Letters, v. , n. , p. -, .
CHANG, E. C.; CHENG, J. W.
Inlation and relative price variability: a revisit. Applied Economics Letters, n. ,
p. -, .
CHOI, C. Reconsidering the relationship between inlation and relative price variability.
Journal of Money, Credit and Banking, v., n. , p. -, .
CUKIERMAN, A.Inlation, staglation, relative prices and imperfect information. Cambridge: Cambridge University Press, .
DABUS, C. Inlationary regimes and relative price variability: evidence from Argentina.
Journal of Development Economics, v. , n. , p. -, .
DANZIGER, L. Inlation, ixed cost of price adjustment, and measurement of relative-price variability: theory and evidence.
American Economic Review, v. , n. , p. -, .
DEBELLE, G.; LAMONT, O.
Relative price variability and inlation: evidence from U.S.
cities. he Journal of Political Economy, v. , n. , Feb., p. -, .
DOMBERGER, S. Relative price variability and inlation: a disaggregated analysis. he Journal of Political Economy, v. , n. , June, p. -, .
DRIFILL, J.; MIZON, J.; ULPH,
A. M. Costs of inlation. In:
FRIEDMAN, B. M.; HAHN, F. H.
Handbook of Monetary Economics. Amsterdam: Elsevier Science Publishers, . p. -.
FAVA, V. L.; CYRILLO, D. C.
Inlação e dispersão de preços relativos: qual a direção da causalidade? Economia Aplicada, v. , n. , p. -, .
FIELDING, D.; MIZEN, P. Relative price variability and inlation in europe. Economica, v. , n. , p. -, .
FIELDING, D. & MIZEN, P.
Evidence on the functional relationship between relative price variability and inlation with implications for monetary policy. Economica,n. , p. -, .
FISCHER, S. Relative shocks, relative price variability, and inlation. Brookings Papers on Economics Activity, n. , p. -, .
GALI, J.Monetary policy, inlation, and the business cycle: an introduction to the New Keynesian Framework. Princeton: Princeton University Press, .
HERCOWITZ, Z. Money and the dispersion of relative prices.
Journal of Political Economy, n. , p. -, .
JARAMILLO, C. F. Inlation and relative price variability: reinstating parks’ results.
Journal of Money, Credit, and Banking, v. , n. , p. -, .
LACH, S.; TSIDDON, D. he behavior of prices and inlation: an empirical analysis of disaggregated price data.
LACH, S.; TSIDDON, D. he efects of expected and unexpected inlation on the variability of relative prices.
Economics Letters, v., n. , p. -, .
LUCAS, R. E. Some international evidence on output-inlation tradeofs. American Economic Review, n. , p. -, .
MILLS, F. he behavior of prices. New York: Arno, .
MOURA DA SILVA, A.; KADOTA,
D. K. Inlação e preços relativos: o caso brasileiro – -. Estudos Econômicos, n. , p. -, .
NAUTZ, D.; SCHARFF, J. Inlation and relative price variability in a low inlation country: empirical evidence for Germany.
German Economic Review, v. , n. , p. -, .
PARKS, R. W. Inlation and relative price variability.
he Journal of Political Economy, v. , n. , p. -, .
PARSLEY, D. Inlation and relative price variability in the short and long run: new evidence from the United States.
Journal of Money, Credit, and Banking, v. , n. , p. -, .
PESARAN, M. H.; SHIN, Y. Generalized impulse response analysis in linear multivariate models. Economics Letters, n. , p. -, .
RESENDE, M.; GRANDI, R. Inlação e variabilidade dos preços relativos no Brasil: a questão da causalidade.
Revista Brasileira de Economia, n. , p. -, .
ROMER, D.Advanced macroeconomics. New York: McGraw-Hill/Irwin, .
ROTEMBERG, J. Monopolistic price adjustment and aggregate output. Review of Economic Studies, n. , p. -, .
ROTEMBERG, J. Aggregate consequences of ixed costs of price adjustment.
American Economic Review, n. , p. -, .
SHESHINSKI, E.; WEISS, Y.
Inlation and costs of price adjustment. Review of Economic Studies, n. , p. -, .
TOMMASI, M. Inlation and relative prices: evidence from Argentina. In: SHESHINSKI, E.; WEISS, Y. (Eds.). Optimal pricing, inlation, and the cost of price adjustment.Cambridge and London: MIT Press, .
VAN HOOMISSEN, T. Price dispersion and inlation: evidence from Israel. Journal of Political Economy, v. , n. , p. -, .
VINING, D. R.; ELWERTOWSKI,
T. C. he relationship between relative prices and the general price level. American Economic Review, n. , p. -, .
he author thanks CNPQ, FAPEMIG and PROPP-UFU for inancial support.
E-mail de contato do autor:
cleomargomes@ie.ufu.br.