Basel III: Impact on Banks in Brazil
*Fernando Antonio Perrone Pinheiro
Universidade de São Paulo, Faculdade de Economia, Administração e Contabilidade, Departamento de Administração, São Paulo, SP, Brazil
José Roberto Ferreira Savóia
Universidade de São Paulo, Faculdade de Economia, Administração e Contabilidade, Departamento de Administração, São Paulo, SP, Brazil
José Roberto Securato
Universidade de São Paulo, Faculdade de Economia, Administração e Contabilidade, Departamento de Administração, São Paulo, SP, Brazil
Received on 06.26.2014 – Desk acceptance on 06.29.2014 – 3rd version approved on 03.25.2015.
ABSTRACT
This article evaluates the potential impacts deriving from the change in required capital of banks in Brazil, with the implementation of Basel III. To do this, a sample of 58 banks was used, which accounts for 80% of the assets in the Brazilian National Financial System, ac-cording to the balance sheets of December 2012. The methodology adopted has simulated the need for regulatory capital that will be man-datory in the end of the transition period, in 2019, considering the continuity of risk-weighted assets (RWAs) contained in these balance sheets. Assuming that some banks will resort to the capital market to raise their capitalization level, the return on equity (ROE) for the previous three years was analyzed, compared to the cost of equity, estimated by the International Capital Asset Pricing Model (ICAPM). It was found that 23 institutions had some kind of noncompliance with the new regulatory capital, among them the 3 largest federal public banks. It was also observed that 39 banks have a ROE insufficient to attract new investors. The joint analysis of the adequacy of capital structure and the return level may identify occasional vulnerabilities. It is concluded that implementing Basel III in Brazil may increase the search for greater efficiency and profitability. In a future scenario, the Brazilian banking system may observe a wave of mergers and acquisitions and an increased number of initial public offerings (IPOs).
Keywords: regulatory capital, Basel III, banks, risk-weighted assets, bank regulation.
DOI: 10.1590/1808-057x201500720
1 INTRODUCTION
bank must meet the condition of being equal or above KE.
This article analyzes the effects of this measure for the Brazilian banking sector, through two approaches. The first is a simulation of sufficiency of the regulatory capital of banks so that they keep their strategies and operations, considering the existing portfolios in De-cember 2012, and within the rules introduced by Basel III. The second approach relates to the capacity of banks to attract capital in order to fit Basel III and, therefore, they should provide investors with consistent returns. Joint analysis of the adequacy of regulatory capital and the capacity to attract new capital will indicate the stra-tegies that each bank should pursue.
The results obtained indicate that, out of the 58 banks analyzed, 23 are not complying with the rules of Basel III, because of any of the criteria discussed in section 2.2. Overall, the banking system will need to increase the regulatory capital in about R$ 85 billion, in 2012. The difficulty to comply will increase, as 39 banks have lower returns at the cost of equity.
The main contribution of this study consists in dis-cussing the potential effects of the new Capital Accord on the financial market, since the reduced capacity of banks to leverage can precipitate the rise in spreads. In addition, the new agreement can produce an increased concentration in the system, just as the keynote in the last two decades. Finally, it is also expected to raise the debate on issues of economic policy and banking regula-tion, given the interconnectedness of the subjects.
The article is divided into seven sections, including this introduction. The second section presents a litera-ture review. The third section presents the methodology used. The fourth section consists in an analysis of the need for adjustment in the regulatory capital. The fifth section is intended to estimate the capital cost of banks and discusses their ability to attract new investors. The sixth section consists in a joint analysis of the regulatory capital and the return of banks. Finally, the seventh sec-tion presents our conclusions.
Over the past two decades, the Brazilian banking sec-tor has undergone a major consolidation, which increa-sed its concentration, the presence of large retail banks, and, within the last five years, the participation of fede-ral public banks increased.
The 2008 international financial crisis has barely affected the capacity of this system. Brazilian banks, most of them, were complied with the regulatory capi-tal and retained risk exposures within acceptable para-meters, corroborating the views that regulatory capital (Laeven & Levine, 2009) and the supervision by regula-tors (Buch & DeLong, 2008) are intrinsically related to stability in the banking sector. However, the world eco-nomy has been affected by the crisis and measures were needed.
The Basel Committee on Banking Supervision (BCBS) has published a review of the Capital Accord entitled A global regulatory framework for more resilient banks and banking systems, which became known as Ba-sel III (BaBa-sel Committee on Banking Supervision, 2011). The new Capital Accord will require more capital and better quality capital. In addition, the new rules have in-troduced the concept of countercyclical capital, which, in practice, will reduce the possibility of leverage by banks. By acting on a wide range with capital regulation and liquidity standards, the new agreement leaves room to decision-making by local standard setters on how to im-plement and adapt the model to their specificities.
These measures will lead the financial institutions to need better planning for their investment and lending actions, prioritizing the acquisition of assets that provi-de a better relation between return and risk. However, the actions are not limited to a review in the investment and credit policy. Banks may also adjust to the new ru-les by issuing stock, selling part of their asset portfolio, or even putting into practice a less aggressive dividend policy, with greater profit retention. Thus, the increase in regulatory capital required by the BCBS will imply ca-pital injections by shareholders, who must be paid at the cost of equity (KE). So, the return level provided by the
2 LITERATURE REVIEW
Banks are depositaries of the savings of families, com-panies, and institutional investors. hey play the role of communicating vessels between all investors and borro-wers; therefore, the bankruptcy of a bank is a systemic pro-blem (Stiglitz & Weiss, 1981).
Banks may fail to comply when the volume of their
The BCBS is the international financial body respon-sible for recommending to the central banks prudential measures, aimed at ensuring international financial sta-bility. To this end, the BCBS has issued, in 1988, its first Capital Accord, which limited bank leverage to a level that could bring stability to the economies (Basel Com-mittee on Banking Supervision, 1988).
2.1 Background of Basel III
The primary principle of Basel Capital Accord con-sists in the compatibility of the institution’s capital with the risks involved. In the 1988 Capital Accord, named
International convergence of capital measurement and capital standards, there is, among others, the concept of risk-weighted assets (RWAs) that, multiplied by an 8% risk factor, defined the institution’s regulatory capital, in addition to the concepts of Tier 1 and Tier 2 Capital. The relation between Total Capital and RWA is named Basel Index.
The concept of RWA consists in the weighted sum of institutions’ assets, according to their risk level. In general, four weighting factors were established: 0% for government securities issued by central governments or assets of banks along with governments; 20% for amounts in compensation; 50% for interbank assets and credit guaranteed by mortgages; and 100% for the other credits.
Tier 1 represents the capital available to absorb losses on a “continuity” basis, which may be depleted without leading the bank to insolvency, special administration, or liquidation. Tier 1 consists in ordinary shares, disclo-sed reserves, and in preferred shares, provided that the latter are not redeemable and there are no cumulative dividends. At least 50% of Tier 1 should consist in stock.
Tier 2 is the capital that can absorb losses before de-positors lose all the money and it is limited to 100% of Tier 1. It consists in revaluation reserves, undisclosed reserves, provisions for unidentified future losses, and instruments that, due to their characteristics, are classi-fied as a “quasi-capital”. They are hybrid instruments of capital and debt, such as preferred shares and perpetu-al bonds, in addition to subordinated debt instruments, limited to 50% of Tier 2, with a minimum term of five years, and providing for the reduction of their effective-ness as a capital instrument at the rate of 20% per annum (p.a.) within the 5 years before maturity.
The deductions from regulatory capital introduced by the 1988 Accord are related to Goodwill (deduction from Tier 1) and investment in unconsolidated financial subsidiaries in the institution’s balance sheet (deduction from total regulatory capital).
In 2005, the BCBS published the International con-vergence of capital measurement and capital standards: a revised framework, known as Basel II (Basel Committee on Banking Supervision, 2005). Among other measures, Basel II has promoted qualitative changes regarding the concept of RWA, linking the rating to the weighting fac-tor and enabling the institutions to develop internal
mo-dels, or Internal Rating-Based Approach (IRB).
In addition, other changes were introduced in the composition of regulatory capital: from Tier 1, intangi-ble assets and increased capital coming from exposures in securitization transactions started being deducted and, simultaneously, from Tier 1 and Tier 2, equal in-vestment portions started being deducted from invest-ments in financial or unconsolidated banking subsidia-ries and investments in other financial institutions.
2.2 Changes Introduced by Basel III
Basel III has brought significant changes, particularly with regard to definitions of capital. Among the chan-ges, a new capital structure stands out, prioritizing bet-ter quality capital and establishing restrictions on lower--quality capital instruments; prudential adjustments to the institution’s capital; the concept of capital conserva-tion buffer, which is the additional capital to tackle po-tential losses; and the concept of countercyclical buffer, or countercyclical capital.
Unlike the previous agreements, which summarized the institution’s capital structure within Tier 1 and Tier 2, the new Capital Accord is considerably tighter and it starts consisting in the sum of the following elements:
a) Tier 1 Capital, whose requirement is 6% of RWA, consisting in:
i. Common Equity, or Main Capital, according to the terminology of Resolution of the Brazilian National Monetary Council (CMN) 4,192/2013, which should be greater than or equal to 4.5% of RWA; and
ii. Additional Tier 1, or Supplementary Capital, ac-cording to the same resolution.
b) Tier 2 Capital. he sum of Tier 2 and Tier 1 should be, at least, 8% of RWA.
In addition to Tier 1 and Tier 2, Basel III provides that the institution’s regulatory capital must include:
c) Capital conservation bufer consists in an extra capi-tal reserve for potential losses, providing an institu-tion that “gets into” this threshold with the continuity of its operations. Under these conditions, the institu-tion is required to stop paying dividends, until resu-ming the capital. Capital conservation bufer requires an additional of Common Equity equivalent to 2.5% of RWA.
d) Countercyclical bufer, or countercyclical capital. It aims to ensure inancial stability of the economy and its use provides freedom degrees to the central banks: when not undergoing times of crisis, a capital reser-ve is created to tackle losses during potential crises; and when undergoing times of crisis, the monetary authority may abolish it to avoid a recession. Coun-tercyclical capital requires an additional of Common Equity equivalent to 2.5% of RWA.
instruments, except for ordinary shares, redeemable only through lender’s initiative and having the consent of central banks.
Tier 2 capital consists in debt instruments with a mi-nimum term of 5 years, subject to all institution’s lia-bility, except those of Tier 1; there should not be early settlement triggers, except in case of the institution’s bankruptcy; and they should be redeemed by issuer’s initiative, observing the minimum term of 5 years, pro-vided that they are replaced by better quality instru-ments, from the viewpoint of regulatory capital.
From the above, required capital in the form of or-dinary shares, corresponds to the sum of the Common Equity Tier 1 Capital, conservation buffer, and coun-tercyclical buffer, totaling 9.5% of RWA; adding the Additional Tier 1, it may achieve 11%; and also adding
the instruments that make up the Tier 2, we reach a 13% requirement.
Prudential adjustments consist in deductions from the Common Equity Tier 1 Capital. They are Goodwill and other intangible assets; tax credits derived from tax losses that depend on future outcomes to be realized; shares issued by the treasury itself; defined pension funds benefits; cross-shareholding in banks, financial and insurance firms; direct or indirect investment in the capital of banking, financial, insurance, and similar firms, which are outside the regulatory consolidation; gain on sale of assets in securitization transactions; lack of provisions for expected losses; reserves for hedges coverage, etc.
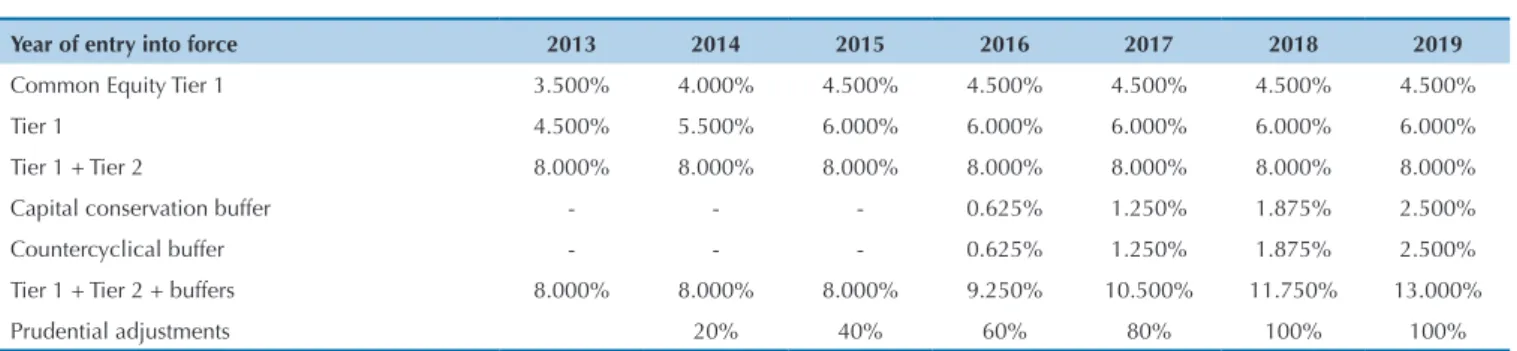
Table 1 shows the adjustment period to the new rules of the BCBS.
Insufficient capital to meet the Capital conservation buffer and Countercyclical buffer may stop, fully or par-tially, payment of dividends.
It is clear that, through the new agreement, more and better quality capital will be required from banks. If pre-viously the regulatory capital was met by the sum of Tier 1 and Tier 2, the new agreement sets out requirements for the Common Equity Tier 1, for Tier 1, and for the sum of Tier 1 and Tier 2. Besides, capital conservation buffer, and countercyclical buffer represent an additio-nal charge for banks.
2.3 Implementation of Basel III in Brazil
The Central Bank of Brazil (BACEN) published, on March 1, 2013, CMN Resolutions 4,192 and 4,193 (Ban-co Central do Brasil, 2013a, 2013b), which provide, res-pectively, for the reference property and the calculation of minimum capital requirements. In relation to Basel III, the standards differ with regard to the transition rules, because the BACEN already adopted a 11% risk factor that, by 2019, will adjust to the BCBS parame-ters. Concerning the instruments that make up capital, the BACEN has established rules similar to those of the BCBS.
Regarding prudential adjustments, it is worth men-tioning that most of the tax credits generated by Brazi-lian banks stem from provisions for doubtful settlement credits, generated when it comes to issuing at the ex-pense of credit operation. Out of the R$ 110 billion in tax credits of the Financial System, R$ 60 billion stem from credit operations (Reuters Brasil, 2013). If those tax credits were deducted from regulatory capital, Bra-zilian banks might have a disadvantage when compared to banks located in other countries. Provisional Measure 608/2013, already approved in the plenary of the Federal Senate, excluded them from those that may be deducted from regulatory capital (Brasil, 2013).
2.4 Empirical Studies on the Potential Effects
Arising from the Implementation of Basel III
Several studies have been conducted in order to an-ticipate the effects of the new Capital Accord. Herrala (2014) has studied how banks in the Eurozone anticipate to banking regulation. According to the author, within the seven years prior to the implementation of Basel II, the real estate credit policy of banks was relieved. The effects of Basel III are also already felt in the Eurozone, where banks implemented a tighter credit policy.
Year of entry into force 2013 2014 2015 2016 2017 2018 2019
Common Equity Tier 1 3.500% 4.000% 4.500% 4.500% 4.500% 4.500% 4.500%
Tier 1 4.500% 5.500% 6.000% 6.000% 6.000% 6.000% 6.000%
Tier 1 + Tier 2 8.000% 8.000% 8.000% 8.000% 8.000% 8.000% 8.000%
Capital conservation buffer - - - 0.625% 1.250% 1.875% 2.500%
Countercyclical buffer - - - 0.625% 1.250% 1.875% 2.500%
Tier 1 + Tier 2 + buffers 8.000% 8.000% 8.000% 9.250% 10.500% 11.750% 13.000%
Prudential adjustments 20% 40% 60% 80% 100% 100%
Source: Prepared by the authors.
Cohen (2013) has identified among European banks increased retained earnings, as a way to increase capita-lization, and decreased asset portfolios for sale. Howe-ver, in an aggregate way, there have been no significant cuts in the portfolio of assets. The author mentions that banks with high capitalization and profitability after the crisis have grown more than the others, something whi-ch emphasizes the importance of strong balance sheets.
he tightening of banks’ credit policy, the rise in banking spread, and the economic downturn are conclu-sions made by some researchers. Slovik and Cournède (2011) have studied the efect of Basel III on the United States, the European Union, and Japan and they conclu-ded that the measures will generate a contractionary efect between 0.05% and 0.15% per annum in the gross domes-tic product (GDP) of these economies. hey estimate that the spread may rise by 50 basis points in 2019, when the transition period of the new Capital Accord is complete, and they suggest a reduction in the primary interest ra-tes in order to reduce this contractionary efect. Similarly, according to Elliott, Salloy and Santos (2012) the lending rates in the United States, the European Union, and Japan may rise 28, 18, and 8 basis points, respectively.
Miles, Yang and Marcheggiano (2013) have studied which might be the optimal regulatory capital for banks and they weighed the cost of a financial crisis and the amount of public resources to tackle it was significant; therefore, the optimal level of capital stems from the trade-off between the reduction in GDP growth due to a crisis, with a given probability, versus the cost of GDP growth inherent to regulatory capital. The authors sug-gest that the optimal capital level is around 20% of RWA, a value which is substantially higher than the regulatory capital set in Basel III. Unlike the other researchers, the-se authors do not share the idea that there will be reduc-tion of assets in the banking sector, because the increase in regulatory capital only means that a greater portion of assets will be financed by equity, i.e. they see capital from the banks’ funding perspective.
Yan, Hall and Turner (2012) have studied the costs and benefits of Basel III in the United Kingdom, with the same goal, determining the optimal capital level. The principle is also that any contractionary effects of the new regulatory capital might be offset by a benefit, de-fined as a reduction in economic growth, if there was a
crisis. The authors have concluded that the optimal ca-pital level, defined as the sum of the Common Equity Tier 1 plus the conservation buffer, is 10%, therefore, it is higher than the 7% of Basel III.
Klomp and Haan (2012) have investigated the efect of banking regulation and supervision on over 200 banks in 21 countries of the Organization for Economic Coopera-tion and Development (OECD) between 2002 and 2008 and they concluded that banking regulation and supervi-sion are efective on banks that incur higher risk, but not on those more conservative in this regard. Based on this, the authors discuss whether regulation and supervision should not take into account the diferences between institutions.
Finally, there is the issue of eiciency gains. he Ba-sel Committee on Banking Supervision (2012) associates management gains with the stability of returns on capi-tal. Tabak, Fazio and Cajueiro (2011), studying banks in Latin America, have concluded that they work at higher levels regarding cost eiciency than proit eiciency. Better cost management does not necessarily mean that they are getting the appropriate return. According to the authors, there is evidence that private banks and foreign banks are more efective regarding proit and costs than public banks. However, discussing which banks are more efecti-ve, whether private or public, national or foreign, is a con-troversial subject and it is far from being exhausted. Ruiz Tabak and Cajueiro (2008) have listed several papers with conclusions similar to those by Tabak et al. (2011), but also others with opposite conclusions. By way of example, the studies by Silva and Jorge Neto (2002) and Nakane and Weintraub (2005) point out the greater eiciency of private banks; in turn, according to Sensarma (2006) and Altunbas, Liub, Molyneuxc and Seth (2000), public banks are the most eicient. he issue of eiciency tackles dis-crepancies not only with regard to the conclusions, but also in terms of the methods used to measure eiciency and the fact that this may change over time depending on government attitudes, increased competition, and chan-ges in administrations (Ruiz et al., 2008).
Arantes and Rocha (2012), by studying the effects of the 2008 global financial crisis, have concluded that, in times of crisis, banks seek to achieve greater rationaliza-tion of costs, by having control over these variables; on the other hand, revenues are mostly affected, by depen-ding on factors exogenous to the institution.
3 METHODOLOGY
This study consists in an exploratory, analytical, and quantitative research that seeks, through a simulation technique, to check the potential effects of increased need for equity among a representative group of Brazi-lian financial institutions.
The first analysis concerns the banks’ equity suffi-ciency. To do this, the following premises were consi-dered:
i. hat the banks will keep their exposures in subse-quent years, within the framework of the new rule calendar. his means admitting that banks will main-tain the current size of their loan portfolios and the current exposures to market risk and operational risks, among others.
capital and debt instruments existing today. In other words, they will keep the same kinds of instruments, with the same characteristics, such as maturity, and the same proportion between these instruments and the capital paid in by investors.
The growth trend of loan portfolios observed in the country over the past few years was not conside-red, fruit of the Federal Government policy to stimulate consumption through credit. Similarly, it was not consi-dered that banks usually reinvest a part of their profits, because it is understood that each institution should review its dividend policy in order to fit the capital re-quired by Basel III.
Observing these premises, the regulatory capital will be calculated having the parameters required by the BCBS in 2019 as a basis, exposed in item 2.2, and a con-clusion may be drawn about its sufficiency.
An intentional sample of 58 Brazilian banks, whose data were obtained from the information system Banks-cope was used. The institutions were selected having the following criteria as a basis: active banks, located in Bra-zil, classified as commercial banks or government credit institutions, and having the balance sheet available in 2012. This selection provided 78 banks, out of which 58 had sufficient information to carrying out the analysis. This intentional sample is representative, because the institutions included account for about 80% of the total assets of the Brazilian National Financial System. The data obtained from this system refer to the sum of RWA, Tier 1 Capital, Total Regulatory Capital, hybrid instru-ments of capital and debt, and subordinated debt. Based on the new rule’s criteria, the Common Equity, Additio-nal Tier 1, and Tier 2 Capital will be calculated.
As the Bankscope system does not indicate the values of subordinated debt and hybrid instruments that have perpetuity as a characteristic, these data were surveyed in the Quarterly Financial Reports of the BACEN, Re-port 7027, on the site of this government institution. The portion of these instruments having no maturity date was regarded as Additional Tier 1 Capital; the rest, with defined maturity, was regarded as Tier 2 Capital.
The numbers of Bankscope and the BACEN, regar-ding the subordinated debt and hybrid instruments, were reconciled. When there was a difference, the case of the BACEN, the total amount pointed out by Banks-cope prevailed, but having a division between Additional Tier 1 and Tier 2 Capital, according to the proportion of perpetual instruments indicated by the BACEN.
When it was not possible to highlight the Additional Tier 1 Capital, the case of the Brazilian National Bank for Economic and Social Development (BNDES), all capital classified as Tier 1 was regarded as Common Equity.
Since the calculation of regulatory capital might re-quire access to information not available in the publi-shed balance sheets, the procedure adopted leads to an indicative more optimistic than the actual value. Thus, a limitation of this analysis is the impossibility to inves-tigate the prudential adjustments to regulatory capital,
as it would require knowing the nature of tax credits of each bank and analyzing its corporate structures to iden-tify unconsolidated shareholding, minority sharehol-ding, cross-shareholsharehol-ding, and others.
The second analysis concerns the comparison betwe-en the cost of equity and the return on equity of insti-tutions. The average ROE recorded in 2010, 2011, and 2012 was considered.
The KE value was obtained through a variant of the capital asset pricing model (CAPM), named internatio-nal capital asset pricing model (ICAPM), by Adler and Solnik (1974). The reason to have passed over the CAPM results stems from the incipient risk premium calculated for the Brazilian market, as a result of poor performance of the Securities, Commodities, and Futures Exchange (BM&FBOVESPA) in recent years, something which would undervalue KE in the sector.
Hope in the return of an asset, through ICAPM, is provided by Equation 1:
1
Where:
is the return on “i” stock traded in the stock exchange “k”; in this case, BM&BOVESPA.
is the global market risk free rate, considering the Standard & Poor’s 500 (S&P 500).
is the return on the asset free from global risk, considering the 10-year U.S. Treasuries.
is the beta of the asset “i” with regard to the index “k”; in this case, the BOVESPA Index (IBOVESPA).
is the beta of the index “k” with regard to the global market.
is the sovereign risk premium, measured by the EMBI+ Brazil.
The
was obtained through the average of the 10-year yield to maturity dos U.S.Treasury Bonds set betwe-en 2003 and 2012; the
was based on the daily returns of the theoretical stock portfolio of the Brazilian banks from 2008 to 2012, having the IBOVESPA as regressor and the stock returns of banks as a dependent variable; the
is the beta of the IBOVESPA regressed by the S&P 500 and calculated based on monthly returns from 1990 to 2012 as a basis; the
was based on the average of annual returns of the S&P 500 within the last 10 years (2003 to 2012); and as
we adopted the ave-rage EMBI+ Brazil. We preferred to limit to 5 years the series used by the EMBI+ Brazil, in order to avoid the period before the country risk was reclassified as invest-ment grade.
parts of the shares of ITAÚ UBB ON, BRADESCO ON, and BANCO DO BRASIL ON, adjusted on a daily basis.
he resulting KE, expressed in nominal dollars, was ad-justed to the Brazilian inlation; to do this, it was delated by the geometric average of the consumer price index (CPI), from the United States, in 2010, 2011, and 2012. Subsequen-tly, we added the geometric average of the national broad consumer price index (IPCA), within the same period, pro-ducing a nominal KE in reais, something which will enable a direct comparison with the average return of banks.
As limitations of this analysis, we considered that the capital cost is the same for all institutions, i.e. we
disre-garded the size effect, studied by Banz (1981), and later by Fama and French (1992). Also, we did not take into account the non-diversified risk of each institution, ari-sing from its peculiarities.
It is also worth noticing that the adoption of diferent periodicities when calculating the parameters used is ano-ther limitation of this analysis. his fact was motivated by the efect of the economic cycles in Brazil and in the United States regarding the beta value, the market premiums, the rate free from risk, and the country risk. hese periodicities also difer from the average ROE calculation period, which considered three years to relect the recent history.
4 ANALYSIS OF THE NEED FOR ADJUSTMENT TO THE REGULATORY CAPITAL
Table 2 represents a first analysis, with the descripti-ve statistics of the consolidated regulatory capital of the banks analyzed in 2012.
Table 3 displays data on the regulatory capital of the banks analyzed, based on the financial statements
of 2012, within the existing rules so far. All banks were complying, as they showed a Basel Index over 11%.
Table 3 Regulatory capital of the banks analyzed – base: December 2012 (in R$ million)
(cont.)
Mean Median Standard deviation Maximum Minimum
Tier 1 Capital / RWA 16.54% 14.56% 9.79% 61.10% 6.62%
Total Capital / RWA 18.54% 15.80% 8.98% 61.10% 11.68%
Source: Prepared by the authors.
Table 2 Descriptive statistics – regulatory capital in 2012 (%)
Bank Risk-weighted
assets
Tier 1 Capital Total Regulatory Capital
Hybrid instruments
Subordinated debt
Tier 1 Capital / RWA (%)
Total Capital / RWA (%)
Banco do Brasil 727,590 76,769 107,925 3,743 51,994 10.55 14.83
Itaú Unibanco 655,215 71,418 109,421 0 38,099 10.90 16.70
Bradesco 597,886 65,887 96,754 0 34,852 11.02 16.17
BNDES 582,214 48,633 89,599 0 155,325 8.35 15.39
CEF 433,691 28,690 56,329 0 40,644 6.62 12.99
Santander 337,500 65,200 70,300 0 11,900 10.32 20.80
HSBC 92,216 9,737 12,376 0 3,880 10.56 13.42
Votorantim 84,641 7,875 12,111 0 6,991 9.30 14.30
BTG Pactual 84,303 10,250 14,594 0 6,246 12.16 17.30
Safra 68,942 6,824 9,629 0 2,657 9.90 14.00
Citibank 51,767 7,812 7,812 0 0 15.09 15.09
Itaú BBA 37,624 6,283 6,283 0 0 16.70 16.70
Bank Risk-weighted assets
Tier 1 Capital Total Regulatory Capital
Hybrid instruments
Subordinated debt
Tier 1 Capital / RWA (%)
Total Capital / RWA (%)
BMG 32,234 2,508 3,693 0 1,226 8.05 11.85
Banco do Nordeste 30,601 2,611 5,184 0 2,535 8.53 16.94
Volkswagen 21,749 2,046 3,012 0 1,613 9.41 13.43
JP Morgan 20,919 3,494 3,494 0 0 16.70 16.70
Banco Industrial e Comercial (BICBanco)
18,685 1,959 2,915 0 947 10.60 15.80
Panamericano 16,608 1,270 1,904 0 1,195 7.79 11.68
Banco da Amazônia 13,132 1,946 2,011 0 0 14.82 15.31
Rabobank 12,967 1,052 1,990 0 939 8.11 15.35
Banco Daycoval 12,665 2,198 2,204 0 0 17.40 17.40
Deutsche Bank 11,563 1,499 1,499 0 0 12.96 12.96
Mercedes-Benz 10,929 1,172 1,395 0 223 10.73 12.77
Mercantil Brasil 10,163 839 1,258 0 622 8.26 12.38
GMAC 9,806 1,207 1,207 0 0 13.09 13.09
Fibra 9,411 873 1,246 0 373 9.28 13.20
Pine 9,218 1,220 1,478 0 317 13.37 16.19
BRDE 8,436 1,336 1,336 0 0 15.84 15.84
BNG 5,921 936 936 0 0 15.80 15.80
Société Générale 5,760 698 698 0 0 11.96 11.96
Paraná Banco 4,484 1,215 1,215 0 0 27.08 27.08
Intercap 4,467 687 684 0 0 15.37 15.31
CNH Capital 4,294 990 990 0 0 23.05 23.05
Bonsucesso 4,079 380 569 0 219 10.12 15.18
Indusval 3,912 586 582 0 0 14.81 14.91
Crédit Agricole 3,260 757 778 0 21 23.22 23.85
Fidis 3,143 480 483 0 0 15.28 15.38
Soisa 3,142 781 780 0 0 24.86 24.83
BDMG 3,070 1,460 1,070 0 0 47.55 34.85
John Deere 2,713 450 450 0 115 16.60 16.60
Industrial Brasil 2,615 442 467 0 31 16.90 17.86
Rodobens 2,494 357 357 0 0 14.31 14.31
Sumitomo Mitsui 2,422 642 724 0 82 26.49 26.49
Estado de Sergipe 2,242 295 353 0 96 13.18 15.73
Estado do Pará 2,023 420 420 0 20.76 20.75
Tribanco 1,806 335 335 0 0 18.56 18.56
Tokyo Mitsubishi 1,795 1,097 1,097 0 0 61.10 61.10
Fator 1,742 429 429 0 0 24.62 24.62
Caixa Geral 1,633 474 474 0 0 29.06 29.06
Cacique 1,412 169 169 0 0 11.96 11.96
Intermedium 1,335 274 274 0 0 22.75 22.75
Ford 1,310 270 270 0 0 20.60 20.60
Rendimento 1,153 177 177 0 0 15.39 15.39
Pecúnia 810 97 97 0 0 11.96 11.96
BANDES 798 160 160 0 0 20.00 20.00
Negresco 209 25 25 0 0 12.37 12.37
BPN Brasil 123 52 69 0 16 42.37 55.73
Total 4,109,229 452,620 650,137 3,743 364,316 11.01 15.82
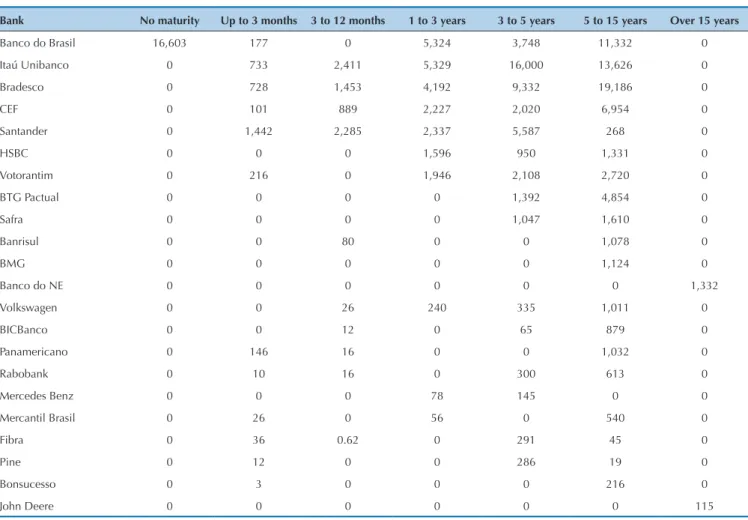
Tables 4 and 5 display the maturities of the subordi-nated debts and hybrid instruments of the banks under study. BNDES was not included, due to unavailability of
its Quarterly Financial Statements on the BACEN web-site.
Table 4 Subordinated debt of the banks analyzed – base: December 2012 (in R$ thousand)
We examined the footnotes to the inancial statements for December 2012 from BNDES, where it classiied as hybrid instruments the contributions by the Brazilian National Tre-asury Secretariat and as subordinated debt the resources from the Worker’s Support Fund (FAT) with no maturity date.
Except for the Banco do Brasil and BNDES, which have hybrid instruments and subordinated debt that can
be classified as Additional Tier I Capital, in the other banks these liabilities are eligible only at Tier 2 Capital, as it has a maturity date set.
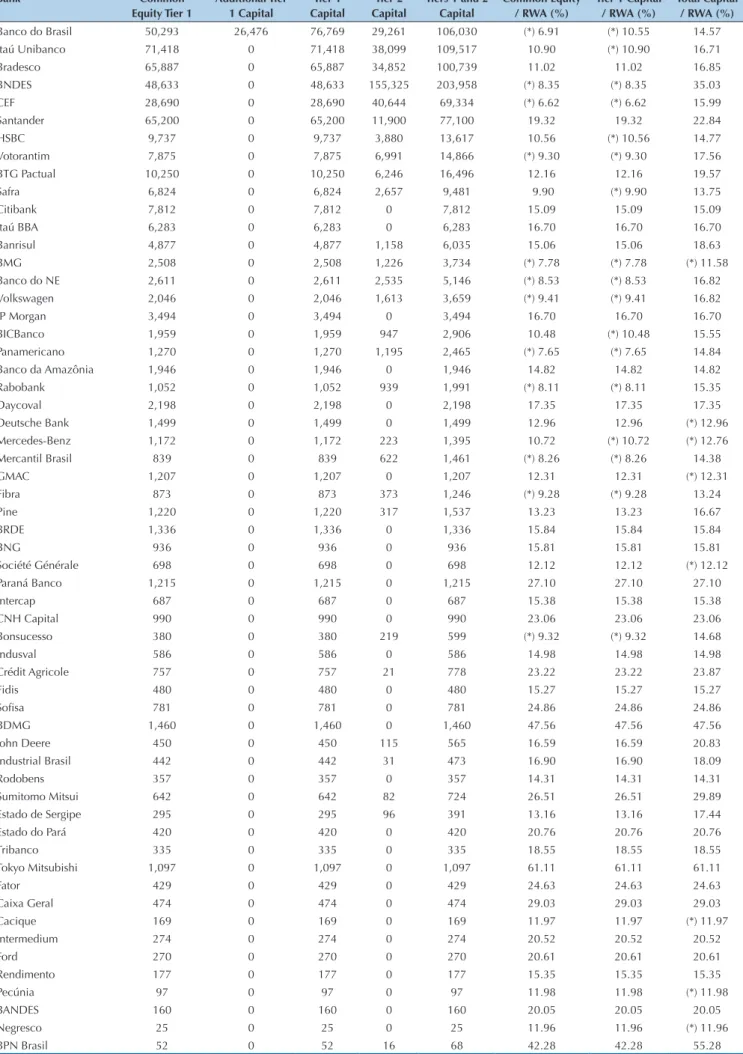
Table 6 displays the situation of the regulatory capital of banks, hypothetically assuming that the requirement in the end of the transitional period (2019) should alre-ady be complied with in 2013.
Bank No maturity Up to 3 months 3 to 12 months 1 to 3 years 3 to 5 years 5 to 15 years Over 15 years
Banco do Brasil 16,603 177 0 5,324 3,748 11,332 0
Itaú Unibanco 0 733 2,411 5,329 16,000 13,626 0
Bradesco 0 728 1,453 4,192 9,332 19,186 0
CEF 0 101 889 2,227 2,020 6,954 0
Santander 0 1,442 2,285 2,337 5,587 268 0
HSBC 0 0 0 1,596 950 1,331 0
Votorantim 0 216 0 1,946 2,108 2,720 0
BTG Pactual 0 0 0 0 1,392 4,854 0
Safra 0 0 0 0 1,047 1,610 0
Banrisul 0 0 80 0 0 1,078 0
BMG 0 0 0 0 0 1,124 0
Banco do NE 0 0 0 0 0 0 1,332
Volkswagen 0 0 26 240 335 1,011 0
BICBanco 0 0 12 0 65 879 0
Panamericano 0 146 16 0 0 1,032 0
Rabobank 0 10 16 0 300 613 0
Mercedes Benz 0 0 0 78 145 0 0
Mercantil Brasil 0 26 0 56 0 540 0
Fibra 0 36 0.62 0 291 45 0
Pine 0 12 0 0 286 19 0
Bonsucesso 0 3 0 0 0 216 0
John Deere 0 0 0 0 0 0 115
Source: Prepared by the authors.
Table 5 Hybrid capital and debt instruments – base: December 2012 (in R$ thousand)
Bank No maturity Up to 3 months 3 to 12 months 1 to 3 years 3 to 5 years 5 to 15 years
Over 15 years
Banco do Brasil 8,215 230 0 0 0 6,618 0
CEF 0 0 0 0 0 28,453 0
Banco do NE 0 0 74 0 0 0 1,128
(*) It shows noncompliance with the new regulatory capital, 9.50% of RWA for Common Equity, 11.0% for Tier 1 Capital, and 13% for Total Capital. Source: Prepared by the authors.
Table 6 Adjustments to the capital base of the banks analyzed (in R$ million)
Bank Common
Equity Tier 1
Additional Tier 1 Capital
Tier 1 Capital
Tier 2 Capital
Tiers 1 and 2 Capital
Common Equity / RWA (%)
Tier 1 Capital / RWA (%)
Total Capital / RWA (%)
Banco do Brasil 50,293 26,476 76,769 29,261 106,030 (*) 6.91 (*) 10.55 14.57
Itaú Unibanco 71,418 0 71,418 38,099 109,517 10.90 (*) 10.90 16.71
Bradesco 65,887 0 65,887 34,852 100,739 11.02 11.02 16.85
BNDES 48,633 0 48,633 155,325 203,958 (*) 8.35 (*) 8.35 35.03
CEF 28,690 0 28,690 40,644 69,334 (*) 6.62 (*) 6.62 15.99
Santander 65,200 0 65,200 11,900 77,100 19.32 19.32 22.84
HSBC 9,737 0 9,737 3,880 13,617 10.56 (*) 10.56 14.77
Votorantim 7,875 0 7,875 6,991 14,866 (*) 9.30 (*) 9.30 17.56
BTG Pactual 10,250 0 10,250 6,246 16,496 12.16 12.16 19.57
Safra 6,824 0 6,824 2,657 9,481 9.90 (*) 9.90 13.75
Citibank 7,812 0 7,812 0 7,812 15.09 15.09 15.09
Itaú BBA 6,283 0 6,283 0 6,283 16.70 16.70 16.70
Banrisul 4,877 0 4,877 1,158 6,035 15.06 15.06 18.63
BMG 2,508 0 2,508 1,226 3,734 (*) 7.78 (*) 7.78 (*) 11.58
Banco do NE 2,611 0 2,611 2,535 5,146 (*) 8.53 (*) 8.53 16.82
Volkswagen 2,046 0 2,046 1,613 3,659 (*) 9.41 (*) 9.41 16.82
JP Morgan 3,494 0 3,494 0 3,494 16.70 16.70 16.70
BICBanco 1,959 0 1,959 947 2,906 10.48 (*) 10.48 15.55
Panamericano 1,270 0 1,270 1,195 2,465 (*) 7.65 (*) 7.65 14.84
Banco da Amazônia 1,946 0 1,946 0 1,946 14.82 14.82 14.82
Rabobank 1,052 0 1,052 939 1,991 (*) 8.11 (*) 8.11 15.35
Daycoval 2,198 0 2,198 0 2,198 17.35 17.35 17.35
Deutsche Bank 1,499 0 1,499 0 1,499 12.96 12.96 (*) 12.96
Mercedes-Benz 1,172 0 1,172 223 1,395 10.72 (*) 10.72 (*) 12.76
Mercantil Brasil 839 0 839 622 1,461 (*) 8.26 (*) 8.26 14.38
GMAC 1,207 0 1,207 0 1,207 12.31 12.31 (*) 12.31
Fibra 873 0 873 373 1,246 (*) 9.28 (*) 9.28 13.24
Pine 1,220 0 1,220 317 1,537 13.23 13.23 16.67
BRDE 1,336 0 1,336 0 1,336 15.84 15.84 15.84
BNG 936 0 936 0 936 15.81 15.81 15.81
Société Générale 698 0 698 0 698 12.12 12.12 (*) 12.12
Paraná Banco 1,215 0 1,215 0 1,215 27.10 27.10 27.10
Intercap 687 0 687 0 687 15.38 15.38 15.38
CNH Capital 990 0 990 0 990 23.06 23.06 23.06
Bonsucesso 380 0 380 219 599 (*) 9.32 (*) 9.32 14.68
Indusval 586 0 586 0 586 14.98 14.98 14.98
Crédit Agricole 757 0 757 21 778 23.22 23.22 23.87
Fidis 480 0 480 0 480 15.27 15.27 15.27
Soisa 781 0 781 0 781 24.86 24.86 24.86
BDMG 1,460 0 1,460 0 1,460 47.56 47.56 47.56
John Deere 450 0 450 115 565 16.59 16.59 20.83
Industrial Brasil 442 0 442 31 473 16.90 16.90 18.09
Rodobens 357 0 357 0 357 14.31 14.31 14.31
Sumitomo Mitsui 642 0 642 82 724 26.51 26.51 29.89
Estado de Sergipe 295 0 295 96 391 13.16 13.16 17.44
Estado do Pará 420 0 420 0 420 20.76 20.76 20.76
Tribanco 335 0 335 0 335 18.55 18.55 18.55
Tokyo Mitsubishi 1,097 0 1,097 0 1,097 61.11 61.11 61.11
Fator 429 0 429 0 429 24.63 24.63 24.63
Caixa Geral 474 0 474 0 474 29.03 29.03 29.03
Cacique 169 0 169 0 169 11.97 11.97 (*) 11.97
Intermedium 274 0 274 0 274 20.52 20.52 20.52
Ford 270 0 270 0 270 20.61 20.61 20.61
Rendimento 177 0 177 0 177 15.35 15.35 15.35
Pecúnia 97 0 97 0 97 11.98 11.98 (*) 11.98
BANDES 160 0 160 0 160 20.05 20.05 20.05
Negresco 25 0 25 0 25 11.96 11.96 (*) 11.96
The new regulatory capital might make that 23 out of the 58 banks analyzed became noncompliant in some way. In 12 situations there is deficiency in Common Equity; in 17 cases, Tier 1 Capital was not sufficient; and 8 times, Total Capital (Tier 1 + Tier 2) did not meet the standards.
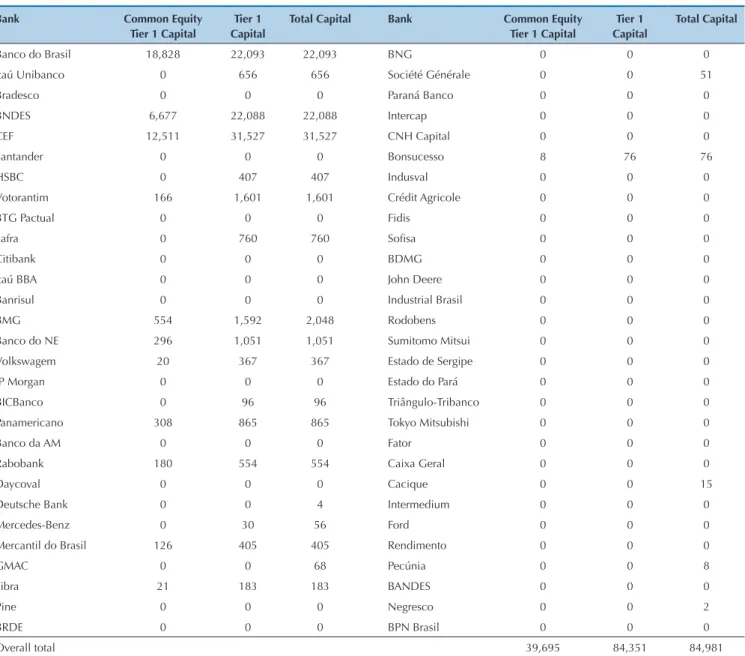
Table 7 displays the institutions’ capital deficiency. The Common Equity deficiency sum corresponds to R$ 39 billion; Tier 1 Capital amounts to a total of R$ 84 billion; and Total Capital, R$ 85 billion. These deficien-cies are cumulative. We notice that most of this value stems from public banks.
From the above, it is seen that the strategy adopted by many banks, complying with regulatory capital through non-perpetual subordinated debt, has lost much of its effectiveness with the new Capital Accord, due to better quality of required capital.
It is worth emphasizing that the scenario introduced has taken into account that the capital required in 2019 was immediately required. he transition time for the new rules will lead banks to better plan their actions of capitalization.
One should also mention that the findings of this study differ from those contained in the Relatório de
es-tabilidade financeira (Banco Central do Brasil, 2013c, p. 32), stating that “there would be no need for extra Com-mon Equity Tier 1 Capital for the banking system as a whole until 2019, besides those values resulting from the current results retention practices”. This premise has not been considered in this article. In addition, the BACEN calculations regarded the “Common Equity as a rather fixed portion of the Additional Tier 1 Capital” (Banco Central do Brasil, 2013c, p. 32), seemingly without con-sidering countercyclical buffer, something which also differs from this study.
Bank Common Equity
Tier 1 Capital
Tier 1 Capital
Total Capital Bank Common Equity
Tier 1 Capital
Tier 1 Capital
Total Capital
Banco do Brasil 18,828 22,093 22,093 BNG 0 0 0
Itaú Unibanco 0 656 656 Société Générale 0 0 51
Bradesco 0 0 0 Paraná Banco 0 0 0
BNDES 6,677 22,088 22,088 Intercap 0 0 0
CEF 12,511 31,527 31,527 CNH Capital 0 0 0
Santander 0 0 0 Bonsucesso 8 76 76
HSBC 0 407 407 Indusval 0 0 0
Votorantim 166 1,601 1,601 Crédit Agricole 0 0 0
BTG Pactual 0 0 0 Fidis 0 0 0
Safra 0 760 760 Soisa 0 0 0
Citibank 0 0 0 BDMG 0 0 0
Itaú BBA 0 0 0 John Deere 0 0 0
Banrisul 0 0 0 Industrial Brasil 0 0 0
BMG 554 1,592 2,048 Rodobens 0 0 0
Banco do NE 296 1,051 1,051 Sumitomo Mitsui 0 0 0
Volkswagem 20 367 367 Estado de Sergipe 0 0 0
JP Morgan 0 0 0 Estado do Pará 0 0 0
BICBanco 0 96 96 Triângulo-Tribanco 0 0 0
Panamericano 308 865 865 Tokyo Mitsubishi 0 0 0
Banco da AM 0 0 0 Fator 0 0 0
Rabobank 180 554 554 Caixa Geral 0 0 0
Daycoval 0 0 0 Cacique 0 0 15
Deutsche Bank 0 0 4 Intermedium 0 0 0
Mercedes-Benz 0 30 56 Ford 0 0 0
Mercantil do Brasil 126 405 405 Rendimento 0 0 0
GMAC 0 0 68 Pecúnia 0 0 8
Fibra 21 183 183 BANDES 0 0 0
Pine 0 0 0 Negresco 0 0 2
BRDE 0 0 0 BPN Brasil 0 0 0
Overall total 39,695 84,351 84,981
Table 7 Banks’ capital deficiency (in R$ million)
Capital deficiency in 23 banks raises, therefore, the question: are they able to attract new capital? Thus, the second analysis concerns the comparison between the capital cost and the return of the banks under study.
A bank whose return is lower than the cost of equity in the sector has a poor ability to attract new investments and this will represent vulnerability, if this bank has
regu-latory capital deiciency.
Initially, the cost of equity was obtained. Beta values calculated for the stocks of Itaú Unibanco, Bradesco, and Banco do Brasil were 0.7242, 0.8528, and 1.0293, respec-tively, resulting in a beta value for the portfolio equal to 0.8687. The resulting KE was 15.56% p.a. Its calculation is displayed in Table 8.
5 CAPITAL COST AND BANKS’ CAPACITY TO ATTRACT NEW INVESTORS
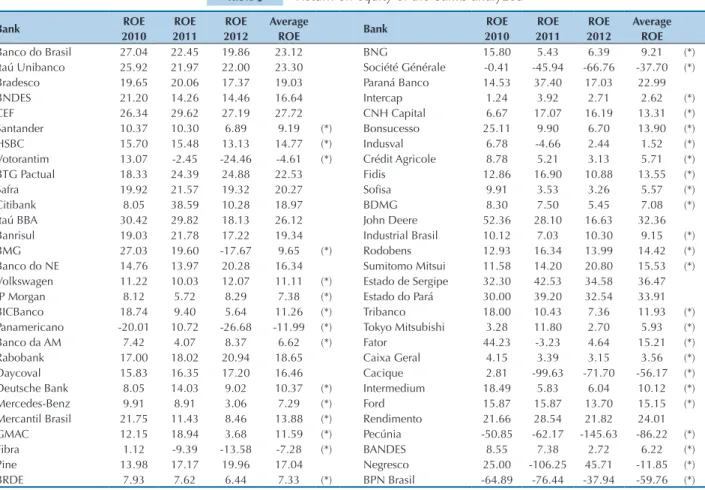
Determining KE, it is possible to compare it to the average ROE of the banks analyzed (Table 9).
Out of the 58 banks analyzed, 39 had an average ROE lower than the cost of equity.
KE components Notation Value
Beta of the banks’ portfolio vs. IBOVESPA
0.8687
Beta of IBOVESPA vs. S&P 500
1.2371
Market risk (S&P 500)
8.71%
Rate free from risk (UST 10y)
3.46%
Risk premium
5.25%
Country risk (EMBI+ Brazil, in base points)
232
KE (nominal, in US$)
11.43%
CPI (geometric mean 2010, 2011, and 2012) 2.29%
IPCA (geometric mean 2010, 2011, and 2012) 6.08%
KE (nominal, in R$) 15.56%
Note: For purposes of comparison, KE value calculated through local data by means of the traditional CAPM by Sharpe (1964), using the risk premium of 6.50% by
Fernandez, Aguirreamalloa and Linares (2013), sector beta of 0.8687 and free rate of 10.04% p.a. (average SELIC rate of 2010, 2011, and 2012), was 15.69%, a value compatible with the KE obtained by means of the ICAPM.
Source: Prepared by the authors.
Table 8 KE calculation
Bank ROE
2010
ROE 2011
ROE 2012
Average
ROE Bank
ROE 2010
ROE 2011
ROE 2012
Average ROE
Banco do Brasil 27.04 22.45 19.86 23.12 BNG 15.80 5.43 6.39 9.21 (*)
Itaú Unibanco 25.92 21.97 22.00 23.30 Société Générale -0.41 -45.94 -66.76 -37.70 (*)
Bradesco 19.65 20.06 17.37 19.03 Paraná Banco 14.53 37.40 17.03 22.99
BNDES 21.20 14.26 14.46 16.64 Intercap 1.24 3.92 2.71 2.62 (*)
CEF 26.34 29.62 27.19 27.72 CNH Capital 6.67 17.07 16.19 13.31 (*)
Santander 10.37 10.30 6.89 9.19 (*) Bonsucesso 25.11 9.90 6.70 13.90 (*)
HSBC 15.70 15.48 13.13 14.77 (*) Indusval 6.78 -4.66 2.44 1.52 (*)
Votorantim 13.07 -2.45 -24.46 -4.61 (*) Crédit Agricole 8.78 5.21 3.13 5.71 (*)
BTG Pactual 18.33 24.39 24.88 22.53 Fidis 12.86 16.90 10.88 13.55 (*)
Safra 19.92 21.57 19.32 20.27 Soisa 9.91 3.53 3.26 5.57 (*)
Citibank 8.05 38.59 10.28 18.97 BDMG 8.30 7.50 5.45 7.08 (*)
Itaú BBA 30.42 29.82 18.13 26.12 John Deere 52.36 28.10 16.63 32.36
Banrisul 19.03 21.78 17.22 19.34 Industrial Brasil 10.12 7.03 10.30 9.15 (*)
BMG 27.03 19.60 -17.67 9.65 (*) Rodobens 12.93 16.34 13.99 14.42 (*)
Banco do NE 14.76 13.97 20.28 16.34 Sumitomo Mitsui 11.58 14.20 20.80 15.53 (*)
Volkswagen 11.22 10.03 12.07 11.11 (*) Estado de Sergipe 32.30 42.53 34.58 36.47
JP Morgan 8.12 5.72 8.29 7.38 (*) Estado do Pará 30.00 39.20 32.54 33.91
BICBanco 18.74 9.40 5.64 11.26 (*) Tribanco 18.00 10.43 7.36 11.93 (*)
Panamericano -20.01 10.72 -26.68 -11.99 (*) Tokyo Mitsubishi 3.28 11.80 2.70 5.93 (*)
Banco da AM 7.42 4.07 8.37 6.62 (*) Fator 44.23 -3.23 4.64 15.21 (*)
Rabobank 17.00 18.02 20.94 18.65 Caixa Geral 4.15 3.39 3.15 3.56 (*)
Daycoval 15.83 16.35 17.20 16.46 Cacique 2.81 -99.63 -71.70 -56.17 (*)
Deutsche Bank 8.05 14.03 9.02 10.37 (*) Intermedium 18.49 5.83 6.04 10.12 (*)
Mercedes-Benz 9.91 8.91 3.06 7.29 (*) Ford 15.87 15.87 13.70 15.15 (*)
Mercantil Brasil 21.75 11.43 8.46 13.88 (*) Rendimento 21.66 28.54 21.82 24.01
GMAC 12.15 18.94 3.68 11.59 (*) Pecúnia -50.85 -62.17 -145.63 -86.22 (*)
Fibra 1.12 -9.39 -13.58 -7.28 (*) BANDES 8.55 7.38 2.72 6.22 (*)
Pine 13.98 17.17 19.96 17.04 Negresco 25.00 -106.25 45.71 -11.85 (*)
BRDE 7.93 7.62 6.44 7.33 (*) BPN Brasil -64.89 -76.44 -37.94 -59.76 (*)
(*) It has an average ROE below KE.
Source: Prepared by the authors.
The analysis of market structure through the varia-bles chosen – regulatory capital sufficiency and
sha-reholder return – enables identifying four possible sce-narios, as shown in Figure 1.
6 JOINT ANALYSIS OF RESULTS
In fact, by identifying in the quadrants the relative po-sition of a bank, we may argue about its probable courses of action, anticipating measures or strategies, in order to keep it in Quadrant I, or reposition it there over time.
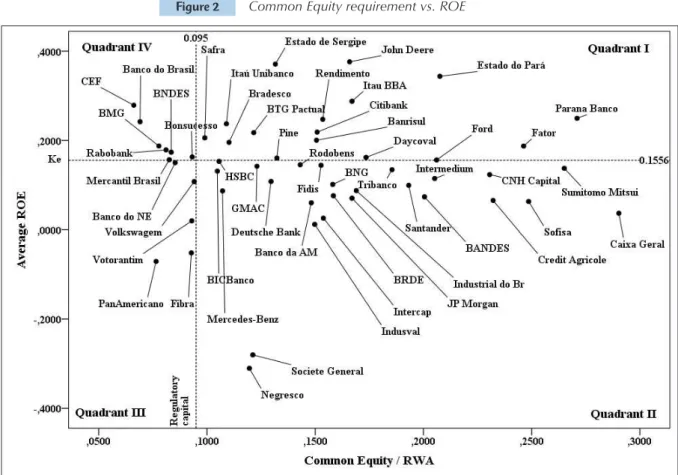
Figure 2 summarizes the banks’ situation in relation to
the Common Equity Tier 1 Capital framework and its ca-pacity to attract capital. Two dotted lines were drawn: one horizontal, representing the cost of equity of 15.56% p.a.; and another vertical one, indicating the Common Equity Capital requirement of 9.5%, which deine the quadrants of Figure 1.
Banks located in Quadrant I have suicient regulatory ca-pital to meet the new rules and they have shown an adequate return to its shareholders, therefore, it is enjoying a
comforta-ble situation. hese banks are in this situation: Bradesco, Itaú Unibanco, Itaú BBA, BTG Pactual, Citibank, and Safra, among others, and in a borderline situation, regarding return, HSBC. Quadrant IV
Regulatory capital insuficiency
Returns higher than the cost of capital
Quadrant I
Regulatory capital suficiency
Returns higher than the cost of capital
Quadrant III
Regulatory capital insuficiency
Returns lower than the cost of capital
Quadrant II
Regulatory capital suficiency
Returns lower than the cost of capital
Source: Prepared by the authors.
Figure 1 Summary of the market structure
Figure 2 Common Equity requirement vs. ROE
Note: Banks with extreme numbers were excluded from the figure, in order to provide better visualization. Source: Prepared by the authors.
Banks located in Quadrant II have suicient capital to meet the new Capital Accord; however, these institutions have shown a return on equity lower than the cost of equity. Among them there are Santander, Soisa, Indusval; two pu-blic banks, BRDE and Banco da Amazônia; and some foreign banks, such as JP Morgan, Société Générale, and Deutsche Bank. hese institutions should undertake adjustments, not in their capital structure, but concerning the eiciency of their operations. It is up to each institution to think through the causes of low proitability.
Banks located in Quadrant IV should make adjustments to their capital structure, in order to comply with the new rules. hese institutions have shown superior returns in comparison to their cost of equity, something which provides them with credibility to go to the capital market and attract investments. he three largest Brazilian federal banks (Banco do Brasil, BNDES, and Caixa Econômica Federal) are in this quadrant and they should have no trouble to raise their capital. Howe-ver, some institutions, such as Bonsucesso and Mercantil do Brasil, are in borderline position between quadrants III and IV and they may have some diiculty in attracting investors.
Banks located in Quadrant III are undergoing the most vulnerable situation, because they need to increase their re-gulatory capital and their returns are lower than the cost of equity, having no way to attract investors. hese institutions must take immediate action, such as raising the retention of proits and reviewing operational and business processes, in order to increase their proitability and ofer themselves, in the future, as investment alternatives. he transition period for the new rule provides some breath, albeit limited, for the-se adjustments to be adopted; otherwithe-se, the alterative shall be decrease their asset portfolio. he banks located in this quadrant are Panamericano, Fibra, and Votorantim.
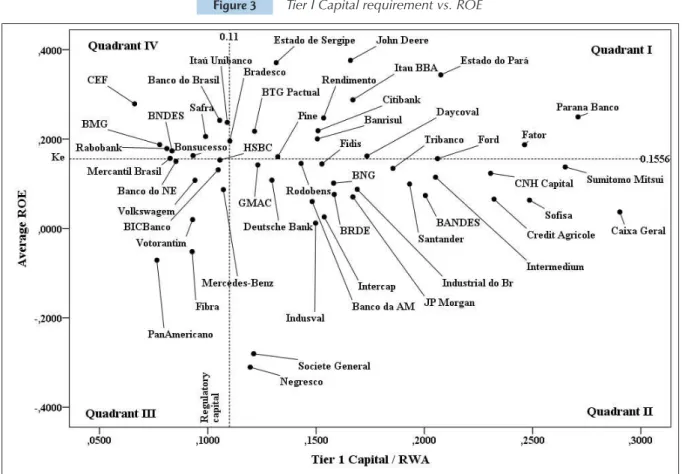
Figure 3 is similar to Figure 2, but it displays the com-pliance with the to Tier 1 Capital. In this analysis, the regu-latory capital is 11% of RWA. he indings in these igures are similar. It is worth noticing that some institutions mi-grate from Quadrant I to Quadrant IV, such as the bank Safra. Others, such as Bradesco and Itaú Unibanco, come to stand in borderline position between these quarters. In ge-neral, all institutions see their regulatory capital deiciency increase.
Concerning public banks, it is worth noticing that, ba-sed on the numbers in Table 3, Banco do Brasil maintained a ratio between Tier 1 Capital and Total Capital around 71%, against 51% of Caixa Econômica Federal and 54% of BNDES. In addition, almost 50% of Banco do Brasil’s funding in hybrid
instruments and subordinated debt do not have a maturity date, making them eligible for Additional Tier 1 Capital. his leads Banco do Brasil to enjoy a more comfortable position than Caixa Econômica Federal and BNDES regarding Tier 1 Capital. he three banks are located in Quadrant III.
Figure 3 Tier I Capital requirement vs. ROE
he role played by public banks to put into practice countercyclical policies, providing credit in times of econo-mic downturn (De Paula, Oreiro, & Basílio, 2014) should be noticed. It is expected that this work is impaired until these banks became able to comply with the Basel III rules.
If the equity and debt instruments capable of adapta-tion as Addiadapta-tional Tier 1 Capital do not have liquidity in the market, there will remain to the institutions the choi-ce of meeting the entire requirement of Tier 1 Capital by issuing ordinary shares. This is a very feasible considera-tion, as securities with perpetuity features are not traded in the local market, in addition to stocks. Figure 3 was
drawn through this assumption, by admitting that the institutions should issue shares to meet the entire Tier 1 Capital requirement.
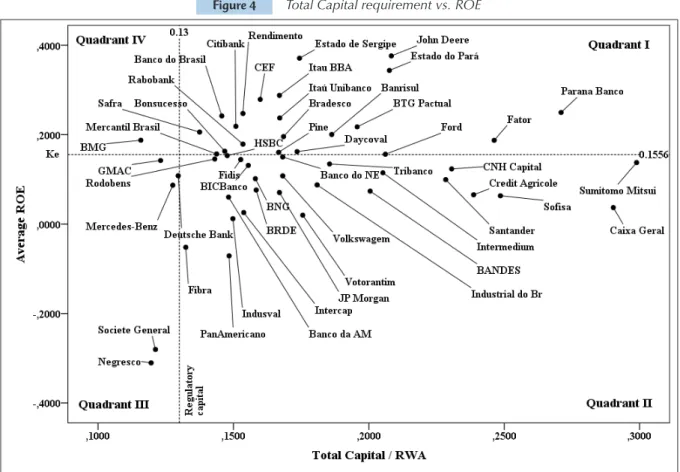
Figure 4 displays the framework of Total Capital. The ROE information, in this case, loses relevance, because part of a potential deficiency in this regard may be su-pplied with hybrid instruments and subordinated debt, with a return different from that of equity. It may be no-ticed that the number of institutions in compliance is much larger (quadrants I and II), including major public banks. This seemingly comfortable situation stems from subordinate debt stocks in the banks’ balance sheet.
The new Basel Accord has introduced significant changes regarding the quality of bank capital, in addi-tion to the capital conservaaddi-tion buffer and countercycli-cal buffer, also providing flexible instruments to central banks in order to reduce the capital required in times of economic downturn. The new agreement will represent a challenge for many Brazilian banks, which should be capitalized to meet the new standards. Among them the-re athe-re the biggest public banks.
he simulation model adopted has started from the pre-mise that risk exposures might remain constant over time. However, one cannot disregard the fact that the indebted-ness of the private sector has grown over the years, as a re-sult of the policy adopted by the Federal Government to
stimulate consumption through credit. hus, there might be pressure on inancial institutions in order to increase their regulatory capital even further. his consideration opens up the opportunity for further studies, which shall contribute to the reconciliation between the policy to sti-mulate consumption and the capital adequacy standards.
In contrast, banks have a habit not to distribute their entire outcome to shareholders. The incorporation of a portion of the profits to equity will cause some banks do adapt without taking more drastic measures. This aspect may raise further studies on the effects of the dividend distribution policy on the banks’ capital adequacy.
Given these considerations, there are several possible actions. The first consists in increasing capital by issuing
7 CONCLUSIONS
Figure 4 Total Capital requirement vs. ROE
Note: Banks with extreme numbers were excluded from the figure, in order to provide better visualization. Source: Prepared by the authors.
new stocks; this measure, however, may bump in the institution’s inability to generate attractive return rates. It follows that, in addition to the capitalization action, some banks will seek greater profitability in their opera-tions. These actions include, at the revenue side, hiring assets that have a more favorable ratio return vs. econo-mic capital and the direction of focus for the market seg-ments in which the institution enjoys better conditions for competitiveness. On the expenditure side, they shall seek greater efficiency in their operations.
he new Capital Accord may trigger a new round of acquisitions of smaller banks by big banks whose capita-lization capacity is signiicantly higher than that of small and medium-sized institutions. he merger of smaller institutions may not be the solution, because two non-compliant institutions will hardly result in a non-compliant institution. However, a merger can provide economies in scale and produce returns that enable issuing new stocks.
A solution adopted by smaller institutions in liqui-dity constraint times has been securitization. However, it should be taken into account that BACEN has rules that reduce the effectiveness of this solution, especially when there is not a significant risk transfer. This subject
is addressed by Resolution CMN 3,533 (Banco Central do Brasil, 2008). So, securitization may be a short-ran-ge solution. Another sugshort-ran-gestion for further research is developing models that equate the problem of partial transfer of risks through securitization, in order to sug-gest improvements to this standard.
Small and medium-sized banks will also seek new ways of operating. Thus, it is expected that smaller banks seek to develop relationships in order to syndi-cate their claims; others may sign operating agreements with big banks, which are dedicated to create operations with their sales channels by using the partner bank’s cre-dit standards, in order to transfer these assets to them. Thus, the smallest bank acquires features of a service provider from the bigger bank.
Adler, M., & Solnik, B. H. (1974). he international pricing of risk: an
empirical investigation of the world capital market structure. he
Journal of Finance, 29(2), 365-378.
Altunbas, Y., Liub, M.-H., Molyneuxc, P., & Seth, R. (2000). Eiciency
and risk in Japanese banking. Journal of Banking & Finance, 24(10),
1605-1628.
Arantes, T. M., & Rocha, B. P. (2012). Eiciência dos bancos brasileiros e os
impactos da crise inanceira global de 2008. In 40° Encontro Nacional
de Economia. Porto de Galinhas, PE. Recuperado de http://www. anpec.org.br/encontro/2012/inscricao/iles_I/i7-86ea8cbb7078fccc8ed 41b25bdde1887.pdf
Banco Central do Brasil. (2008). Resolução CMN n. 3.533. Brasília, DF: BACEN.
Banco Central do Brasil. (2013a). Resolução CMN n. 4.192. Brasília, DF: BACEN.
Banco Central do Brasil. (2013b). Resolução CMN n. 4.193. Brasília, DF: BACEN.
Banco Central do Brasil. (2013c). Relatório de estabilidade inanceira.
Brasília, DF: BACEN.
Banz, R. W. (1981). he relationship between return and market value of
common stocks. Journal of Financial Economics, 9(1), 3-18.
Basel Committee on Banking Supervision. (1988). International
convergence of capital measurement and capital standards. Basel: BCBS.
Basel Committee on Banking Supervision. (2005). International
convergence of capital measurement and capital standards: a revised framework. Basel: BCBS.
Basel Committee on Banking Supervision. (2011). A global regulatory
framework for more resilient banks and banking systems. Basel: BCBS. Basel Committee on Banking Supervision. (2012). Post-crisis evolution of
the banking sector (82nd Annual Report). Basel: BCBS. Brasil. (2013). Medida Provisória n. 608, de 28 de fevereiro de 2013.
Brasília, DF: Presidência da República.
Buch, C. M., & DeLong, G. (2008). Do weak supervisory systems
encourage bank risk-taking? Journal of Financial Stability, 4(1), 23-39.
Cohen, B. H. (2013, setembro). How have banks adjusted to higher capital
requirements? BIS Quarterly Review, 25-41.
De Paula, L. F., Oreiro, J. L., & Basílio, F. A. C. (2014). Estrutura do setor bancário e o ciclo recente de expansão do crédito: o papel dos bancos
públicos federais. Nova Economia, 23(3), 473-520.
Elliott, D., Salloy, S., & Santos, A. (2012). Assessing the cost of inancial regulation. Washington, DC: International Monetary Fund.
Fama, E. F., & French, K. R. (1992). he cross‐section of expected stock
returns. he Journal of Finance, 47(2), 427-465.
Fernandez, P., Aguirreamalloa, J., & Linares, P. (2013). Market risk
premium and risk free rate used for 51 countries in 2013: a survey with 6,237 answers. Madrid: IESE Business School.
Herrala, R. (2014). Forward-looking reaction to bank regulation (Working Paper Series n. 1645). Frankfurt: European Central Bank.
Klomp, J., & Haan, J. (2012). Banking risk and regulation: does one size it
all? Journal of Banking & Finance, 36(12), 3197-3212.
Laeven, L., & Levine, R. (2009). Bank governance, regulation and risk
taking. Journal of Financial Economics, 93(2), 259-275.
Miles, D., Yang, J., & Marcheggiano, G. (2013). Optimal bank capital. he
Economic Journal, 123(567), 1-37.
Nakane, M. I., & Weintraub, D. B. (2005). Bank privatization and
productivity: evidence for Brazil. Journal of Banking & Finance, 29(8),
2259-2289.
Reuters Brasil. (2013). BC estreia Basileia 3 e permite uso de crédito tributário. Retrieved from http://br.reuters.com/article/ domesticNews/idBRSPE92006X20130301
Ruiz, C., Tabak, B. M., & Cajueiro, D. O. (2008). Mensuração da eiciência bancária no Brasil: a inclusão de indicadores macroprudenciais.
Revista Brasileira de Finanças, 6(3), 411-436.
Sensarma, R. (2006). Are foreign banks always the best? Comparison of
state-owned, private and foreign banks in India. Economic Modelling,
23(4), 717-735.
Sharpe, W. F. (1964). Capital asset prices: a theory of market equilibrium
under conditions of risk. he Journal of Finance, 19(3), 425-442.
Silva, T. L., & Jorge Neto, P. M. (2002). Economia de escala e eiciência
nos bancos brasileiros após o Plano Real. Estudos Econômicos, 32(4),
577-619.
Slovik, P., & Cournède, B. (2011). Macroeconomic impact of Basel III (Working Papers Series n. 844). Paris: OECD.
Stiglitz, J. E., & Weiss, A. (1981). Credit rationing in markets with
imperfect information. he American Economic Review, 71(3),
393-410.
Tabak, B. M., Fazio, D. M., & Cajueiro, D. O. (2011). Proit, cost and scale eiciency for Latin American banks: concentration-performance relationship (Working Paper Series n. 244). Brasília, DF: Banco Central do Brasil.
Yan, M., Hall, M. J. B., & Turner, P. (2012). A cost-beneit analysis of Basel
III: some evidence from the UK. International Review of Financial
Analysis, 25(6), 73-82.
References
Correspondence Address:
Fernando Antonio Perrone Pinheiro
Fernando Antonio Perrone Pinheiro
Faculdade de Economia, Administração e Contabilidade, Universidade de São Paulo Avenida Professor Luciano Gualberto, 908 – CEP: 05508-010