Analysis of the Influence of Income Smoothing over Earnings
Persistence in the Brazilian Market*
Ana Carolina Kolozsvari
Universidade Federal do Rio de Janeiro, Faculdade de Administração e Ciências Contábeis, Programa de Pós-Graduação em Ciências Contábeis, Rio de Janeiro, RJ, Brazil
Marcelo Alvaro da Silva Macedo
Universidade Federal do Rio de Janeiro, Faculdade de Administração e Ciências Contábeis, Programa de Pós-Graduação em Ciências Contábeis, Rio de Janeiro, RJ, Brazil
Received on 09.25.2015 – Desk Acceptance on 10.04.2015 – 2nd version approved on 03.01.2016.
ABSTRACT
This study addresses the influence of income smoothing on earnings persistence in the Brazilian market. We argue that accounting choi-ces made by firms in order to report stability can affect the informational level of performance reported to the market, and thus affect its usefulness, particularly for company valuations and fund allocating decisions. The sample was set based on open companies listed on the BM&FBOVESPA between 2004 and 2013. The firms in the sample were separated into two groups with regards to the presence of income smoothing, based on the EM1 and EM2 metrics from Leuz, Nanda, and Wysocki (2003). We then inserted a multiplicative dummy variable into the basic persistence model, to assess the effect of smoothing on persistence. The results show increased transience in the time series, caused by the presence of income smoothing, which denotes that reported stability, conveyed via a series of smooth earnings, decreased the sustainability of reported performance, captured by persistence of the series. Additional controls show a negative influence of smoo-thing on persistence for small firms and when incurring losses, and a positive one for operations in sectors with accounting regulation. We conclude that, at least for the firms in the sample, reporting of constant performance resulted in a loss in the sustainability of income as a form of information on which investors, fund providers, and administrators base their decisions.
Keywords:earnings persistence, income smoothing, time-series properties of earnings, quality of accounting information.
2 THEORETICAL FRAMEWORK
1 INTRODUCTION
persistence in the Brazilian market.
Illustration of the inluence of smoothing over per-sistence is interesting because it develops the idea that accounting choices made by irms in order to report sta-bility can alter the informational level of performance reported to the market, afecting its usefulness for eva-luating company value. In the Brazilian case, as well as investors, there are other parties that are interested in performance, such as banks, important sources of fun-ding, and families, given their important role in company control. hus, greater understanding regarding the sus-tainability of series of earnings also gives these users a better base on which to make fund allocating decisions.
Other studies address income properties in the Brazi-lian market, such as those by Almeida, Sarlo, Bastianello, and Moneque (2012), which compare conservatism and smoothing, and Paulo and Martins (2007), Cupertino (2010), and Takamatsu (2011), which investigate earnin-gs persistence and its components. In other markets, Bao and Bao (2004), and Yueng (2009) link smoothing with earnings quality, as important information for investors. his paper contributes in showing the relationship be-tween smoothing and persistence, something which is not addresses in previous studies. In addition, this stu-dy presents an income smoothing attribution approach based on the EM1 and EM2 metrics from Leuz, Nanda, and Wysocki (2003), directly associated with companies, unlike the original model.
From the shareholder information perspective, this study focuses on proit as important accounting infor-mation, measured in a way that relects company per-formance. Recent studies by Dichev, Graham, Harvey, and Rajgopal (2013, 2016) show that inancial directors identify proit as a key metric, with its greatest impor-tance being that of investor information for evaluating companies.
With the performance measurements in successive periods, time series of reported earnings are produced, which have speciic temporal properties, such as persis-tence and smoothing, in which the latter is widely con-sidered a form of earnings management. Schipper and Vincent (2003), Francis, LaFond, Olsson, and Schipper (2004), Dechow and Schrand (2004), and Dechow, Ge, and Schrand (2010) propose that persistence is a repre-sentative construct of the usefulness of earnings for in-vestors, subject to the inluence of income smoothing. his involves properties from the same series of informa-tion, but which measure its features diferently, and the relationship between which this study aims to investigate.
Based on the central idea that performance reported as stable over time can afect the usefulness of the series of earnings for evaluating the company, the following research question was formulated: What is the inluen-ce of income smoothing over earnings persisteninluen-ce in the Brazilian market? he aim of the study was, therefore, to investigate how income smoothing inluenced earnings
2.1 Earnings Persistence
Earnings persistence is a feature of accounting infor-mation associated with contributing to future company income forecasts – assuming that persistent earnings are more useful in evaluating investments. As Dechow et al. (2010) explain, the logic behind persistence is intuitive: if Firm A presents more persistent earnings than Firm B in perpetuity, then Firm A’s earnings are a more useful synthetic measure of future performance and annuali-zing its current earnings will result in fewer evaluation errors.
Diferent papers measure, by means of earnings per-sistence, the quality of information reported to external users. Miller and Rock (1985), Easton and Zmijewski (1989), Kormendi and Lipe (1987), and Lipe and Kor-mendi (1994) refer to persistence as the efect of inno-vations in earnings in the current period on the present value of revisions of expected future earnings, linking it with the impacts of innovations in earnings on expecta-tions of market participants for future earnings.
Baginski, Lorek, Willinger, and Branson (1999) ex-plain persistence based on the irm: companies make
operational and investment decisions, which create con-ditions for sustaining current earnings and increases in them, leaving traces that investors seek to observe, expecting them to generate earnings that persist. hus, according to the authors, persistence captures how a current impact should afect the whole low of future achievements of a series of earnings. he authors use Lev (1983) as a base, which in turn addresses persistence as synonymous with non-randomness in earnings beha-vior.
Persistence is presented by Schipper and Vincent (2003) in terms of sustainability, related to the percep-tion of permanence and transience of changes in earnin-gs, as a construct of quality of information, which results from its usefulness to the investor decision making pro-cess, speciically in evaluating companies.
per-sists in subsequent periods.
Kothari (2001) discusses persistence denominating it by means reversion, in comparison with the random walk behavior of earnings. he author indicates reasons for its existence from some economic perspectives, such as unsustainable proitability above average earnings due
to competition; conservatism and litigation risk, leading to advance recognition of losses, which increase series transience when reverted; and recognition of transitory items and mark to market of assets and liabilities.
As presented by Dechow et al. (2010), the basic mo-del for persistence is represented by Equation 1.
where:
Et is the measure of Earnings, in period t;
α is the constant term;
β is the persistence parameter, between 0 and 1;
εt is the error term;
he limit between 0 and 1 for the persistence parame-ter is given by its own deinition. At value 1, a random walk is assumed, which indicates that impacts on cur-rent earnings fully afect the future series. A zero value, on the other hand, indicates total transience of shocks, characterizing the absence of persistence.
Studies of the Brazilian market investigate earnings persistence from diferent perspectives. Paulo and Mar-tins (2007) observe greater persistence in operating inco-me in comparison to cash lows from operations. Sousa and Galdi (2013), Silva and Machado (2013), Takamatsu (2011), and Cupertino (2010) present evidence of grea-ter persistence for cash lows in relation to accruals.
As important factors for abnormal earnings persis-tence, Aguiar, Lopes, and Coelho (2007), and Coelho and Braga (2008) identify some company operating sec-tors, but not market participation; and Wuerges, Cuper-tino, Siqueira, and Costa (2009) show that more recent accounting data has more precise informational content regarding company situation, with good results impac-ting more heavily on results for the subsequent period. Pimentel and Aguiar (2012) address quarterly earnings, not inding signiicant evidence of persistence for the majority of companies, and they identify size and dife-rent corporate governance standards as important fac-tors.
2.2 Income Smoothing
As one of the target aims of earnings management practices, smoothing went on to be discussed based on Hepworth (1953), which observed that companies, in reporting earnings without a historic record of peaks and valleys, maintain better continuity in their insti-tutional relationships, in which investors and creditors feel more conident in the face of more stable results. Other authors share similar perspective, such as Cope-land (1968), Imhof (1977), and Eckel (1981).
In accordance with Dechow and Skinner (2000), and Martinez (2013), various studies are based on deini-tions given by Schipper (1989), and Healy and Wahlen
(1999), which in general place management as a pur-poseful administrative practice, with the intention of mislead users of information with regards to company performance.
It is worth noting, however, that Dichev et al. (2013) provide evidence of conlicting positions with regards to smoothing: on one hand, it is seen as a desirable fe-ature of stability; on the other hand, it is interpreted as an opportunistic and misleading attitude. In accordance with Graham, Harvey, and Rajgopal (2005), executives worry about conveying business stability, with a strong perception that the market rejects uncertainty and va-lues predictability of results.
In turn, Parfet (2000) and Arya, Glover, and Sunder (2003) claim that earnings management forms part of the features of managers, who, as internal agents, have a greater capacity to mitigate and isolate transitory varia-tions regarding performance than external users, based on reported information.
Studies concerning the American market indica-te diferences in smoothing levels, relaindica-ted to company economic sector, when considered in conjunction with company size, as in Albrecht and Richardson (1990); lar-ger companies tend to smooth their results more, accor-ding to Michelson, Jordan-Wagner, and Wootton (1995, 2000). However, for the Brazilian market, Martinez and Castro (2011) identiied smoothing related to smaller companies, in contrast with the results found in the American and European markets. he authors explain this distinction via the possibility of risk perception of-setting behavior, in comparison with larger companies.
Torres, Bruni, Castro, and Martinez (2010) present evidence of the mitigation of smoothing by the presen-ce of better corporate governanpresen-ce, indicating that irms with more concentrated capital can practice smoothing in order to meet the interests of majority and con-trolling shareholders, altering minority shareholders’ perceptions of risk. Lyra and Moreira (2011) analyze smoothing related to corporate governance, focusing on special segments of the BM&FBOVESPA, and pre-sent evidence of a smaller proportion of companies with smoothing in the segment with greater governance.
Diferent authors relate smoothing to other fac-tors, such as conservatism, in the case of Almeida et al. (2012), who observed greater diiculty for the market in recognizing losses in earnings in advance when there
is smoothing; the classiication of risk, as Tonin (2012) showed, there being a greater likelihood of smoothing in companies that have ratings determined by agencies; and sector comparison, demonstrated by Baioco, Almei-da, and Rodrigues (2013), in showing that sectors with speciic accounting regulation exhibit a lower level of smoothing.
Leuz et al. (2003) link smoothing to earnings ma-nagement practices, by studying various countries, ac-cording to market features. he authors ind an inverse relationship between the level of minority investor pro-tection and earnings management. hey propose four management metrics, of which two are related to ear-nings smoothing and two measure discretion regarding
earnings. As this study speciically addresses smoothing, we opted to jointly adopt only the irst two metrics from Leuz et al. (2003).
he irst measure (EM1) relates the standard devia-tion of operating income with the standard deviadevia-tion of cash lows from operations, as in Equation 2. It is argued that the process of income smoothing causes lower va-riability in operating earnings, in comparison with cash lows. he lower the value found for the measurement, the higher the level of smoothing attributed. As the di-ference between the two pieces of information results from accruals, this metric captures income smoothing via accounting adjustments, but not via decisions that also afect cash low.
where:
σ(OpInc) is the standard deviation in Operating Income in the total period;
σ(CFO) is the standard deviation in Cash Flow from Operations in the total period.
he other smoothing metric presented by the authors (EM2) is the correlation between variations in accruals and those in cash low from operations, as in Equation 3, with the reason that accounting discretion can be used to hide impacts on cash lows, and so present smoothed income.
As well as Leuz et al. (2003), other researchers used this measure, such as Land and Lang (2002), and Myers, Myers, and Skinner (2007).
hese authors explain that, in general, there is no sur-prise in inding negative levels of correlation, since accruals are considered to adjust to impacts on cash lows, that is, they temporarily accumulate result values that will be re-verted in cash low at another time. he dampening efect of earnings in relation to cash lows, when very strong, in-dicates income smoothing, resulting in more negative va-lues for EM2.
EM2 = ρ (ΔAccruals, ΔCFO) 3
EM1 = σ (OpInc) 2
σ (CFO)
where:
∆Accruals is the variation in accruals over the period analyzed;
∆CFO is the variation in Cash Flows from Operations over the period analyzed.
It is worth stressing that these measures are incapable of diferentiating smoothing situations, when this results naturally from the earnings management process. hus, this study views smoothing from a earnings management perspective, but without ceasing to also view it as a time--series property of earnings, the presence of which, as is argued, can inluence another characteristic, which is per-sistence.
2.3 Influence of Persistence on Smoothing
Schipper and Vincent (2003), in classifying the time--series properties of reported income, treat persistence as an indicator of permanence of variations in income, inverse to the transience. he authors argue that the in-troduction of transitory components in earnings reduces
the quality of earnings measured by persistence, due to there being noise in the time series.
Additionally, Francis et al. (2004) highlight that smoothing helps in eliminating uncertainty regarding reported income; however, this can compromise the in-formational level with regards to the structure of com-pany payments, which is of interest to investors. he au-thors ofer a complementary perspective on the inluence of smoothing over persistence, from the possibility of an increase in persistence, due to transitory luctuations in series of earnings being mitigated.
Dechow and Schrand (2004) explain that earnin-gs quality, captured by persistence, can be increased when impacts that are not relevant to company value are smoothed, but it is reduced when important changes are smoothed. Dechow et al. (2010) reinforce the idea that hiding relevant impacts worsens earnings quality, since they would be useful in the investor decision-making process.
evidence that the relevance of reported results derives as much from quality of information as from both of the features together, but not from income smoothing alone; and they propose that the two factors should be taken into account in company evaluations. Yueng (2009) addressed the relationship between smoothing and qua-lity in a similar way for various countries in the Europe-an market, inding consistent evidence.
From the use of smoothing as a earnings
manage-ment practice, suggested by the literature, and its pos-sible interference with persistence, as discussed in Schi-pper and Vincent (2003), Francis et al. (2004), Dechow and Schrand (2004), and Dechow et al. (2010), as well as evidence from Bao and Bao (2004) and Yueng (2009) on the efect of smoothing together with earnings quality, in its usefulness as information to investors, the following study hypothesis was formulated: Income smoothing re-duces earnings persistence in the Brazilian market.
3 METHODOLOGY
The scope of this study is limited to publicly traded companies that operated in the Brazilian market betwe-en 2004 and 2013. The choice of this interval is justified by the balance around the process of adopting interna-tional accounting standards, an important normative change for the Brazilian market. Given that use of more recent data alone would lead to a very short time series for attributing smoothing and carrying out a consistent analysis of persistence, we sought to widen the study pe-riod in a way that equally covers the full use of domestic
Brazilian standards, from 2004 to 2007, and internatio-nal ones, from 2010 to 2013.
Using the Economática® database, we sear-ched for all the companies with shares traded on the BM&FBOVESPA between December 2003 and Decem-ber 2013. The beginning of the interval in DecemDecem-ber 2003 was considered as an initial value for 2004, and therefore the interval 2004-2013 comprises the comple-te years. In Table 1 the composition of the research mo-del is presented.
Table 1 Sample composition
Table 2 Study variables
Sample composition Number of companies
Companies present in the whole study period 275
(-) Removal of companies
with accounting peculiarities (holding and inancial) (76)
with missing data (44)
Final sample 155
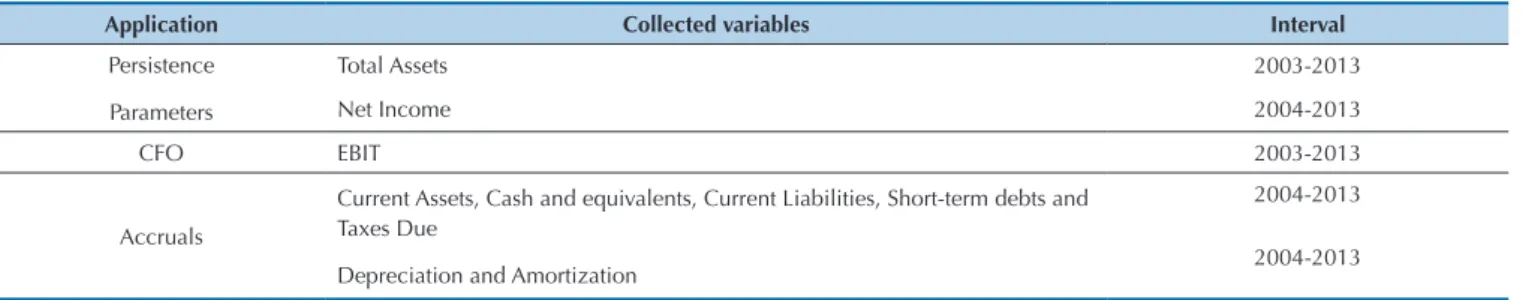
Application Collected variables Interval
Persistence
Parameters
Total Assets 2003-2013
Net Income 2004-2013
CFO EBIT 2003-2013
Accruals
Current Assets, Cash and equivalents, Current Liabilities, Short-term debts and Taxes Due
Depreciation and Amortization
2004-2013
2004-2013
Source: Developed by the authors.
Source: Developed by the authors.
In this study, the analyzed panel is balanced, that is, with observations for all of the cross elements over each period; and short, since the number of companies is gre-ater than that of the time periods. As in Kothari (2001), the persistence measurement is afected by survival bias, in expecting that surviving irms revert to bad perfor-mance, which leads to an increase in transience. hus, it
is possible to argue that the persistence parameters can be underestimated due to the survival bias, reducing its statistical signiicance.
To carry out the study, various variables were collec-ted from the Economática® database in order to develop the persistence and smoothing models adopted. he va-riables are presented in Table 2.
he basic persistence model, represented in Equation 2, serves as a starting point for the investigation of persis-tence as a quality of earnings. For the presence of
he Cash Flow from Operations was calculated from the diference between Operating Income (EBIT) and estima-ted accruals, since the reporting of Cash Flow Statements only became compulsory ater Regulation nº 11638/07, and
this study includes previous periods. hus, accruals were estimated via the balance sheet approach, as in Equation 4, an approach attributed to Jones (1991) and used by various empirical studies, including Leuz et al. (2003).
4
Accrualsit = (ΔCAit - ΔCashit) - (ΔCLit - ΔSTDit - ΔTaxit) - Depit
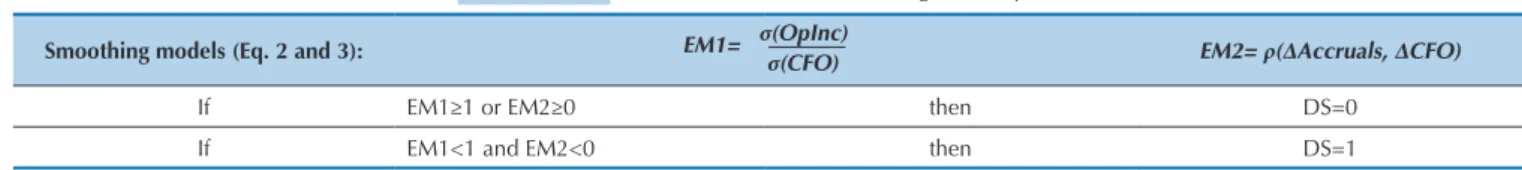
Table 3 Criteria for the smoothing dummy SD
Smoothing models (Eq. 2 and 3): EM1= σ(OpInc)
σ(CFO) EM2= ρ(∆Accruals, ∆CFO)
If EM1≥1 or EM2≥0 then DS=0
If EM1<1 and EM2<0 then DS=1
Source: Developed by the authors.
From the criteria deined in Table 3, undeined cases are absorbed by the group without the presence of smoothing. his attribution implies assuming that none of the metrics is suicient to infer smoothing on its own, but that both are for non-smoothing, and with this, a conservative position is assumed in attributing the presence of smoothing to the companies. he main implication of absorbing cases wi-thout clear deinition, in one or the other group, is to impair the group boundaries, classifying similar companies into separate groups – in this case, not attributing the presence of smoothing to a company that presents smoothed results.
To determine the earnings persistence feature, the basic model represented by Equation 1 was adopted, with a irst order lag in relation to company net income. With the aim of mitigating the “size” efect on the sample, the earnings
attri-buted to each company were adjusted by their Average Total Assets corresponding to each period. Average measurement of assets was chosen to attenuate variations in size over the accounting period, as opposed to the alternative of treating size as a simpler measure of total assets at the beginning of the period. Robustness analyses showed stronger evidence of persistence when the average value measurement was used, without alterations for the study’s conclusions.
Next, a multiplicative dummy variable was attributed to the basic model’s autoregressive term, which allows the pre-sence of smoothing to be related to the earnings persistence parameter (SD). As the focus of the study is the inluence of smoothing over persistence, and persistence is measured by the estimated coeicient of the autoregressive term, it is highlighted, in this case, that insertion of the dummy where:
∆CAit is the variation in Current Assets for irm i in period t;
∆Cashit is the variation in Cash and Cash Equivalents for irm i in period t;
∆CLitis the variation in Current Liabilities for irm i
in period t;
∆STDit is the variation in Short Term Debts for irm i
in period t;
∆Taxit is the variation in Tax Due for firm i in pe-riod t;
Depit are Depreciation and Amortization expenses for irm i in period t;
To separate the companies with regards to smoothing, the logic attributed to the EM1 and EM2 metrics by Leuz et al. (2003) was assumed in Equations 2 and 3. In that particular paper, both metrics are used at market level, that is, calculated for companies belonging to previously determined groups, and compared between these groups. In this study, these measures are used as a grouping cri-terion, so that the set attributed to the presence of smoo-thing is formed of companies that exhibit both metrics statistically signiicant in this sense.
To determine the presence of smoothing through me-tric EM1, the p-value from the Levene’s test is estimated, comparing each company’s operating income and cash
low from operations variances for the study period. Clas-siication of companies into the group with the presence of smoothing met two criteria: (i) the ratio of the standard deviation in operating income to the standard deviation in cash lows from operations should be lower than the unit; and (ii) half of the p-value of the Levene’s test should be less than 0.05, which was the set level of signiicance.
Determining the presence of smoothing via metric EM2 was done by comparing the Pearson correlation values of the variations in accruals and cash lows from operations between 2005 and 2013, with the critical r va-lue of 0.5822 – obtained for nine pairs of observations and a unilateral level of signiicance of 0.05. To determine the presence of smoothing, the correlation should be sta-tistically lower that zero: (i) should be negative; and (ii) should have a higher absolute value than critical r.
ble should be carried out only in a multiplicative way, with there being no sense in also inserting it in an additive way.
he study model thus followed which can be described by Equation 5.
NIit = β0 + (β1 + β2.SD) NIi,t-1 + εit 5
where:
NIit is the Adjusted Net Income of company i in pe-riod t;
β0 is the constant term;
β1 is the persistence parameter without the presence of smoothing;
β1+β2 is the persistence parameter in the presence of smoothing;
SD is the dummy variable, which represents the presen-ce of smoothing;
ε is the error term.
he persistence parameters provide sensitivity to the model with regards to the presence of smoothing, in which the β1 term applies to the group of companies for which the presence of smoothing was not attributed and
β1+β2 to those companies with the presence of smoothing. So, β2represents the diference between the groups and its statistical signiicance indicates the inluence of the pre-sence of smoothing over earnings persistence. In the case of a positive sign, an increase in persistence attributed to smoothing is indicated, that is, its presence improves the quality of information; otherwise, with a negative sign, it is inferred that smoothing worsens quality.
4 RESULTS AND ANALYSES
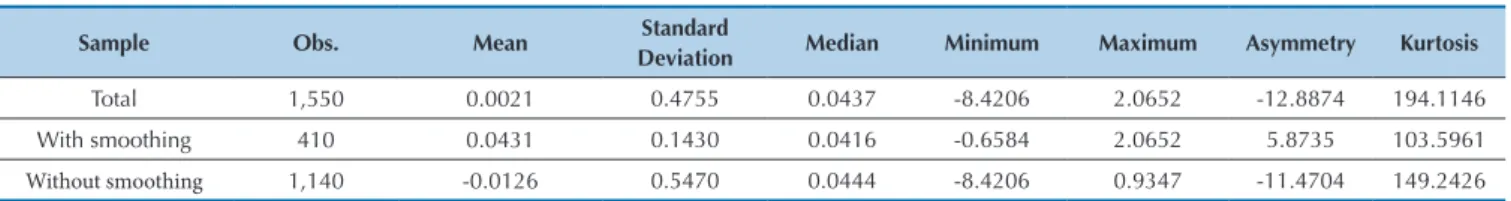
In Table 4 the Adjusted Net Income of the companies that comprise the total sample is statistically described and with separation with regards to the presence of smoo-thing.
Adjusted Net Income is a measure that is represen-tative of performance, in which the aim is to reduce the inluence of company size. Cupertino (2010) reminds us that as the size of balance sheet items varies between
dife-rent companies, comparison with standardized variables is a widely used practice in studies that use cross-sectional data. An additional point in relation to the persistence pa-rameter estimations is that there is a speciic interest in removing the “size of income” efect as a measure of per-formance. his is because size is a highly constant feature, inluencing persistence of performance measured by re-ported income directly.
Table 4 Adjusted Net Income in the sample
Sample Obs. Mean Standard
Deviation Median Minimum Maximum Asymmetry Kurtosis
Total 1,550 0.0021 0.4755 0.0437 -8.4206 2.0652 -12.8874 194.1146
With smoothing 410 0.0431 0.1430 0.0416 -0.6584 2.0652 5.8735 103.5961
Without smoothing 1,140 -0.0126 0.5470 0.0444 -8.4206 0.9347 -11.4704 149.2426
Source: Developed by the authors.
he statistical description of Adjusted Net Income sho-ws a mean that is very close to zero and a standard deviation that indicates a large data spread. In relation to the mini-mum, maximini-mum, and median values, accentuated asym-metry is observed, with the median closer to the maximum value and greater than the mean. Asymmetry to the let and an accentuated curvature of distribution are relected in the negative value of the asymmetry measure and in the high value of the kurtosis, even though normal distribution is not a requisite for the Adjusted Net Income variable.
In the grouping in which there is the presence of income smoothing, it is observed that the central measures, mean and median, are close to zero, while the standard deviation is greater in the group without smoothing and lower in the group with smoothing. Mann-Whitney tests show that the group means do not have statistical diference, with p-value = 0.8743, but the spread in income is greater in the group
without smoothing, with p-value = 0.0001. his diferen-ce in spread is compatible with the smoothing attribution process itself. Moreover, the lowest value for the variable is found in the group without smoothing and the highest in the group with smoothing, which is relected in the dife-rent signs of the asymmetry measures.
Determining the presence of smoothing was based on the EM1 and EM2 ratios, in the work of Leuz et al. (2003), as in Equations 2 and 3, and was carried out based on the criteria indicated in Table 3. he composition of the sample formed based on the attribution of the smoothing dummy variable criteria is detailed in Table 5.
this measure resulted in 0.9976. he classiication carried out for the EM2 metric resulted in 128 companies indica-ting the presence of smoothing and 27 without smoothing. For both the EM1 and EM2 metrics, Mann-Whitney tests
indicate there being signiicant diferences in the value of the grouping measures with regards to smoothing, with p-values < 0.0001. In this way, the groups formed can be considered distinct.
Table 5 Sample distribution in relation to smoothing
With smoothing Without smoothing
EM1 EM2 Combined Sample EM1 EM2 Combined Sample
Criteria EM1<1 EM2<0 “and” EM≥≥1 EM2≥≥0 “or”
Dummy variable DS=1 DS=0
No of companies 42 128 41 113 27 114
Average 0.0467 - 0.8828 – 0.4910 - 0.3410 –
Standard Deviation 0.0265 0.1087 – 0.2781 0.2355 –
Minimum 0.0069 - 0.9991 – 0.1008 - 0.5813 –
Maximum 0.0985 - 0.5908 – 0.9976 0.3319 –
Note. Smoothing models (Eq. 2 and 3): EM1= σ(OpInc) e EM2= ρ(ΔAccruals, ΔCFO). Source: Developed by the authors. σ(CFO)
To determine the presence of smoothing in the com-bined sample, it was set that both metrics should point in the direction of income smoothing. This was the case for 41 companies, the same ones that comprised the group with the presence of smoothing via the EM1 me-tric – that is, all the companies that showed the presen-ce of smoothing for EM1 also did so for EM2, with the exception of one company, which exhibited the presen-ce of smoothing through EM1, but without smoothing through EM2.
Consequently, 26 companies classified as without smoothing by the EM1 and EM2 metrics joined the group without the presence of smoothing from the combined sample, plus the 88 with divergent classifi-cation (classified as without smoothing via EM1 and with smoothing via EM2), totaling 114 companies – the whole composition of the group without smoothing via the EM1 metric, plus one company classified without smoothing only via the EM2 metric. The distribution of the companies can be observed in Figure 1.
Figure 1 Distribution of companies according to smoothing attribution via EM1 and EM2. Source: Developed by the authors.
A higher concentration in lower values in both the measures stands out, in which company incomes were classiied as smoothed, in the pink region; and a greater spread as the EM1 and EM2 values increase, in the blue
region. he correlation between both measures is 0.5635 (p-value < 0.001), showing a signiicant relationship be-tween the variables.
whi-ch the presence of smoothing was attributed solely by EM2, it is recognized that this measure has acquired a less conservative character, which can be attributed to the argument that companies exhibit a naturally nega-tive correlation of variances between accruals and cash lows. hus, a critical r value set based on a zero parame-ter results in a higher limit to an r value obtained based on a parameter below zero, which would become more representative of this naturally negative correlation and reduce the sample cut-of point criteria.
It also is possible to perceive an absence of compa-nies distributed for higher values of EM2 and lower va-lues of EM1 from the analysis of Figure 1. Because they are metrics that capture smoothing in a distinct way, the behavior of earnings should be analyzed more carefully.
In Figure 2, the aim was to compare the extremes, considering the lowest values for EM1 and EM2 simulta-neously, characterizing the sample with the presence of smoothing (a); and higher for both measures, characte-rizing the absence of smoothing (b). In a complementa-ry analysis, a third extreme appears with high values for EM1, lower values for EM2, cases associated with non--income smoothing, from a conservative position (c). he ive most extreme cases in each situation were cho-sen, in which the companies are identiied by the
Econo-mática numbering and the operating income were com-pared to the cash lows from operations and net income.
In the comparison between the three situations in Figure 2, the behavior of income is shown in relation to cash lows with regards to the extreme cases in whi-ch income smoothing (a) and non-smoothing (b) and (c) was considered. In the comparison between the two most distant extremes – low EM1 and EM2 values vs. high values for both – it is possible to clearly perceive the detachment of operating income and net income series from cash lows from operations in the irst case (a), in contrast with the monitoring of income in the second case (b).
Observation in conjunction with the behavior of in-come in the third extreme (c) allows for a better distinc-tion than each metric captures. For cases (b) and (c), the EM1 measures are closer to the maximum value, and in (a) to the minimum value, relecting its sensitivity to the variation in income in relation to cash lows as an external measure of magnitude. Conversely, the EM2 measurements are closer to the maximum value in (b) and to the minimum in (a) and (c), and the behavior of income in relation to cash lows contrasts with regards to following or breaking from the time series in each stage, which relects an internal sensitivity of this metric.
hus, the signiicant correlation of the metrics sug-gests a common income smoothing feature, as also ob-served by Leuz et al. (2003), but with diferent abilities to capture the behavior of earnings, in comparison with cash lows. In this study, the conservative position option consists of considering that both metrics should indicate
the presence of income smoothing; however it is ignored that the correlation of EM2 would naturally be negative, accepting the zero value as a parameter for deining the cut-of criteria. Reinement of such positions could be carried out in future studies.
Once the panel data was obtained, it was necessary to Cash Flow from Operations
Operating Income – (a) low EM1 and EM2, extreme with smoothing Operating Income – (b) high EM1 and EM2, extreme without smoothing
Operating Income – (c) high EM1 and low EM2, extreme without smoothing due to conservative position Net Income
Source: Developed by the authors.
choose an approach used for the regression. he choice of the data approach came about via the results of the Chow test, with p-value < 0.001, indicating completion of the Hausman test, with p-value < 0.001, supporting the Fixed Efects treatment. With this, it is accepted that there are factors that are not recognized in the model, which are signiicantly correlated to reported income, which are
in-variant and diferent between companies.
Next the persistence of adjusted net income parame-ters was estimated, as indicated in Table 6. In Model A, the presence of smoothing in the sample was ignored (Eq. 1), and in Model B, the model developed to investi-gate the inluence of the presence of smoothing over per-sistence (Eq. 5) was used.
Table 6 Estimation of Persistence Parameters
Regression β0 β1 β2
F sig. R² adj. R² Coef. t sig. Coef. t sig. Coef. t sig.
[A] 10.15 0.0018 0.7469 0.1724 -0.0021 -3.95 <0.001 0.3967 3.19 0.002 – – –
[B] 8.07 0.0005 0.7579 0.1843 0.0021 2.32 0.022 0.4146 3.92 <0.001 -0.3764 -3.29 0.001
Notes.
1. [A] Basic model, ignoring the presence of smoothing, based on Eq. 1: NIit = β0+ β1NIi,t-1+ εit
2. [B] Smoothing model, as in Eq. 5: NIit = β0+(β1+β2.SD) NIi,t-1+ εit
3. Residuals: (a) not normal (Shapiro-Wilk with approximation from Royston, p-value <0.001), (b) heteroskedastic (Wald modified, p-value <0.001) and
(c) without autocorrelation (Cumby-Huizinga with robustness to heteroskedasticity, p-value = 0.4657). 4. Estimations robust to heteroskedasticity.
5. Additional robustness tests:
(a) Control by year: no significant year. Without impact for the estimated parameters.
(b) Adjustment by TA at the beginning of the period: Same persistence behaviors, but with small losses in the statistical significance of the estimated parameters – Co-efficients (t): [A] β1 = 0.2141 (1,92), p-value = 0.054, significant only to the level of 10%; [B] β1 = 0.2392 (2.31), p-value = 0.022 and β2 = -0.2376 (-2.17), p-value =
0.032, both significant only to 5%. Source: Developed by the authors.
As can be observed, the values of the F statistic = 10.15 and 8.07, with p-values = 0.0018 and 0.0005, from models A and B being signiicant, with an explanatory power of 74.69% and 75.79%, as in the R² presented in Table 6. When the adjusted R² values of 0.1730 and 0.1855 are considered, excluding the quantity of variables efect, the contribution of the smoothing dummy varia-ble to the explanatory power of the model also becomes evident. he β0 intercept represents the averages of indi-vidualized intercepts and is signiicant and negative for the basic model, but that for the model with smoothing can be considered signiicant to 5%, but not to 1%, and exhibits a positive sign.
he β1 coeicient from model A is signiicant, with t statistic = 3.19 and p-value = 0.002, which indicates that the sample is persistent when the presence of smoothing is ignored. his result shows that persistence is a featu-re that is pfeatu-resent in the companies in the sample, and therefore in the Brazilian market for the period studied. Previous studies also identify earnings persistence in their diferent facets, such as Paulo and Martins (2007), Cupertino (2010), Takamatsu (2011), Silva and Machado (2013), Sousa and Galdi (2013), for operating income; and Aguiar et al. (2007), Coelho and Braga (2008), and Wuerges et al. (2009) for residual income.
For model B, coeicient β1 is also statistically signi-icant, with t = 3.92 and p-value < 0.001, in the appli-cation of Equation 5. When the presence of smoothing by accounting means in the model is considered, there is the indication that the companies without smoothing are
signiicantly persistent.
Coeicient β2 shows that the diference in persistence between the companies with regards to smoothing is sta-tistically signiicant and negative, with t statistic = -3.29 and p-value = 0.001. his result indicates that the pre-sence of smoothing inluences the persistence of adjusted earnings, reducing it.
With these results, the hypothesis of this study, sta-ted as Income smoothing reduces earnings persistence in the Brazilian market, is thus conirmed by observation of the statistical signiicance of β2 and its negative sign, in model B, through the application of Equation 5. hus, it is observed that the presence of smoothing reduced earnings persistence, impairing the quality of reported information.
In accordance with the explanations from Schipper and Vincent (2003), Dechow and Schrand (2004), and Dechow et al. (2010), observation of a negative contribu-tion of the presence of smoothing over persistence can be explained by the increase in transience of the series. his efect could be the efect of a higher level of transitory components, which dampen luctuations in reported re-sults, but bring greater transience to the series, and/or of the removal of permanent components, which would be informative when reported, but which would bring grea-ter variability to the time series.
For reinement of the conclusions of this study, addi-tional controls were tested, in search of possible factors that could inluence the smoothing-persistence rela-tionship, notably size, level of corporate governance,
ac-adj adj
Table 7 Additional approach to the smoothing-persistence relationship
No. companies Total Sample Without smoothing With smoothing Difference
Total (smooth.) Coef. (t) Coef. (t) Coef. (t) Coef. (t)
Panel A: Size (Quartiles)
I 39 (7) 0.3962*** 0.4296*** 0.0229 -0.4068***
(3.30) (4.23) (0.62) (-3.79)
II 39 (8) 0.1071 0.0993 0.3577 0.2585
(0.99) (0.92) (1.48) (1.03)
III 39 (13) 0.3659*** 0.3728*** 0.3349*** -0.0379
(7.70) (6.87) (3.97) (-0.38)
IV 38 (13) 0.3662*** 0.4299*** 0.2379*** -0.1921
(3.86) (3.38) (3.04) (-1.30)
Panel B: List of Special Segments of the BM&FBOVESPA
Traditional Market 99 (25) 0.3826*** 0.4137*** 0.0274 -0.3863***
(3.10) (3.83) (0.73) (-3.38)
Level 1 19 (4) 0.1927 0.1650 0.4842* 0.3191
(1.12) (0.89) (2.74) (1.32)
Level 2 7 (3) 0.4096** 0.4066*** 0.4148 0.0083
(2.67) (3.71) (0.97) (0.02)
New Market 30 (9) 0.5742*** 0.6428*** 0.2816*** -0.3611***
(6.04) (7.60) (3.98) (-3.33)
Panel C: Sectorial Regulation
Non-regulated 115 (31) 0.4267*** 0.4635*** 0.0348 -0.4288***
(4.72) (7.46) (0.83) (-5.74)
Regulated 40 (10) -0.3308*** -0.3429*** 0.2963*** 0.6392***
(-5.27) (-6.47) (4.39) (7.65)
Panel D: Occurrence of Loss (in years)
0 74 (21) 0.1091 0.0707 0.4579*** 0.3872***
(1.25) (0.82) (7.83) (3.73)
01 – 10 81 (20) 0.3889*** 0.4210*** 0.0285 -0.3925***
(3.25) (4.06) (0.75) (-3.56)
01 – 04 52 (16) 0.2920*** 0.3069*** 0.2179* -0.0890
(3.73) (3.37) (1.94) (-0.62)
05 – 10 29 (4) 0.3906*** 0.4229*** 0.0212 -0.4016***
(3.19) (4.01) (0.55) (-3.62)
Note. ***, ** and * indicate statistical significance to 1%, 5% and 10%, respectively. Source: Developed by the authors.
counting regulation, and reporting of losses. Considering the grouping of companies by their diferent features, the
persistence parameters estimated are represented in pa-nels A, B, C, and D in Table 7.
In Panel A, the grouping by size is observed, captu-red by assets in logarithmic scale. A greater presence of smoothing in larger companies is noted, unlike what was observed by Martinez e Castro (2011). Persistence is sig-niicant, independent of size in the general sample and in the group without smoothing. hus, while Pimentel and Aguiar (2012) identify a relationship between per-sistence and size for quarterly income, in this study this relationship appears only with the presence of income smoothing. With regards to the inluence of smoothing over persistence, the control for size reines the general result of this study in presenting evidence that it is
sig-niicant only for the smallest companies in the sample – irst quintile.
smoo-thing. In contrast, Lyra and Moreira (2011) indentify less smoothing in the New Market in comparison to Levels 1 and 2 and conclude with an inverse relationship betwe-en the level of smoothing and the strictness of special segments. However, the authors did not compare them with the Traditional Market. Even though for both seg-ments – New Market and Traditional Market – a signi-icantly negative inluence of smoothing over persisten-ce is observed, only in the group with the presenpersisten-ce of smoothing do the companies in the Traditional Market cease to exhibit persistence, which could relect a greater sensitivity of this segment to the inluence of smoothing.
In Panel C the companies are segregated with regar-ds to operation in sectors with accounting regulation – Electric power, Oil and gas, Telecommunications and Transport, in accordance with Baioco et al. (2013). he negative inluence of smoothing over persistence is si-milar to the previous observations in the absence of re-gulation, but it appears as positive for the companies in regulated sectors. However, the companies in these sec-tors without the presence of smoothing show negative persistence parameters, without economic signiicance. It is observed that Aguiar et al. (2007) identiied a nega-tive inluence of the Transport sector for the persisten-ce of residual income, while the other regulated sectors did not exhibit signiicant inluence. In the face of this, it can be accepted that regulation in itself does not in-crease the quality of reported earnings, but when it leads to smoothing, it also contributes to companies reporting persistent earnings. An important observation is that this increase in persistence would not be related to in-ternal company choices in the sense mentioned by Parfet (2000) and Arya et al. (2003), but to normative sector requirements that are external to the companies.
Finally, in Panel D, the aim was to ind evidence of the inluence of smoothing by observing companies re-porting of losses. At the general level and in the group without smoothing, there is persistence only for the companies that present losses, while the companies that present only proits only show persistence when under the inluence of smoothing. his evidence seems to contradict Kothari (2001), in accepting that compa-nies that present losses tend to revert them, increasing the transience of the series – it would be expected that
companies with losses, especially in a non-recurrent way (between 1 and 4 years), would exhibit less persis-tence in comparison to companies that presented losses to be reverted. his result also appears contradictory to Wuerges et al. (2009), who observed negative abnormal earnings persistence with less intensity than that of posi-tive, interpreting that good news more strongly impacts subsequent results. With regards to the inluence of smoothing, it is observed, inally, that in the case of the companies with proits, smoothing also leads to greater sustainability of the series, while the negative inluence of smoothing had a stronger impact on the occurrence of constant losses.
In this study the basic persistence model was adop-ted with a irst order lag. he addition of other orders in the model can be carried out in a complementary way to the analyses, in a similar procedure to the insertion of the presence of smoothing in the simpler model, seeking to widen the investigation of the relationship for further impact horizons, as in Lipe and Kormendi (1994), and Baginski et al. (1999). Other treatments of reported per-formance can also be observed, with quarterly or abnor-mal earnings. Another possibility is an approach with a greater theoretical basis of possible factors that determi-ne the inluence of smoothing over persistence, carried out merely in a complementary way in this study, inclu-ding observing joint efects of these factors.
Finally, we investigated the behavior of the Brazi-lian market between 2004 and 2013, a period that in-volved economic impacts over the companies, such as the global inancial crisis of 2008, and in accounting, with the adoption of the international accounting stan-dards (IFRS), partially from 2008, and totally from 2010 onwards. Although, for operationalization of the grou-ping of companies and estimation of the persistence parameters, matching the old Brazilian standards to the new international standards has been possible, the in-vestigation of possible changes in company behavior, in a more essential order, did not compose the scope of this study. With this, a comparative study regarding persis-tence and income smoothing for diferent accounting environments would be possible, not only for the Bra-zilian market but also in other countries, with diverse economic environments.
5 CONCLUSIONS
The aim in this study was to observe, in an empirical way, the relationship between the presence of income smoothing and persistence in the time series, focusing on the Brazilian market between 2004 and 2013. Whi-le persistence is seen in terms of the quality of infor-mation in reported income for company evaluations, smoothing has an ambiguous connotation, in which it is a desirable feature for reflecting stability in the deve-lopment of businesses, but is, primarily, recognized as the fruit of earnings management.
Theoretical arguments raised by researchers such
as Schipper and Vincent (2003), Francis et al. (2004), Dechow and Schrand (2004), and Dechow et al. (2010) propose that smoothing can influence persistence, a temporal property capable of capturing transience. Thus, the hypothesis that income smoothing reduces earnings persistence in the Brazilian market was for-mulated.
flow and accrual components. Based on the statistical model, which allowed statistical differences derived from the presence of income smoothing over parame-ters of estimated persistence to be observed, the study hypothesis was confirmed.
From the results obtained, it is observed that the pre-sence of smoothing reduced the persistence of reported earnings, lowering the quality of accounting informa-tion. This can be explained not only by the insertion of elements which make the time series smoother, but which are transitory, and therefore reduce persistence, but also by the mitigation of permanent changes in the series, that is, by the removal of important impacts for the quality of information, but which increase its varia-bility.
This observation leads to the finding that market aversion to uncertainty, which favors the reporting of income with less variability, and which are therefore smoother, leads to a loss in sustainability of the infor-mation itself that is reported by companies. With this, it is evident that constancy and permanence are distinct dimensions of reported earnings, that is, that the mes-sage of stability in businesses does not imply the absen-ce of transienabsen-ce in performanabsen-ce – the opposite effect was even observed, with a significant reduction in per-sistence caused by the presence of smoothing.
Thus, it is concluded that the result considered smoother presented by the companies was less informa-tive for investors to calculate company value. Earnings that show a smooth, but not persistent performance are permeated with transitory elements, and investors, led by a message of greater stability, make decisions based on information without sustenance. In other words, what the results of the study indicate is that, in valuing the reporting of constant performance, less useful in-formation can be reported, generating a reverse effect, which can go unnoticed.
There are aspects of the Brazilian market which re-quire complementary considerations, such as a high shareholder concentration and the presence of families in the control and management of companies, which raises the importance of fund providers and adminis-trators as users of reported financial information. Such features lead to lower minority shareholder participa-tion, not only in the composition of capital and sup-ply of funds, but also in internal company decisions, in comparison to other markets, such as the American one, from which the theories used in this study were based and developed.
An implication of this difference is that there is grea-ter bank participation in raising companies funds based on loan agreements. With regards to the evidence found in this study, the presence of income smoothing can be explained as a reflection of company behavior projec-ting stability information, given that the banking sector shows interest in low risk capital financing – a feature directly associated with the absence of volatility in re-turn on investments, thus a higher level of smoothing.
Moreover, the negative influence of smoothing over persistence has important consequences for fund provi-ders, since this calculation applies to pricing and credit approval decisions, by being based on accounting figu-res supplied by companies, even though other sources of information are used. This is because creating the ability to pay, notably in the long run, involves effecti-vely sustainable performance, which is reflected in per-sistence of the earnings stream, and which ceases to be communicated in favor of mitigating volatility, leading fund providers to make decisions supported by poorer quality information.
When the information generated and used by the company itself is considered, investment decisions based in conjunction with other information occur, through monitoring business development, that is, the earnings stream itself that is generated by the company. Thus, the influence of smoothing over persistence, whi-ch ends up reducing the informative content of the ear-nings stream, can lead to inadequate internal resource allocation decisions.
Additional analyses indicate smoothing as a nega-tively influencing factor for persistence in companies with some small sized features, which suffer from losses and which operate in sectors without accounting regu-lation; and a positive influence in regulated sectors and in the reporting of profits alone. It is worth noting that such factors could be interrelated, which was not inves-tigated in this study.
Implications on two main fronts could be followed up on: this study could be widened for the Brazilian ma-rket, in search of a link between factors that determine the relationship between persistence and smoothing under different sector-related conditions or company characteristics; and studies could be developed in the international arena, such as in more developed markets or with other perspectives and positions with regards to the accounting information reported, in order to verify whether this influence remains in different economic and accounting environments.
Aguiar, A. B., Lopes, A. B., & Coelho, A. C. D. (2007). Relacionamento entre persistência do lucro residual e competitividade em irmas brasileiras. Revista de Economia e Administração, 6(4), 397-417. Albrecht, W. D., & Richardson, F. M. (1990). Income smoothing by
economy sector. Journal of Business Finance & Accounting, 17(5), 713-730. doi: 10.1111/j.1468-5957.1990.tb00569.x
Almeida, J. E. F., Sarlo, A., Neto, Bastianello, R. F., & Moneque, E. Z. (2012). Alguns aspectos das práticas de suavização de resultados
no conservadorismo das companhias abertas listadas na
BM&FBOVESPA. Revista Contabilidade & Finanças, 23(58), 65-75. doi: 10.1590/S1519-70772012000100005
Arya, A., Glover, J. C., & Sunder, S. (2003). Are unmanaged earnings always better for shareholders? Accounting Horizons, 17, 111-116. doi: 10.2139/ssrn.322260
Baginski, S. P., Lorek, K. S., Willinger, G. L., & Branson, B. C. (1999). he relationship between economic characteristics and alternative annual
Correspondence Address:
Ana Carolina Kolozsvari
Faculdade de Administração e Ciências Contábeis, Universidade Federal do Rio de Janeiro Avenida Pasteur, 250, sala 250 - CEP: 22.290-902
Urca – Rio de Janeiro – RJ Email: [email protected]
earnings persistence measures. he Accounting Review, 74(1), 105-120. doi: 10.2308/accr.1999.74.1.105
Baioco, V. G., Almeida, J. E. F., & Rodrigues, A. (2013). Incentivos da regulação de mercados sobre o nível de suavização de resultados.
Contabilidade Vista & Revista, 24(2), 110-136.
Bao, B. H., & Bao, D. H. (2004). Income smoothing, earnings quality and irm valuation. Journal of Business Finance & Accounting, 31(9‐10), 1525-1557. doi: 10.1111/j.0306-686X.2004.00583.x
Coelho, A. C. D., & Braga, A. (2008). Relacionamento entre persistência do lucro residual e participação de mercado em irmas brasileiras de capital aberto. Revista de Contabilidade e Organizações, 2(3), 3-18. doi: 10.11606/rco.v2i3.34710
Copeland, R. M. (1968). Income smoothing. Journal of Accounting
Research, 6, 101-116. doi: 10.2307/2490073
Cupertino, C. M. (2010). Anomalia dos accruals no mercado brasileiro de
capitais. Tese de Doutorado, Universidade Federal de Santa Catarina,
Florianópolis, SC, Brasil. Retrieved from http://repositorio.ufsc.br. Dechow, P., Ge, W., & Schrand, C. (2010). Understanding earnings quality:
A review of the proxies, their determinants and their consequences.
Journal of Accounting and Economics, 50(2), 344-401. doi: 10.1016/j. jacceco.2010.09.001
Dechow, P. M., & Schrand, C. M. (2004). Earnings quality. New York, NY: Research Foundation of CFA Institute. Retrieved from http://www. cfapubs.org/doi/pdf/10.2470/rf.v2004.n3.3927
Dechow, P. M., & Skinner, D. J. (2000). Earnings management: Reconciling the views of accounting academics, practitioners, and regulators.
Accounting Horizons, 14(2), 235-250. doi: 10.2308/acch.2000.14.2.235
Dichev, I. D., Graham, J. R., Harvey, C. R., & Rajgopal, S. (2013). Earnings quality: Evidence from the ield. Journal of Accounting and Economics, 56(2), 1-33. doi: 10.2139/ssrn.2103384
Dichev, I., Graham, J., Harvey, C. R., & Rajgopal, S. (2016). he
misrepresentation of earnings. Financial Analysts Journal, 72(1), 22-35. Easton, P. D., & Zmijewski, M. E. (1989). Cross-sectional variation in the
stock market response to accounting earnings announcements. Journal
of Accounting and Economics, 11(2), 117-141. doi:
10.1016/0165-4101(89)90003-7
Eckel, N. (1981). he income smoothing hypothesis revisited. Abacus, 17(1), 28-40. doi: 10.1111/j.1467-6281.1981.tb00099.x
Francis, J., LaFond, R., Olsson, P. M., & Schipper, K. (2004). Costs of equity and earnings attributes. he Accounting Review, 79(4), 967-1010. doi: 10.2308/accr.2004.79.4.967
Graham, J. R., Harvey, C. R., & Rajgopal, S. (2005). he economic implications of corporate inancial reporting. Journal of Accounting and Economics, 40(1), 3-73.
Healy, P. M., & Wahlen, J. M. (1999). A review of the earnings management literature and its implications for standard setting. Accounting
Horizons, 13(4), 365-383. doi: 10.2308/acch.1999.13.4.365
Hepworth, S. R. (1953). Smoothing periodic income. he Accounting Review, 28(1), 32-39.
Imhof, E. A. (1977). Income smoothing – a case for doubt. he Accounting Journal, 1, 85-100.
Jones, J. J. (1991). Earnings management during import relief investigations. Journal of Accounting Research, 29(2), 193-228. doi: 10.2307/2491047
Kormendi, R., & Lipe, R. (1987). Earnings innovations, earnings persistence, and stock returns. Journal of Business, 60(3), 323-345. doi: 10.1086/296400
Kothari, S. P. (2001). Capital markets research in accounting. Journal
of Accounting and Economics, 31(1), 105-231. doi:
10.1016/S0165-4101(01)00030-1
Land, J., & Lang, M. H. (2002). Empirical evidence on the evolution of international earnings. he Accounting Review, 77(Supplement s-1), 115-133. doi: 10.2308/accr.2002.77.s-1.115
Leuz, C., Nanda, D., & Wysocki, P. D. (2003). Earnings management and investor protection: an international comparison. Journal of Financial
Economics, 69(3), 505-527. doi: 10.1016/S0304-405X(03)00121-1
Lev, B. (1983). Some economic determinants of time-series properties of earnings. Journal of Accounting and Economics, 5, 31-48. doi:
10.1016/0165-4101(83)90004-6
Lipe, R., & Kormendi, R. (1994). Mean reversion in annual earnings and its implications for security valuation. Review of Quantitative Finance and
Accounting, 4(1), 27-46. doi: 10.1007/BF01082663
Lyra, I. X. M., & Moreira, R. L. (2011). Alisamento de resultados nas empresas listadas nos níveis de governança corporativa da Bovespa.
Revista Contabilidade e Controladoria, 3(2), 78-93. doi: 10.5380/rcc. v3i2.20652
Martinez, A. L. (2013). Gerenciamento de resultados no Brasil: um survey da literatura. Brazilian Business Review, 10(4), 1-31. doi: 10.15728/ bbr.2013.10.4.1
Martinez, A. L., & Castro, M. A. R. (2011). he smoothing hypothesis, stock returns and risk in Brazil. Brazilian Administration Review, 8(1), 1-20. doi: 10.1590/S1807-76922011000100002
Michelson, S. E., Jordan‐Wagner, J., & Wootton, C. W. (1995). A market based analysis of income smoothing. Journal of Business Finance &
Accounting, 22(8), 1179-1193. doi: 10.1111/j.1468-5957.1995.tb00900.x
Michelson, S. E., Jordan-Wagner, J., & Wootton, C. W. (2000). he relationship between the smoothing of reported income and risk-adjusted returns. Journal of Economics and Finance, 24(2), 141-159. doi: 10.1007/BF02752709
Miller, M. H., & Rock, K. (1985). Dividend policy under asymmetric information. he Journal of Finance, 40(4), 1031-1051. doi: 10.1111/ j.1540-6261.1985.tb02362.x
Myers, J. N., Myers, L. A., & Skinner, D. J. (2007). Earnings momentum and earnings management. Journal of Accounting, Auditing & Finance, 22(2), 249-284. doi: 10.1177/0148558X0702200211
Parfet, W. U. (2000). Accounting subjectivity and earnings management: A preparer perspective. Accounting Horizons, 14(4), 481-488. doi: 10.2308/acch.2000.14.4.481
Paulo, E., & Martins, E. (2007, setembro). Análise da qualidade das informações contábeis nas companhias abertas. Anais do Encontro Nacional da Associação Nacional de Pós-Graduação e Pesquisa em Administração, Rio de Janeiro, RJ, Brasil, 31.
Pimentel, R. C., & Aguiar, A. B. (2012). Persistence of quarterly earnings: an empirical investigation in Brazil. Brazilian Business Review, 9
(special edition BBR Conference), 38-54. doi: 10.15728/bbrconf.2012.2 Schipper, K. (1989). Commentary on earnings management. Accounting
Horizons, 3(4), 91-102.
Schipper, K., & Vincent, L. (2003). Earnings quality. Accounting Horizons, 17, 97-110.
Silva, A. C., Filho, & Machado, M. A. V. (2013). Persistência e Relevância dos Accruals: Evidências do Mercado de Capitais Brasileiro. Revista de
Educação e Pesquisa em Contabilidade, 7(4), 387-406. doi: 10.17524/
repec.v7i4.985
Sousa, E. F., & Galdi, F. C. (2013, junho). Análise da qualidade do lucro e sua relação com a estrutura acionária das empresas brasileiras. Anais do Congresso da Associação Nacional dos Programas de Pós-Graduação em Ciências Contábeis, Fortaleza, CE, Brasil, 7.
Takamatsu, R. T. (2011). Accruals contábeis, persistência dos lucros e retorno
das ações. Dissertação de Mestrado, Universidade de São Paulo, São
Paulo, SP, Brasil. Retrieved from http://www.teses.usp.br. Tonin, J. M. F. (2012). Relação entre income smoothing e ratings em
companhias brasileiras de capital aberto. Dissertação de Mestrado, Universidade Federal do Paraná, Curitiba, PR, Brasil. Retrieved from http://dspace.c3sl.ufpr.br/dspace/handle/1884/284.
Torres, D., Bruni, A. L., Castro, M. A. R., & Martinez, A. L. (2010). Estrutura de Propriedade e Controle, Governança Corporativa e o Alisamento de Resultados no Brasil. Revista Contemporânea de
Contabilidade, 7(13), 11-34. doi: 10.5007/2175-8069.2010v7n13p11
Wuerges, A. F. E., Cupertino, C. M., Siqueira, J., & Costa, N. C. A. (2009, Jul.-Aug.). Explicando a persistência do lucro anormal das empresas brasileiras: Um enfoque baseado na assimetria do efeito do lucro anormal defasado. Anais do Encontro Brasileiro de Finanças, São Leopoldo, RS, Brasil, 9.
Yueng, M. (2009). Does the use of income smoothing lead to a higher irm
value among public European companies? Master hesis, Erasmus