Comparability of Accounting Choices in Subsequent Measurement
of Fixed Assets, Intangible Assets, and Investment Property in South
American Companies
Flaida Êmine Alves de Souza
Universidade Federal de Uberlândia, Faculdade de Ciências Contábeis, Uberlândia, MG, Brazil
Sirlei Lemes
Universidade Federal de Uberlândia, Faculdade de Ciências Contábeis, Uberlândia, MG, Brazil
Received on 12.12.2014 – Desk Acceptance on 02.04.2015 – 3rd version accepted on 10.29.2015. .
ABSTRACT
Expertise on comparability, accounting choices, and fair value is among the most controversial and poorly discussed themes in the current accounting scenario. Accounting choices are needed in order to guarantee a reliable representation, at the same time that their discretiona-ry use may decrease the comparability level expected by the International Accounting Standards Board (IASB). In this article, we identified the comparability degree of accounting choices in the subsequent measurement of fixed assets, intangible assets, and investment property (IP) for listed companies in Brazil, Chile, and Peru, in addition to check whether certain entity characteristics can influence managers’ accounting choice for fair value. Comparability was measured through the T-index and the explanatory variables were identified through regressions, within the period 2009-2013. It was found that, for fixed assets, national and international comparability increased after IFRS adoption, both increased over time. For intangible assets, there was not a substantial increase in national and international comparability. For IP, national and international comparability did not increase after IFRS adoption, their rates remained close to 0.50 (low comparabi-lity) in almost every year. Thus, IFRS adoption alone did not ensure comparability. By using regression analysis, we found that the cha-racteristics industry, audit by big four, country, managers’ remuneration, size, indebtedness, profitability, relevance, and time influenced managers’ accounting choices, indicating the possibility that the choices under analysis have been used for management of outcomes.
170
1 INTRODUCTION
and fair value. As a secondary goal, we seek to check whether certain entity characteristics can influence managers’ accounting choices. To do this, we surveyed the financial statements of 300 listed companies in 3 countries participating in the GLASS (Brazil, Chile, and Peru), within the period from 2009 to 2013, in order to assess comparability before, during, and after the man-datory IFRS adoption. The countries belonging to the GLASS were chosen not only due to their importance in the international accounting convergence process, but also considering the need to evaluate the convergence process in emerging markets (Peng & Smith, 2010). The research focus was subsequent measurement, since it is only at this point that crucial measurement differences emerge, as well as because of the continued equality be-tween historical cost and fair value at the time when an item is initially recognized and measured (Barth, 2014). Cole, Branson and Breesch (2011) identified 72 possi-bilities of accounting choices in the IFRS, divided into: (i) clear accounting choices, which allow alternative accounting methods for the same accounting case, e.g. FIFO or weighted average; (ii) covert accounting choi-ces, which have vague criteria for certain accounting facts, e.g. IAS 41, accepting measurement through the cost of biological assets, when fair value cannot be relia-bly measured; and (iii) estimate and valuation, such as using the terms “probable” and “material.”
Because only clear accounting choices follow equally valid accounting methods, which, therefore, may be se-lected with absolute discretion by a manager (there is no requirement or normative influence), this study was limited to this kind of choice. Thus, the standards cove-red in this research are IAS 16, IAS 38, and IAS 40, whi-ch address subsequent measurement as clear accounting choices. Theoretically, the research is grounded in the idea that IFRS adoption increases comparability of fi-nancial statements, since this goal provides their adop-tion with a basis.
If the entity chooses the cost method, assets should be registered at their cost, minus any depreciation/amor-tization and losses due to accumulated impairment. If the fair value method is chosen, the assets should be measured at their fair value, which becomes the basis for subsequent measurements, in order to calculate de-preciation/amortization and losses due to accumulated impairment. In the case of fixed assets and intangible assets, if book value increases due to fair value measure-ment, this increase should be credited on the equity ac-count. In the case of IP, this increase should be directly recognized in the outcome for the fiscal year.
This research is especially justified by the relevan-ce of the themes comparability, accounting choirelevan-ces, and fair value. According to Taplin (2011), further research is needed to examine accounting reports and promote discussions on the concept of comparability, as the latter Currently, 138 countries have adopted or are
adop-ting the International Financial Reporadop-ting Standards (IFRS), issued by the International Accounting Standar-ds Board (IASB), as a means to make accounting practi-ces converge (IFRS, 2014). As a reflection of the global accounting practices convergence process, the Grupo Latino-Americano de Emissores de Normas de Infor-mação Financeira (GLENIF, its acronym in Portuguese), or the Group of Latin American Accounting Standard Setters (GLASS, its acronym in English), was created in 2011, consisting of agencies that issue accounting standards in 17 countries in Latin America. Its goal is working in partnership with the IASB, in order to im-prove the quality of financial reports in the region and contribute to spread the IFRS (GLENIF, 2014).
IFRS adoption resulted in significant changes in the way how companies register their financial results (Mul-ler, Riedl, & Sellhorn, 2008), causing a true “silent revo-lution” in accounting statements, by advocating for an increased use of fair value. The IASB refers to fair value measurement in many of its standards, either on a man-datory basis, as in the case of financial instruments (IAS 39), biological assets (IAS 41), and share-based payment (IFRS 2); or on an optional basis, as in the case of subse-quent measurement of fixed assets (IAS 16), intangible assets (IAS 38), and investment property (IAS 40).
Despite the advances achieved by the IASB, many IFRS allow a certain degree of flexibility in the choice of accounting practices concerning the recognition, mea-surement, and disclosure in financial reports (Murcia & Werges, 2011). The flexibility observed in the IFRS, in turn, leads to the so-called accounting choices. The latter refer to the selection of an accounting method instead of another equally valid one (Watts, 1992). The existen-ce of accounting choiexisten-ces may lead managers to choose accounting methods that best represent their particular interests (Fields, Lys, & Vincent, 2001), and this could impact comparability. Thus, in addition to calculating comparability, research has sought to find the potential motivations that provided managers’ accounting choices with a basis (Demaria & Dufour, 2007; Christensen & Nikolaev, 2013; Taplin, Yuan, & Brown, 2014).
are still incipient. According to Fields et al. (2001), even with improved research methods, data sources, and com-puterization, researchers’ knowledge on accounting choi-ces remains limited. Moreover, according to Christensen and Nikolaev (2013), the choice between fair value and historical cost methods is among the most controversial issues in the accounting literature, especially due to lack of evidence as for managers’ motivations to choose one or another valid practice. his research difers from the others, because in addition to reconciling these three themes, it investigated the evolution of comparability be-fore, during, and ater IFRS adoption (ive-year period), in the emerging countries context (still poorly explored). his was done for all clear accounting choices possible in subsequent measurement of assets, also seeking potential justiications for the choices identiied.
As a result, it was found that, in relation to ixed assets, national and international comparability increased ater IFRS adoption and both of them have been growing over time. For intangible assets, IFRS adoption did not lead to a substantial increase in national and international com-parability, which were already high before the standards were adopted. For IP, national and international compa-rability did not increase ater IFRS adoption, remaining at a low level in almost every year under analysis. Regar-ding the explanatory variables, it was found that, for the three assets under study, entity characteristics inluenced managers’ accounting choices. hus, it is understood that only IFRS adoption does not ensure comparability. he existence of accounting choices in the standards can ena-ble management of outcomes, which impacts compara-bility.
2 THEORETICAL FRAMEWORK
2.1 Accounting Choices
According to Fields et al. (2001), an accounting choi-ce is any decision whose primary purpose is inluencing the output of the accounting system in a particular way. Also according to the authors, management intent is key to grasp the deinition of accounting choices, especially when it comes to actual decisions, i.e. if the motivation behind the decision aims to inluence accounting igures or it is derived from other factors.
According to Francis (2001, p. 312), “accounting choi-ce can be driven by managerial self-interest, by a wish to maximize the interests of a shareholders, possibly at the expense of some other contracting party, or by a wish to provide information.” he IASB, when issuing he Con-ceptual Framework for Financial Reporting, pointed out there are accounting choices in the standards so that the phenomenon they describe are faithfully represented.
he issue that arises is the lexibility enabled to mana-gers when applying the IFRS, given the existence of ex-plicit and imex-plicit choices, freedom of interpretation, and the need for estimate and valuation (Haller & Wehrfritz, 2013), so that, in practice, inancial statements become less comparable, heading in the opposite direction from the IASB proposal. When managers act opportunistically, they may use the inancial choices observed in the IFRS to increase earnings, highlight many items on the inancial statement, or manipulate accounting igures (Detzen & Zülch, 2012), something which might indicate the prac-tice of management of outcomes.
According to Lo (2008), management of outcomes is the use of valuation by managers, in order to change i-nancial reports, either to fool some stakeholders about a hidden economic company performance or to inluence contractual outcomes that depend on the accounting
i-gures reported.
Although the deinitions of accounting choices and management of outcomes are close, according to Fields et al. (2001), not all accounting choices involve manage-ment of outcomes, as this term goes beyond them. Due to managers’ motivations, accounting regulatory agencies consistently express their concerns to allow accounting choices in the IFRS, they are aware that the opposite ex-treme, i.e. absence of accounting choices, might lead to an accounting system entirely based on rules. Ideally, ac-counting choices exist to provide companies that opera-te under diferent business models (e.g. sectors) and/or under diferent institutional or environmental inluences (e.g. countries) with the option of seeking an accounting method that best represents their particular operational situation (Cole et al., 2011).
Accordingly, Fields et al. (2001, p. 261) emphasize that “accounting choice likely exists because it is impossible, or infeasible, to eliminate it.” According to these authors, what regulators should do is, by outlining the advantages and disadvantages of allowing accounting choices, deter-mine the optimal discretion level.
2.2 Comparability
Comparability is among the qualitative characte-ristics of improving the accounting information utility that allows users to identify and grasp the similarities between the items and the differences between them. As a result, accounting information will be more useful if they can be compared through similar information from other entities, or from the same entity, within another period (IASB Framework, 2011).
172
comparable: “equal things must look alike and different things must look different” (IASB Framework, 2011, item QC23). According to Yip and Young (2012), im-proving a factor (e.g. similarities) does not necessarily lead to improvement in another factor (differences). The authors claim that comparability depends on me-eting two factors simultaneously. In practice, the appa-rent simplicity of the concept of comparability ends up as one of its biggest obstacles. After all, what are things? We may interpret “things” as the entity’s business ope-rations, or types of accounts, or even a concern about the economic essence of entity transactions (Zhang & Andrew, 2010). Surely, various interpretations of this definition are likely to influence accounting practices and, therefore, comparability.
Additionally, may we distinguish “equal things” from “different things?” It would be possible to envi-sion a scenario where “things” are addressed differently only if, for each “thing,” there was more than one ac-counting method. Environmental, economic, political, cultural, operational differences etc. could be solved with the existence of accounting choices in the stan-dards, because this would allow considering different circumstances between companies and between coun-tries (Zeff, 2007). Jaafar and McLeay (2007) argue that the separation of these terms might be feasible in di-fferent economic environments, as it is expected that entities involved in similar economic activities choose similar accounting methods, regardless of their coun-try of origin.
Comparability is crucial to improve financial re-porting quality (Barth, 2013), despite the need that the IASB provides some conceptual groundwork to choose between alternative measurement bases (Barth, 2014).
According to the Framework (IASB, 2011), a faithful representation might lead to comparability, because it could reflect the characteristics of an asset or liability (Barth, 2013). However, if there are internal or external factors influencing the reliable disclosure of an item, comparability will be hard to obtain. As a result of dis-cussions on the theme, Zeff (2007) claims that compa-rability is an accounting term very hard to grasp even within a country, and this gets worse when thinking of comparability on a global basis. According to the au-thor, it is an elusive concept, where, indeed, there is no certainty whether comparability is feasible or not.
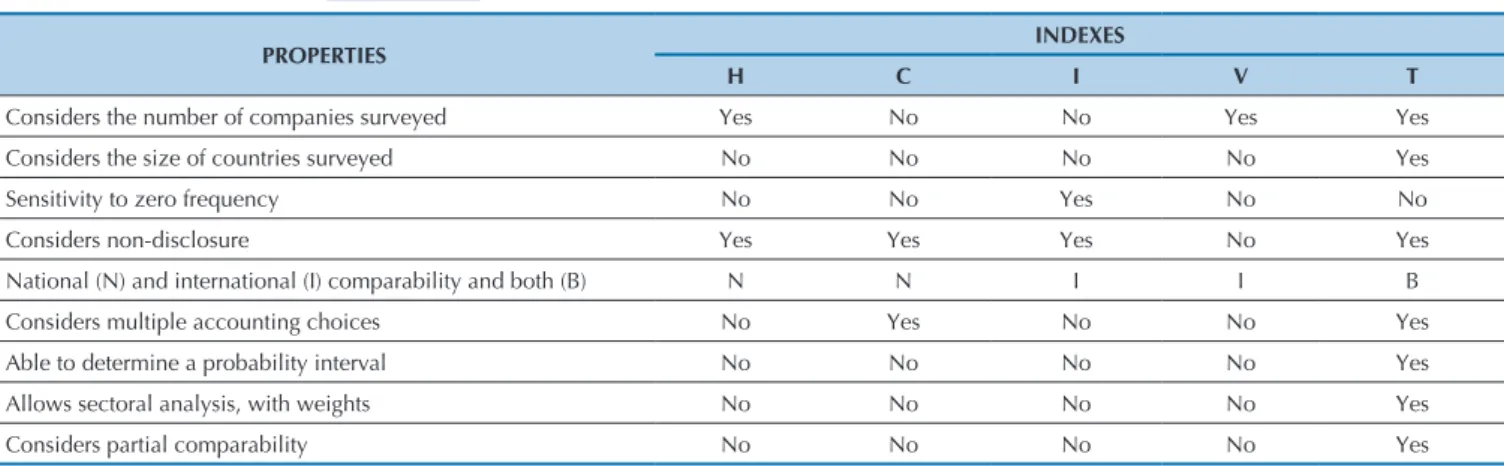
Despite the doubts that still remain regarding the application of the concept of comparability and the prognosis that it cannot be achieved (Zhang & Andrew, 2010; Durocher & Gendron, 2011), studies evaluating the comparability level have proliferated, in a direct relationship with the increased use of the IFRS. Basi-cally, these studies follow two trends: those assessing comparability improvement after IFRS adoption throu-gh the impact on internal accounting variables and/or those from the capital markets, usually by using regres-sion calculation (Barth, Landsman, Lang, & Williams, 2012; Brochet, Jogalinzer, & Riedl, 2011; Cascino & Gassen, 2015); and those identifying the comparability level through choices made by the companies, either by using indexes (H, C, I, V, T) or frequencies. This rese-arch followed the second trend, it was grounded in the statement by Taplin (2011), i.e. harmony rates play an important role in research on IFRS implementation, as they are specifically designed to summarize the compa-rability level. The choice for T-index is justified by its potential to meet the research objectives, according to the index properties displayed in Table 1.
Table 1 Summary of key properties in the comparability indexes
PROPERTIES INDEXES
H C I V T
Considers the number of companies surveyed Yes No No Yes Yes
Considers the size of countries surveyed No No No No Yes
Sensitivity to zero frequency No No Yes No No
Considers non-disclosure Yes Yes Yes No Yes
National (N) and international (I) comparability and both (B) N N I I B
Considers multiple accounting choices No Yes No No Yes
Able to determine a probability interval No No No No Yes
Allows sectoral analysis, with weights No No No No Yes
Considers partial comparability No No No No Yes
Source: Adapted from Cole, Branson and Breesch (2008, 2009).
The T-index was created by Taplin (2004) in order to bring together in a single index all particularities of those previously proposed, besides eliminating the pro-blems of previous indexes and creating new properties.
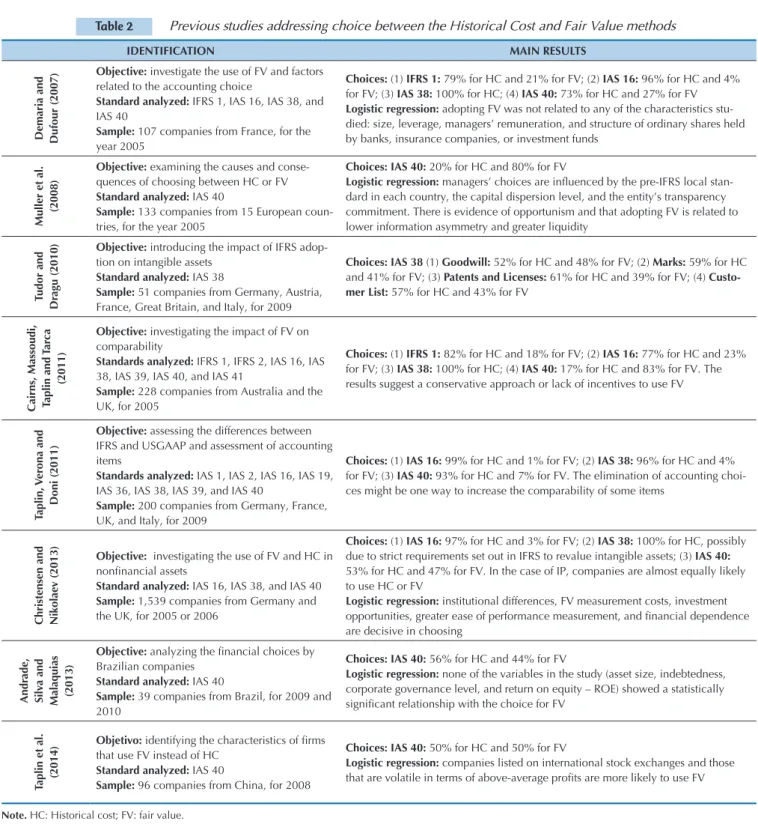
2.3 Previous Studies
method, as well as possible explanations for this choice regarding fixed assets, intangible assets, and
IP. Some of these studies are briefly illustrated in Ta-ble 2.
Table 2 Previous studies addressing choice between the Historical Cost and Fair Value methods
IDENTIFICATION MAIN RESULTS
Demaria and Dufour (2007)
Objective: investigate the use of FV and factors related to the accounting choice
Standard analyzed: IFRS 1, IAS 16, IAS 38, and IAS 40
Sample: 107 companies from France, for the year 2005
Choices: (1) IFRS 1: 79% for HC and 21% for FV; (2) IAS 16: 96% for HC and 4% for FV; (3) IAS 38: 100% for HC; (4) IAS 40: 73% for HC and 27% for FV
Logistic regression: adopting FV was not related to any of the characteristics stu-died: size, leverage, managers’ remuneration, and structure of ordinary shares held by banks, insurance companies, or investment funds
Muller et al.
(2008)
Objective: examining the causes and conse-quences of choosing between HC or FV
Standard analyzed: IAS 40
Sample: 133 companies from 15 European coun-tries, for the year 2005
Choices:IAS 40: 20% for HC and 80% for FV
Logistic regression: managers’ choices are inluenced by the pre-IFRS local stan -dard in each country, the capital dispersion level, and the entity’s transparency commitment. There is evidence of opportunism and that adopting FV is related to lower information asymmetry and greater liquidity
Tudor and
Dr
agu (2010)
Objective: introducing the impact of IFRS adop-tion on intangible assets
Standard analyzed: IAS 38
Sample: 51 companies from Germany, Austria, France, Great Britain, and Italy, for 2009
Choices: IAS 38 (1) Goodwill: 52% for HC and 48% for FV; (2) Marks: 59% for HC and 41% for FV; (3) Patents and Licenses: 61% for HC and 39% for FV; (4) Custo-mer List: 57% for HC and 43% for FV
Cairns, Massoudi, Taplin
and T
ar
ca
(2011)
Objective: investigating the impact of FV on comparability
Standards analyzed: IFRS 1, IFRS 2, IAS 16, IAS 38, IAS 39, IAS 40, and IAS 41
Sample: 228 companies from Australia and the UK, for 2005
Choices: (1) IFRS 1: 82% for HC and 18% for FV; (2) IAS 16: 77% for HC and 23% for FV; (3) IAS 38: 100% for HC; (4) IAS 40: 17% for HC and 83% for FV. The results suggest a conservative approach or lack of incentives to use FV
Taplin, V
er
ona
and
Doni (2011)
Objective: assessing the differences between IFRS and USGAAP and assessment of accounting items
Standards analyzed: IAS 1, IAS 2, IAS 16, IAS 19, IAS 36, IAS 38, IAS 39, and IAS 40
Sample: 200 companies from Germany, France, UK, and Italy, for 2009
Choices: (1) IAS 16: 99% for HC and 1% for FV; (2) IAS 38: 96% for HC and 4% for FV; (3) IAS 40: 93% for HC and 7% for FV. The elimination of accounting choi-ces might be one way to increase the comparability of some items
Christensen and Nikolae
v (2013)
Objective: investigating the use of FV and HC in
noninancial assets
Standard analyzed: IAS 16, IAS 38, and IAS 40
Sample: 1,539 companies from Germany and the UK, for 2005 or 2006
Choices: (1) IAS 16: 97% for HC and 3% for FV; (2) IAS 38: 100% for HC, possibly due to strict requirements set out in IFRS to revalue intangible assets; (3) IAS 40:
53% for HC and 47% for FV. In the case of IP, companies are almost equally likely to use HC or FV
Logistic regression: institutional differences, FV measurement costs, investment
opportunities, greater ease of performance measurement, and inancial dependence
are decisive in choosing
Andr
ade,
Silv
a and
Malaquias (2013)
Objective: analyzing the inancial choices by
Brazilian companies
Standard analyzed: IAS 40
Sample: 39 companies from Brazil, for 2009 and 2010
Choices: IAS 40: 56% for HC and 44% for FV
Logistic regression: none of the variables in the study (asset size, indebtedness, corporate governance level, and return on equity – ROE) showed a statistically
signiicant relationship with the choice for FV
Taplin et al. (2014)
Objetivo: identifying the characteristics of irms
that use FV instead of HC
Standard analyzed: IAS 40
Sample: 96 companies from China, for 2008
Choices: IAS 40: 50% for HC and 50% for FV
Logistic regression: companies listed on international stock exchanges and those
that are volatile in terms of above-average proits are more likely to use FV
Note. HC: Historical cost; FV: fair value. Source: Prepared by the authors.
By analyzing the studies, a still conservative approa-ch by managers was found out, prefering the historical cost instead of the fair value method, in almost all cases. Only at two times managers’ accounting choice for the fair value exceeded the historical cost method (Muller et al., 2008, and Cairns et al., 2011, concerning only IP). The studies also showed that certain company characte-ristics can influence financial choices.
In another trend of studies assessing comparability through its contributory effect, Brochet et al. (2011) found that mandatory IFRS adoption led to benefits
174
In order to measure comparability between the ac-counting figures generated by the local standard and the IFRS, some studies (Liu & O’Farrel, 2010; Haverty, 2006; Gray, Linthicum, & Street, 2009) showed a low comparability for most items compared.
Faced with a considerable number of studies that claim comparability is hard to be achieved, Durocher and Gendron (2011) point out that accounting standard
setters are organized around the user-driven myth, and the user himself ritually celebrates the comparability ideal and keeps in silence during the process of issuing standards, preventing this ideal to be put into question. However, IFRS adoption is a reality for many countries, and the results, due to their scope, may be reflected on the discussion the IASB needs, concerning which com-parability is desired.
3 METHODOLOGICAL ASPECTS
Table 3 IFRS mandatory adoption period for listed companies from the countries sampled
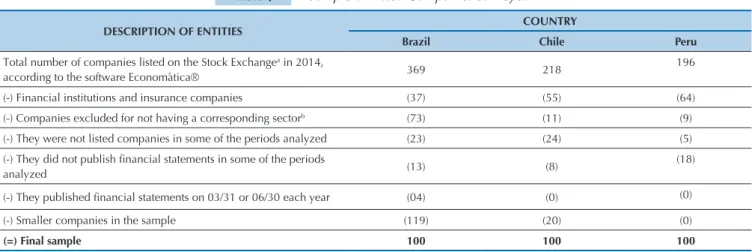
Table 4 Sample of Listed Companies Surveyed Local GAAP (before) Initial year of mandatory IFRS
adoption Post-mandatory IFRS adoption (after)
Brazil 2009 2010 2011, 2012 e 2013
Chile 2009a 2009-2010 2011, 2012 e 2013
Peru 2009 and 2010 2011 2012 and 2013
DESCRIPTION OF ENTITIES COUNTRY
Brazil Chile Peru
Total number of companies listed on the Stock Exchangea in 2014,
according to the software Economática® 369 218
196
(-) Financial institutions and insurance companies (37) (55) (64) (-) Companies excluded for not having a corresponding sectorb (73) (11) (9) (-) They were not listed companies in some of the periods analyzed (23) (24) (5)
(-) They did not publish inancial statements in some of the periods
analyzed (13) (8)
(18)
(-) They published inancial statements on 03/31 or 06/30 each year (04) (0) (0)
(-) Smaller companies in the sample (119) (20) (0)
(=) Final sample 100 100 100
a In Chile, some listed companies have been required to adopt the IFRS in 2009.
Source: Prepared by the authors.
a Brazil: Securities, Commodities, and Futures Exchange; Chile: Santiago Stock Exchange; Peru: Lima Stock Exchange. b Chile does not have companies belonging to
the industrial machinery, textiles, and vehicles and parts sectors; and Peru does not have companies belonging to the pulp and paper, software and data, transport and services, and vehicles and parts sectors.
Source: Prepared by the authors.
In order to make up the sample for this survey, only countries belonging to the GLASS were selected, where the adoption: (i) was mandatory for all listed companies; (ii) had taken place in a particular iscal year that inclu-ded at least two countries, with a view to enable measu-ring comparability in diferent economic and cultural contexts; and (iii) had taken place for at least three iscal years, so that it was possible to analyze the evolution of
their accounting practices. hus, only Brazil, Chile, Ecua-dor, and Peru were initially included in the sample. Subse-quently, Ecuador was excluded from the study, when the fact that this country does not publish notes was noticed, since they are crucial to identify accounting choices.
Data were collected for the years 2009 to 2013, cove-ring the period before, ducove-ring, and ater the year of IFRS mandatory adoption, as shown by Table 3.
The survey sample consisted of 300 listed compa-nies, represented by the 100 largest companies in each country. We examined 6,000 accounting choices, 400 of them were accounting choices by country and year. We chose to prioritize larger companies because of their
Data collection was conducted by using the softwa-re Economática® (identification of the entities listed on stock exchanges from the sample countries, the business sector, the entity size, indebtedness, profitability, and the balance of fixed assets, intangible assets, and IP), and through each company’s notes, in order to collect
accounting choices - historical cost or fair value - and audit firm.
To measure the comparability of financial statements by companies from the three countries, we resorted to the T-index calculation, created by Taplin (2004, p. 61), whose formula is:
Where:
N: it is the number of countries investigated;
M: it is the number of accounting methods analyzed.
αkl: it is the comparability coefficient between the ac-counting methods k and l;
βij: it is the comparison weighting between companies from countries i and j;
ρki: it is the proportion of companies from country i using the accounting method k;
ρlj: it is the proportion of companies from country j using the accounting method l.
The T-index ranges from 0, when two companies are not comparable, to 1, when all companies are comparable to each other (Taplin, 2010). It may be seen as the probability that two randomly selected companies have comparable accounts (Taplin, 2011). For interpreting comparability, some studies have su-ggested reference scales to identify the comparabili-ty degree of financial statements (Parker & Morris, 2001; Ali, Ahmed, & Henry, 2006), and others pro-vided their findings by interpreting index values as high, moderate, or low comparability (Taplin, 2006; Tudor & Dragu, 2010). In this study, for interpreting the comparability index, we chose to adopt the classi-fication proposed by Taplin (2006), because he is the creator of the T-index, and the rate between 0.75 and 1 was regarded as a high comparability; it was mode-rate between 0.55 and 0.74, and it was low between 0 and 0.54.
For calculating comparability, it was assumed that: (i) non-disclosure of information was excluded from comparability calculation; (ii) countries were weighted according to their size, through the total number of companies in each country, according to Economática®; (iii) for “non-applicable” practices, i.e. where there was no disclosure of the accounting choi-ce because companies do not have that particular as-set in their financial statements, such non-disclosure
was regarded as not applicable.
T-index calculation was performed by using the T-Index Calculator software, provided through e--mail message by the creator of the index, Ross H. Taplin. To do so, we adopted as a criterion the modes 1c2b3a4a, regarding comparability within each coun-try (national) and 1c2c3a4a, concerning comparabili-ty between countries (international).
To identify the reasons that gave rise to certain comparability levels, we used Logit and Probit regres-sions, since the dependent variable is a dichotomous variable (dummy). Independent variables were ou-tlined in accordance with the accounting literature, assuming that company characteristics may explain the reasons why different entities choose different accounting practices. Thus, nine research hypotheses were developed, as subsequently shown.
According to Cole et al. (2011), it is interesting to test whether audit type influences managers’ choice for accounting methods. According to them, audit firms may influence the preparation and disclosure of financial statements. According to Watts (2003), it is expected that companies audited by the so-called big four choose to use the historical cost method, because they are more conservative. Souza, Botinha, Silva and Lemes (2015) also found out that the fact that com-panies are audited by one of the big four reduced by about 20% their probability to choose the fair value method. In this way, the first hypothesis tested is: H1: There is a negative association between listed com-panies audited by the big four and choosing the fair value method for subsequent measurement of fixed assets, intangible assets, and IP.
176
with using fair value measurement. Thus, the second hypothesis tested in this research is: H2: There is a positive association between indebtedness level and choosing the fair value method for subsequent mea-surement of fixed assets, intangible assets, and IP.
Haverty (2006) ensures that a country’s accoun-ting practices reflect typical local aspects. According to Jaafar and McLeay (2007), company’s country of domicile is a significant variable to be addressed when analyzing financial choices, because accounting practices systematically reflect the rules and regula-tions in force within the country where a company is registered. Cole et al. (2011), examining which deter-minants influence managers’ financial choices, found that country is the variable that mostly influences such choices. Therefore, the third hypothesis tested in this study is: H3: Listed companies belonging to the same country of domicile tend to choose the same accounting practices in subsequent measurement of fixed assets, intangible assets, and IP.
Demaria and Dufour (2007) highlight that prepa-rers of financial statements show strong resistance to changes and, therefore, they tend to keep accounting practices adopted within previous periods. Corrobo-rating this claim, Muller et al. (2008) found that the probability that a company chooses the fair value me-thod is greater where the pre-IFRS domestic standard required or allowed measuring assets at fair value. Haller and Wehrfritz (2013) similarly noticed that when companies adopt the IFRS, they tend to keep the required accounting policies or predominantly chosen under the national GAAP. Such reasoning le-ads us to test this hypothesis: H4: The probability that a listed company chooses the fair value method is gre-ater in countries whose pre-IFRS domestic standards required or allowed measuring fixed assets, intangi-ble assets, and IP at fair value.
According to Watts and Zimmerman (1986), the existence of variable remuneration plans for direc-tors, based on financial outcomes, may encourage them to choose accounting methods that increase the value of profits for the period, in order to maxi-mize their remuneration. Hou, Jin and Wang (2014) found that the positive effects of adopting the IFRS on executive remuneration were motivated by chan-ges in profit, derived from measuring at fair value and consequent reduction in conservatism. Thus, the fifth hypothesis comes from the assumption that managers tend to choose accounting methods that increase the company's profit, in order to maximize their remu-neration, when there are incentive plans: H5: There is a positive association between incentive plans and choosing the fair value method for subsequent mea-surement of fixed assets, intangible assets, and IP.
Costa, Silva and Laurencel (2013) notice that pro-fitability indexes are employed by many users of fi-nancial statements as a measurement of company’s performance. Christensen and Nikolaev (2013) argue
that fair value measurement may be used in order to facilitate measuring entity’s performance and, as a consequence, be useful in assessing company’s ma-nagement. According to them, changes in the value of non-financial assets are useful information about company’s operational performance, because capital gain realization is often a part of the business mo-del (and historical cost does not reflect investment opportunities). As a result, the sixth hypothesis tes-ted in this study is: H6: There is a positive associa-tion between profitability and choosing the fair value method for subsequent measurement of fixed assets, intangible assets, and IP.
According to Cullinan (1999), a company’s opera-tional sector influences managers’ financial choices. Jaafar and McLeay (2007) emphasize that the choi-ce of accounting methods depends not only on the company’s country of domicile and the set of regu-lations involved, but also operational circumstances. Demaria and Dufour (2007) found that the operatio-nal sector is the main determinant so that a manager chooses the fair value method. So, we have the seven-th hyposeven-thesis tested in seven-this study: H7: The operation sector of listed companies influences the choice of accounting practices for subsequent measurement of fixed assets, intangible assets, and IP.
Watts and Zimmerman (1986) claim that large company managers tend to choose accounting me-thods that defer recognizing profits for future perio-ds. Larger companies may try hiding their size, by choosing accounting policies that minimize the assets and revenue declared, so that such information is less visible politically (Cullinan, 1999). Therefore, “the directors of large companies tend to choose accoun-ting policies that decrease outcomes to reduce their political costs” (Costa et al., 2013, p. 27), in accordan-ce with the hypothesis tested: H8: There is a negative association between company size and choosing the fair value method for subsequent measurement of fi-xed assets, intangible assets, and IP.
Since the widespread use of the IFRS over time is associated with comparability (Barth et al., 2012), which is affected by accounting choices, Jaafar and McLeay (2007) analyzed comparability evolution by observing the behavior of financial choices over the years, for various countries and sectors. Souza et al. (2015), investigating managers’ financial choices, between the cost or fair value methods regarding IP in Brazil and Portugal, found that in both countries the incidence of fair value measurement has increa-sed year after year. In this way, the ninth hypothesis tested is: H9: There is a positive association between time and choosing the fair value method for subse-quent measurement of fixed assets, intangible assets, and IP.
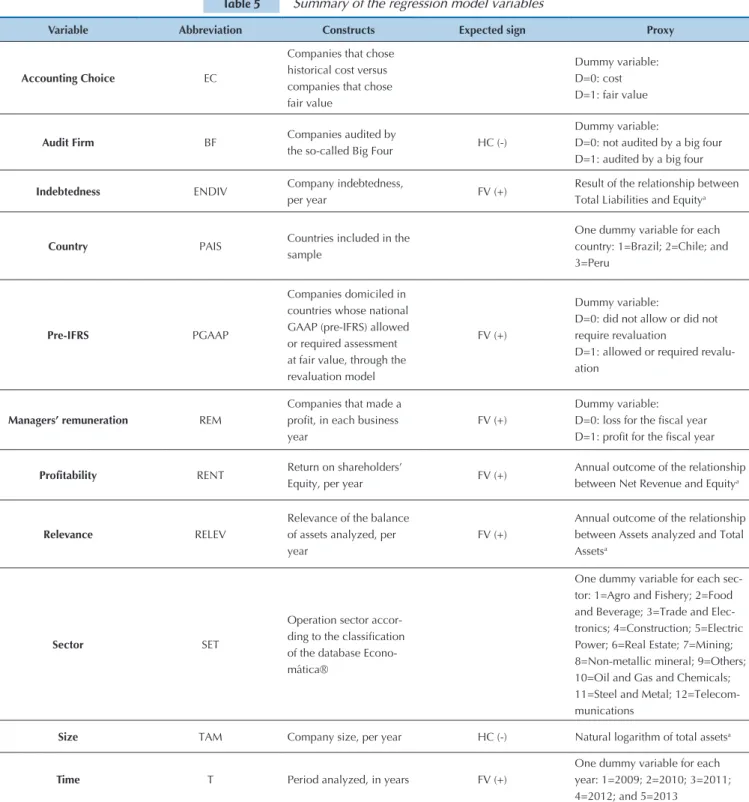
Table 5 Summary of the regression model variables
Variable Abbreviation Constructs Expected sign Proxy
Accounting Choice EC
Companies that chose historical cost versus companies that chose fair value
Dummy variable: D=0: cost D=1: fair value
Audit Firm BF Companies audited by
the so-called Big Four HC (-)
Dummy variable:
D=0: not audited by a big four D=1: audited by a big four
Indebtedness ENDIV Company indebtedness,
per year FV (+)
Result of the relationship between Total Liabilities and Equitya
Country PAIS Countries included in the
sample
One dummy variable for each country: 1=Brazil; 2=Chile; and 3=Peru
Pre-IFRS PGAAP
Companies domiciled in countries whose national GAAP (pre-IFRS) allowed or required assessment at fair value, through the revaluation model
FV (+)
Dummy variable:
D=0: did not allow or did not require revaluation
D=1: allowed or required revalu-ation
Managers’ remuneration REM
Companies that made a
proit, in each business
year
FV (+)
Dummy variable:
D=0: loss for the iscal year D=1: proit for the iscal year
Profitability RENT Return on shareholders’
Equity, per year FV (+)
Annual outcome of the relationship between Net Revenue and Equitya
Relevance RELEV
Relevance of the balance of assets analyzed, per year
FV (+)
Annual outcome of the relationship between Assets analyzed and Total Assetsa
Sector SET
Operation sector
accor-ding to the classiication
of the database Econo-mática®
One dummy variable for each sec-tor: 1=Agro and Fishery; 2=Food and Beverage; 3=Trade and Elec-tronics; 4=Construction; 5=Electric Power; 6=Real Estate; 7=Mining; 8=Non-metallic mineral; 9=Others; 10=Oil and Gas and Chemicals; 11=Steel and Metal; 12=Telecom-munications
Size TAM Company size, per year HC (-) Natural logarithm of total assetsa
Time T Period analyzed, in years FV (+)
One dummy variable for each year: 1=2009; 2=2010; 3=2011; 4=2012; and 5=2013
Note. HC: historical cost; FV: fair value
a. The variables size, indebtedness, relevance, and profitability were converted into dollars. The reference date for such values was 12/31 each year.
Source: Prepared by the authors.
Although the Logit and Probit models are similar in most of their applications, and many researchers, in prac-tice, choose the Logit model due to its comparative mathe-matical simplicity, in some situations the Probit model may be useful (Gujarati, 2004). In this way, we chose to conduct statistical tests on both models, in order to deine which mi-ght be the most suitable for this research. he robustness of the regression model was examined through three features, all observed by Hosmer and Lemeshow (2000): (i) the Hos-mer-Lemeshow test; (ii) the model’s classiication table; and
178
4.1 Comparability of Fixed Assets, Intangible
Assets, and IP
Tables 6, 7, and 8 show the national and interna-tional comparability degree for subsequent measure-ment of fixed assets, intangible assets, and IP of listed
companies from Brazil, Chile, and Peru, within the period from 2009 to 2013. The choices found for the three items were related to historical cost, estimated cost, fair value, “does not apply” and “does not dis-close.”
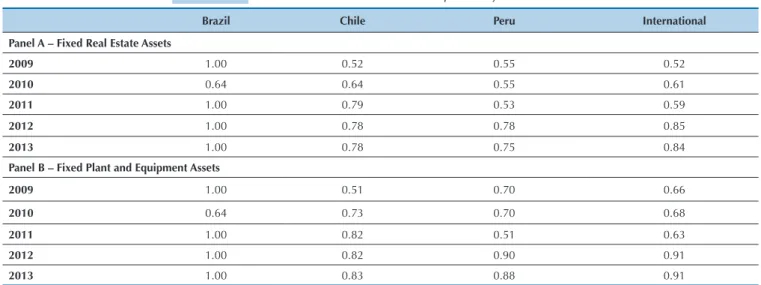
Table 6 National and international comparability of fixed assets
Brazil Chile Peru International
Panel A – Fixed Real Estate Assets
2009 1.00 0.52 0.55 0.52
2010 0.64 0.64 0.55 0.61
2011 1.00 0.79 0.53 0.59
2012 1.00 0.78 0.78 0.85
2013 1.00 0.78 0.75 0.84
Panel B – Fixed Plant and Equipment Assets
2009 1.00 0.51 0.70 0.66
2010 0.64 0.73 0.70 0.68
2011 1.00 0.82 0.51 0.63
2012 1.00 0.82 0.90 0.91
2013 1.00 0.83 0.88 0.91
Source: Prepared by the authors.
Concerning Brazil, national comparability with re-gard to fixed assets was maximum within all periods analyzed, except for 2010, first IFRS adoption year. The-se results are justified by the fact that in Brazil, before IFRS adoption (2009), only one method for subsequent measurement of fixed assets was allowed (historical cost) and after adoption (2011-2013) revaluation was banned in Brazil. As estimated cost was not prohibited by the Brazilian standards, in 2010 the comparability rate was 0.64, something which shows that if two Brazilian com-panies are randomly selected, there is a 64% chance that they have chosen the same accounting method for sub-sequent measurement of fixed assets, for 2010.
For Chile, a low/moderate national comparability was identified for 2009 and 2010 (early adoption perio-ds) and there was a high comparability for 2011 to 2013 (Table 6). These findings stem from the fact that, in early IFRS adoption periods, Chilean listed companies diver-sified their accounting choices, alternating between the historical cost, fair value, and estimated cost methods. In the following years, most entities chose to measure their fixed assets at the cost method.
Peru, before IFRS adoption (2009 and 2010), showed a moderate national comparability, because while most listed companies adopted the historical cost method, the others adopted the fair value method (Table 6). In the adoption year (2011), national comparability was low due to the possibility of subsequent measurement of fixed assets at estimated cost, in addition to two other
equally valid methods (historical cost and fair value). A larger number of accounting choices reflected lower comparability. For the years 2012 and 2013, although fair value could be used, the vast majority of entities chose historical cost.
Regarding international comparability, it was found that, although it was low/moderate in early adoption periods (2009 to 2011), since the moment when IFRS adoption became mandatory for the three countries (2012 and 2013), comparability was high (Table 6). This result derives from the fact that, despite the existence of accounting choices in Chile and Peru, most entities in these countries chose the historical cost method for subsequent measurement of fixed real estate assets, just as in Brazil by law.
The results of this research are similar to those ob-served in other studies (Demaria & Dufour, 2007; Cairns at. al., 2011; Taplin et al., 2011; Christensen & Nikola-ev, 2013), which pointed out that even with accounting choices, entities have become increasingly conservative in relation to subsequent measurement of their fixed assets. Because most of them choose the historical cost method, comparability (national and international) was high and it has increased over time.
Regarding subsequent measurement of intangible assets (Table 7), Brazil showed a high comparability in all years under analysis, due to prohibition of estimated cost in early adoption and evaluation at fair value for subsequent measurement of intangible assets.
Table 7 National and international comparability of intangible assets
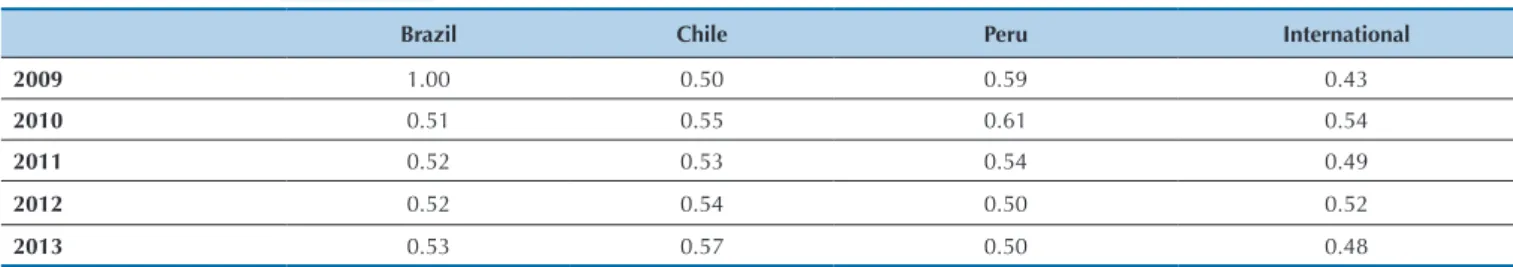
Table 8 National and international comparability of investment properties
Brazil Chile Peru International
2009 1.00 0.90 0.94 0.95
2010 1.00 0.98 0.94 0.97
2011 1.00 0.98 0.91 0.97
2012 1.00 0.98 0.97 0.98
2013 1.00 0.95 0.97 0.98
Brazil Chile Peru International
2009 1.00 0.50 0.59 0.43
2010 0.51 0.55 0.61 0.54
2011 0.52 0.53 0.54 0.49
2012 0.52 0.54 0.50 0.52
2013 0.53 0.57 0.50 0.48
Source: Prepared by the authors.
Source: Prepared by the authors.
Regarding Chile and Peru, comparability was high in every year, even before IFRS adoption and during early adoption (Table 7). Despite there are accounting choices for subsequent measurement of intangible as-sets, almost no Chilean and Peruvian listed company has chosen the fair value or estimated cost method to valuate these assets. Although the IFRS provide accoun-ting choices, the accounaccoun-ting practices adopted by listed companies in Chile and Peru (which adopted the IFRS without modifications) were similar to those adopted by listed companies from Brazil (which has forbidden the accounting choices provided by the IFRS).
As for the national and international comparability analysis over time, it was found that, even showing high values for all years under analysis, comparability has in-creased over the years.
The results of this research corroborate the findings of previous studies (Demaria & Dufour, 2007; Cairns et al., 2011; Taplin et al., 2011; Christensen & Nikola-ev, 2013), which identified that all companies (or the vast majority) adopt the historical cost method for sub-sequent measurement of intangible assets, despite the possibility of adopting the fair value method according to IAS 38. These findings may be a result of require-ments set out in the IFRS to revalue intangible assets,
due to the difficulty in identifying the fair value for this asset type, given the lack of incentives to use fair value and/or the still conservative atitude taken by the enti-ties.
The results of this study, however, are different from those found by Tudor and Dragu (2010), who, investiga-ting 51 listed companies from Germany, Austria, Fran-ce, Great Britain, and Italy, in 2009, found that a large part of them chose to recognize their intangible assets at fair value, something which led the comparability of these companies to be moderate (0.601).
In a T-index analysis for IP (Table 8), concerning Brazilian companies, in 2009 comparability was full, and after IFRS adoption (in 2010) their value declined sharply. However, we may not say that comparability decreased after IFRS adoption. The fact is that in 2009 only two entities had IP recognized and only one disclo-sed its accounting choice. The maximum comparability in 2009 was due to the fact that one listed company dis-closed its accounting choice in relation to IP measure-ment. However, from 2010 to 2013 comparability was low, because some entities chose the historical cost me-thod and others the fair value meme-thod. The existence of accounting choices enabled the adoption of diversified practices within the same country.
Chile and Peru obtained a low national comparabili-ty for virtually all fiscal years (Table 8). Just as in Brazil, low comparability was due to the fact that managers’ accounting choices for subsequent measurement of IP were divided between the historical cost and the fair value methods. As a result, international comparability was low for all business years.
180
turn, has decreased over time, due to the fact that ac-counting choices are divided between the two methods. International comparability has not increased or decre-ased, but it remained low for all years.
When analyzing previous studies on accounting choices for subsequent measurement of IP, it was found that the results are inconclusive. Some studies found that most companies chose to adopt historical cost (De-maria & Dufour, 2007; Taplin et al., 2011), others that most companies chose fair value (Muller et al., 2008; Cairns et al., 2011), and others, in turn, observed com-panies that chose both methods, in the same proportion (Andrade et al., 2013; Christensen & Nikolaev, 2013; Taplin et al., 2014). Given the nature of the asset under analysis (IP) – and the resulting “ease” to identify its fair value, when compared to the other assets –, the results
may have been divergent considering the various eco-nomic, cultural, legal, and temporal contexts where the studies took place.
In Latin American countries, accounting choices are divided between the two alternatives available, some-thing which represents low/moderate comparability, and it can be seen through the results of this research and Andrade et al. (2013).
4.2 Regression Analysis
Subsequently, Probit regressions were estimated for fixed assets and for IP, and Logit for intangible assets. Table 9 provides a summary of these regression results, for each variable under analysis, as well as the expected and observed signs, with the respective values of mar-ginal effects.
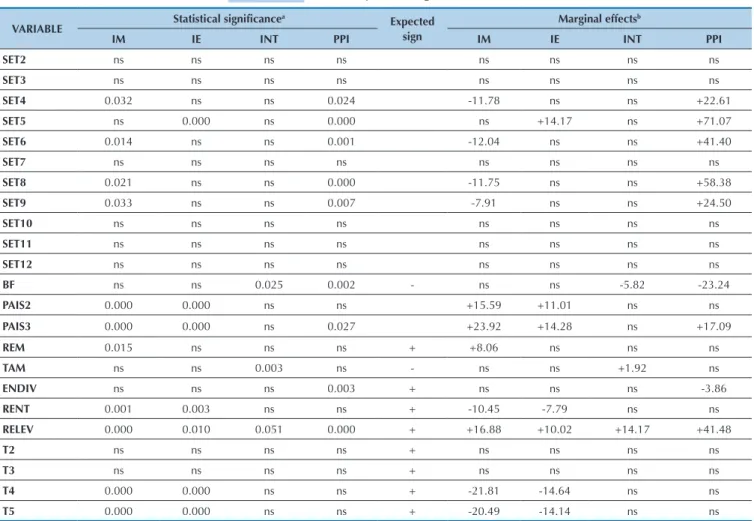
Table 9 Summary of the regression results
VARIABLE Statistical significance a
Expected sign
Marginal effectsb
IM IE INT PPI IM IE INT PPI
SET2 ns ns ns ns ns ns ns ns
SET3 ns ns ns ns ns ns ns ns
SET4 0.032 ns ns 0.024 -11.78 ns ns +22.61
SET5 ns 0.000 ns 0.000 ns +14.17 ns +71.07
SET6 0.014 ns ns 0.001 -12.04 ns ns +41.40
SET7 ns ns ns ns ns ns ns ns
SET8 0.021 ns ns 0.000 -11.75 ns ns +58.38
SET9 0.033 ns ns 0.007 -7.91 ns ns +24.50
SET10 ns ns ns ns ns ns ns ns
SET11 ns ns ns ns ns ns ns ns
SET12 ns ns ns ns ns ns ns ns
BF ns ns 0.025 0.002 - ns ns -5.82 -23.24
PAIS2 0.000 0.000 ns ns +15.59 +11.01 ns ns
PAIS3 0.000 0.000 ns 0.027 +23.92 +14.28 ns +17.09
REM 0.015 ns ns ns + +8.06 ns ns ns
TAM ns ns 0.003 ns - ns ns +1.92 ns
ENDIV ns ns ns 0.003 + ns ns ns -3.86
RENT 0.001 0.003 ns ns + -10.45 -7.79 ns ns
RELEV 0.000 0.010 0.051 0.000 + +16.88 +10.02 +14.17 +41.48
T2 ns ns ns ns + ns ns ns ns
T3 ns ns ns ns + ns ns ns ns
T4 0.000 0.000 ns ns + -21.81 -14.64 ns ns
T5 0.000 0.000 ns ns + -20.49 -14.14 ns ns
Note. IM: fixed real estate assets; IE fixed plant and equipment assets; INT: intangible assets; PPI: investment properties; ns: not significant; -: negative sign (historical cost); +: positive sign (fair value); SET2: food and beverage sector; SET3: trade and electronics sector; SET4: construction sector; SET5: electric power sector; SET6: real estate sector; SET7: mining sector; SET8: non-metallic mineral sector; SET9: other sectors; SET10: oil, gas, and chemicals sector; SET11: steel and metal sector; SET12: telecommunications sector; BF: big four; PAIS2: Chile; PAIS3: Peru; REM: managers’ remuneration; TAM: company size; ENDIV: entity indebtedness; RENT: profitabili-ty; RELEV: relevance of the balance of assets analyzed; T2: 2010; T3: 2011; T4: 2012; and T5: 2013.
a. Statistical significance: 5%; b. marginal effects in percentage;
Source: Prepared by the authors.
By analyzing Table 9, it was found that the sectors (i) food and beverage; (ii) trade and electronics; (iii) mining; (iv) oil, gas, and chemicals; (v) steel and metal;
measure-ment of their respective assets does not depend on the fact that listed companies belong to these sectors. The same was noticed when the years 2010 and 2011 were analyzed. The fact that accounting choice took place in 2010 and/or 2011 did not influence managers’ selection of the historical cost or fair value method for subse-quent measurement of fixed assets, intangible assets, and IP.
On the other hand, the variable relevance of the ba-lance of assets analyzed in relation to the baba-lance of to-tal assets was statistically significant for the four assets. It reveals that this variable tends to influence managers’ choice for a specific method, i.e. the more relevant the balance of the corresponding asset, the greater the li-kelihood that the company chooses the fair value me-thod. The same result was found by Souza et al. (2015, pp. 163-164), who, investigating entities in Brazil and Portugal, found that “the greater the importance of IP regarding total assets, the greater the likelihood that the company chooses the fair value method.”
The variables “big four,” “country,” “profitability,” and “time,” when statistically significant, showed the same signs for all surveyed assets. In turn, the varia-bles “company size,” “indebtedness,” “profitability,” and “time” showed signs different from the expected, some-thing which corroborates the claim by Martins, Pinto and Alcoforado (2012) that there are still gaps to grasp the reasons influencing managers to make a decision between the historical cost and fair value methods, sin-ce not all hypotheses were unanimously supported by evidence.
Concerning the variable big four, significant for in-tangible assets and IP, we found that it tends to con-servatively influence the entities, as pointed out by the literature (Watts, 2003; Cole et al., 2011, Souza et al., 2015). For instance, the fact that the entity is audited by a big four reduced by 23.24% the probability to choo-se the fair value method for subchoo-sequent measurement of IP. The variable “country” suggested to influence managers’ financial choices, as claimed by Jaafar and McLeay (2007) and Cole et al. (2011). This finding may be justified, among other factors (such as culture), by the influence that standards prior to the adoption (pre--IFRS) can exert on public companies, as argued by Demaria and Dufour (2007), Muller et al. (2008), and Haller and Wehrfritz (2013).
A statistically significant profitability for fixed as-sets, in turn, had a negative sign (historical cost), con-tradicting the theory (Costa et al., 2013; Christensen & Nikolaev, 2013). The latter claims that, since users have expectations about companies’ profitability, ma-nagers tend to choose the method that best contribute to achieve the performance desired by investors (fair value). However, with regard to intangible assets and IP, which were not statistically significant, these findin-gs corroborate the results of previous studies (Cole et al., 2011; Andrade et al., 2013; Costa et al., 2013; Souza et al., 2015), which found that profitability does not
in-fluence managers’ accounting choice to use the histori-cal cost or fair value method.
The variable “time” (specifically the years 2012 and 2013, for fixed assets) showed negative indexes, revea-ling that the incidence of fair value measurement has not increased over the business years. As for intangible assets and IP, in all periods investigated this variable was not statistically significant, something which sho-ws that time did not affect using the fair value method for these assets, as indicated by Souza et al. (2015). So, we may not claim that over the years (and, therefore, having more experience with the IFRS) entities tend to prefer the fair value instead of the historical cost me-thod for subsequent measurement of intangible assets and IP in relation to the countries/periods investigated.
The variable “entity size”, statistically significant for subsequent measurement of intangible assets, showed a coefficient with positive sign, something which refers to the influence for adopting fair value. These findings indicate that larger companies tend to measure their intangible assets through the fair value method and smaller companies tend to do so through the historical cost method. This fact may be justified by the practical difficulty and high cost to identify the fair value of such assets.
Regarding subsequent measurement of fixed assets and IP, the variable “size” was not statistically signifi-cant, and this confirms the findings of previous studies (Demaria & Dufour, 2007; Cole et al., 2011; Martins et al., 2012; Andrade et al., 2013; Souza et al., 2015), whi-ch identified the adoption of fair value regardless of en-tity size. However, it contradicts the idea of Jaafar and McLeay (2007) and Costa et al. (2013) that large com-panies tend to choose accounting practices that mini-mize assets trying to be less visible politically. Concer-ning listed companies in Latin America, company size did not affect managers’ choice of the historical cost or fair value method for subsequent measurement of assets and IP.
re-182
garding Latin American companies, within the period 2009-2013, this statement could not be confirmed.
As for the variable “remuneration,” which was sta-tistically significant only for fixed real estate assets, we identified there is a positive association between in-centive plans and choosing the fair value method for subsequent measurement of such assets. This finding corroborates the results of previous research (Watts &
Zimmerman, 1986; Cullinan, 1999; Hou et al., 2014), which found that the existence of variable remunera-tion plans, based on accounting results, leads adminis-trators to feel encouraged to choose accounting metho-ds that increase profit values for the period, in order to maximize their compensation.
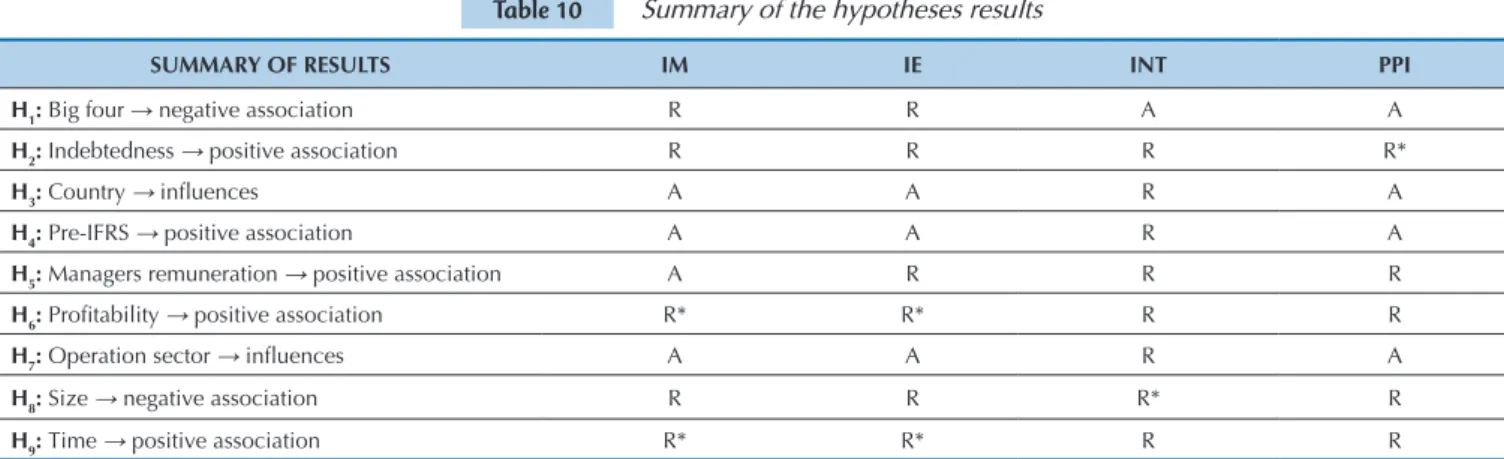
Table 10 summarizes the results of the hypotheses tested.
Table 10 Summary of the hypotheses results
SUMMARY OF RESULTS IM IE INT PPI
H1: Big four → negative association R R A A
H2: Indebtedness → positive association R R R R*
H3: Country → inluences A A R A
H4: Pre-IFRS → positive association A A R A
H5: Managers remuneration → positive association A R R R
H6: Proitability → positive association R* R* R R
H7: Operation sector → inluences A A R A
H8: Size → negative association R R R* R
H9: Time → positive association R* R* R R
Nota. IM: Fixed Real Estate Assets; IE: Fixed Plant and Equipment Assets; INT: Intangible Assets; PPI: Investment Properties; A: Accepts the hypothesis examined; R: Rejects the hypothesis examined; R*: Hypothesis rejected for having an observed signal different from the expected sign.
Source: Prepared by the authors.
hus, it was found that all variables examined have inluenced managers’ accounting choice for the historical
cost or fair value method (because all of them were statisti-cally signiicant at least in one of the assets analyzed).
5 FINAL REMARKS
Accounting choices are needed so that a faithful repre-sentation is guaranteed, while their discretionary use may reduce comparability. To contribute to this discussion, the main aim of this study was identifying the comparability degree of accounting choices for subsequent measurement of ixed assets, intangible assets, and IP of listed companies from Brazil, Chile, and Peru, subsequently checking whe-ther certain entity characteristics can inluence managers’ inancial choice for, the fair value method.
As a result, it was found that, concerning ixed assets, international comparability has increased ater IFRS adop-tion, it kept growing over time and reached high levels ater mandatory IFRS adoption by the three countries (2012 and 2013), conirming previous studies (Demaria & Dufour, 2007; Cairns at. al., 2011; Taplin et al., 2011; Christensen & Nikolaev, 2013) with regard to the fact that entities have become increasingly conservative in terms of subsequent measurement of their ixed assets.
In Brazil, the conservative attitude may be mainly ex-plained by the inluence of local legislation, because using fair value for subsequent measurement of ixed assets beca-me forbidden. In Chile, there was greater preference for the
historical cost method, despite the possibility of adopting the fair value method. In Peru, although some listed com-panies have chosen the fair value method before mandatory IFRS adoption, ater their adoption most entities began employing the historical cost method, thus becoming more conservative. When investigating whether certain company characteristics have inluenced managers accounting choi-ce, it was found that, in relation to subsequent measurement of ixed assets, country, proitability, relevance, and time in-luence managers’ inancial choices.
hus, high national and international comparability of ac-counting choices for subsequent measurement of intangible assets was due to the fact that the vast majority of organiza-tions have chosen to recognize their intangible assets throu-gh the historical cost method, in the three countries.
Despite conlicting with the indings of Tudor and Dragu (2010), the results of this research corroborate previous stu-dies (Demaria & Dufour, 2007; Cairns et. al., 2011; Taplin et al., 2011; Christensen & Nikolaev, 2013), which found that all companies (or most of them) adopt the historical cost method for subsequent measurement of intangible assets, despite the possibility of adopting the fair value method according to IAS 38. As for the investigation of potential explanatory variables, we identiied that the variables “big four,” “size,” and “relevance” inluence managers’ choices.
Regarding IP, national and international comparability has not increased ater IFRS adoption, the rates remained close to 0.50 (low comparability) in virtually all business years. hrough these indings, it is concluded that IFRS adoption, by itself, does not guarantee comparability. he fact that there are accounting options in the standard led managers’ choices to be diversiied, even within the same country. Compared to previous studies, in the Latin Ameri-can countries context, the results of this study corroborate those of Andrade et al. (2013), who found that the
compa-nies have been divided between measuring their IP through historical cost and fair value. As for regression analysis, it was found that the variables “big four,” “relevance,” “indeb-tedness,” “country,” and “operation sector” inluence mana-gers’ accounting choices for subsequent measurement of IP. Given the results, the following discussions arise, which may constitute the object of further research. First, why, al-though there is the possibility of using the fair value method for subsequent measurement of ixed assets and intangible assets, do most companies still prefer to adopt the histori-cal cost method for valuation of such assets? Second, what have managers taken into account in their decisions, since no high comparability was observed for any country and any period with regard to subsequent measurement of IP? hird, will it be possible to reconcile accounting choices with comparability, having in mind that an increased num-ber of accounting choices decreases comparability, and a decreased number of accounting choices can hinder achie-ving a reliable representation?
his research sought to provide means for preparers of accounting standards, by demonstrating managers’ deci-sion on the use of fair value measurement. Regarding the accounting literature, this study brings a special contribu-tion, investigating expertise on comparability, accounting choices, and fair value in the emerging countries context.
Ali, M. J., Ahmed, K., & Henry, D. (2006). Harmonization of Accounting Measurement Practices in South Asia. Advances in International Accounting, 19, 25-58.
Andrade, M. E. M. C., Silva, D. M., & Malaquias, R. F. (2013). Escolhas Contábeis em Propriedades para Investimento. Revista Universo Contábil, 9(3), 22-37.
Barth, M. E. (2013). Global Comparability in Financial Reporting: What, Why, How, and When? China Journal of Accounting Studies, 1(1), 2-12.
Barth, M. E. (2014). Measurement in financial reporting: the need for concepts. Accounting Horizons, 28(2), 331-352.
Barth, M. E., Landsman, W. R., Lang, M., & Williams, C. (2012). Are IFRS-based and US GAAP-based accounting amounts comparable? Journal of Accounting and Economics, 54, 68-93. Brochet, F., Jogalinzer, A. D., & Riedl, E. J. (2011). Mandatory IFRS
adoption and financial statement comparability. Contemporary Accounting, 29(3), 1373-1400.
Cairns, D., Massoudi, D., Taplin, R., & Tarca, A. (2011). IFRS fair value measurement and accounting policy choice in the United Kingdom and Australia. The British Accounting Review, 43, 1-21. Cascino, S. & Gassen J. (2015). What drives the comparability effect
of mandatory IFRS adoption. Review of Accounting Studies, 20(1), 242-282.
Christensen, H. B. & Nikolaev, V. V. (2013). Does fair value accounting for non-financial assets pass the market test? Review of Accounting Studies, 18(3), 734-775.
Cole, V., Branson, J., & Breesch, D. (2008). An analysis of methods to measure the comparability of the consolidated financial statements of the European listed companies from the viewpoint of users. Accountancy & Bedrijfskunde, 28(3), 1-31.
Cole, V., Branson, J., & Breesch, D. (2009). How to measure the comparability of financial statements? International Journal of Managerial and Financial Accounting, 1(4), 379-397.
Cole, V., Branson, J., & Breesch, D. (2011). Determinants influencing
the De facto Comparability of European IFRS Financial Statements. (Working Paper). Retrieved from http://papers.ssrn.com/sol3/ papers.cfm?abstract_id=1967001
Costa, T. A., Silva, A. H. C., & Laurencel, L. C. (2013). Escolha de práticas contábeis: um estudo sobre propriedades para investimento em empresas brasileiras não financeiras de capital aberto. Revista de Contabilidade e Organizações, 18, 25-36. Cullinan, C. P. (1999). International Trade and Accounting Policy
Choice: Theory and Canadian Evidence. The International Journal of Accounting, 34(4), 597-607.
Demaria, S. & Dufour, D. (2007). First time adoption of IFRS, Fair value option, Conservatism: Evidences from French listed companies. In 30ème Colloque de l'EAA (p. 24p). Retrieved from http://hal.archives-ouvertes.fr/docs/00/26/61/89/PDF/First_ adoption_and_fair_value_ Demaria_Dufour.pdf
Detzen, D. & Zülch, H. (2012). Executive compensation and goodwill recognition under IFRS: Evidence from European mergers. Journal of International Accounting, Auditing and Taxation, 21, 106-126.
Durocher, S. & Gendron Y. (2011) IFRS: On the Docility of Sophisticated Users in Preserving the Ideal of Comparability. European Accounting Review, 20(2), 233–262.
Fields, T. D., Lys, T. Z., & Vincent, L. (2001). Empirical research on accounting choice. Journal of Accounting and Economics, 31, 255-307.
Francis, J. (2001). Discussion of empirical research on accounting choice. Journal of Accounting and Economics, 31, 309-319. Gray, S. J., Linthicum, C. L., & Street, D. L. (2009) Have European and
US GAAP measures of income and equity converged under IFRS?: evidence from European companies listed in the US. Accounting and Business Research, 39(5), 431-447.
Grupo Latinoamericano de Emisores de Normas de Información Financiera [GLENIF] (2014). Retrieved from http://glenif.org Gujarati, D. N. (2004). Basic econometrics (4th ed.) New York:
184
Correspondence Address:
Flaida Êmine Alves de Souza
Faculdade de Ciências Contábeis, Universidade Federal de Uberlândia Avenida João Naves de Ávila, 2121, Bloco 1F, Sala 1F-248 – CEP: 38400-902 Campus Santa Mônica – Uberlândia – MG
Email: [email protected]
McGraw-Hill.
Haller, A. & Wehrfritz, M. (2013). The impact of national GAAP and accounting traditions on IFRS policy selection – evidence from Germany and the UK. Journal of International Accounting, Auditing and Taxation, 22, 39-56.
Haverty, J. L. (2006). Are IFRS and US GAAP converging? Some evidence from People’s Republic of China companies listed on the New York Stock Exchange. Journal of International Accounting, Auditing and Taxation, 15, 48–71.
Hosmer, D. W. & Lemeshow, S. (2000). Applied Logistic Regression (2nd ed.) New York: John Wiley & Sons.
Hou, Q., Jin, Q., & Wang, L. (2014) Mandatory IFRS adoption and executive compensation: Evidence from China. China Journal of Accounting Research, 7, 9-29.
International Accounting Standards Board [IASB] (2011). Conceptual Framework for Financial Reporting. Retrieved from http://www. ifrs.org
International Financial Reporting Standards [IFRS] (2014). Retrieved from http://www.ifrs.org/Use-around-the-world/Pages/Analysis-of-the-IFRS-jurisdictional-profiles.aspx
Jaafar, A. & McLeay, S. (2007). Country Effects and Sector Effects on the Harmonization of Accounting Policy Choice. Abacus, 43(2), 156-189.
Liao, Q., Sellhorn, T., & Skaife, H. A. (2012). The Cross-Country Comparability of IFRS Earnings and Book Values: Evidence from France and Germany. Journal of International Accounting Research, 11(1), 155–184.
Liu, C. & O’Farrell, G. (2010). Net Income Comparability between EU-IFRS and US-GAAP before release No. 33.8879: evidence from fifty US-Listed European Union Companies. International Journal of Business, Accounting, and Finance, 4(1), 49-62. Lo, K. (2008). Earnings management and earnings quality. Journal of
Accounting and Economics, 45, 350-357.
Martins, V. A., Pinto, M., & Alcoforado, E. (2012, outubro). Escolhas Contábeis na Mensuração de Propriedades para Investimento das Empresas Brasileiras de Capital Aberto. Anais do Congresso Nacional de Administração e Ciências Contábeis, Rio de Janeiro, RJ, Brasil, 3.
Muller, K. A., Riedl, E. J., & Sellhorn, T. (2008). Causes and Consequences of Choosing Historical Cost versus Fair Value. Retrieved from http://nd.edu/~carecob/May2008Conference/ Papers/RiedlMRS03062008.pdf
Murcia, F. D., & Werges, A. (2011). Escolhas contábeis no mercado brasileiro: divulgação voluntária de informações versus gerenciamento de resultados. Revista Universo Contábil, 7(2), 28-44.
Parker, R. H., & Morris, R. D. (2001). The influence of U.S. GAAP on the Harmony of Accounting Measurement Policies of Large Companies in the U.K. and Australia. Abacus, 37(3), 297-328.
Peng, S., & Smith, J. V. D. A. (2010). Chinese GAAP and IFRS: An analysis of the convergence process. Journal of International Accounting, Auditing and Taxation, 19, 16-34.
Souza, F. E. A., Botinha, R. A., Silva, P. R., & Lemes, S. (2015). A Comparabilidade das Escolhas Contábeis na Avaliação Posterior de Propriedades para Investimento: Uma Análise das Companhias Abertas Brasileiras e Portuguesas. Revista Contabilidade & Finanças, 26(68), 154-166.
Taplin, R. H. (2004). A unified approach to the measurement of international accounting harmony. Accounting and Business Research, 34(1), 57–73.
Taplin, R. H. (2006). A practical guide to constructing specialised indices of international accounting harmony using the harmoniser software. Financial Reporting, Regulation and Governance, 5(1), 1-28.
Taplin, R. H. (2010). Statistical inference using the T-Index to quantify the level of comparability between accounts. Accounting and Business Research, 40(1), 75-103.
Taplin, R. H. (2011). The Measurement of Comparability in Accounting Research. Abacus, 47(3), 383-409.
Taplin, R. H., Verona, R., & Doni, F. (2011, November). The process of global convergence IFRS/US-GAAP: An empirical analysis on IFRS-compliant and US GAAP-compliant financial statements. Proceedings of the Accounting Renaissance: Lessons from the Crisis and Looking into the Future Veneza, Italy.
Taplin, R. H., Yuan, W., & Brown, A. (2014). The use of fair value and historical cost accounting for investment properties in China. Australasian Accounting Business and Finance Journal, 8(1), 101-113.
Tudor, A. T. & Dragu, I. M. (2010). Impact of International Financial Reporting Standards on Accounting Practices Harmonization within European Union – Particular Case of Intangible Assets. Annales Universitatis Apulensis Series Oeconomica, 12(1), 191-206.
Watts, R. L. (1992). Accounting choice theory and market-based research in accounting. British Accounting Review, 24, 235-267. Watts, R. L. (2003). Conservatism in accounting part I: Explanations
and implications. Accounting Horizons, 17(3), 207-221. Watts, R. L. & Zimmerman, J. L. (1986). Positive accounting theory.
Upper Saddle River: Prentice Hall.
Yip, R. W. Y., & Young, D. (2012). Does Mandatory IFRS Adoption Improve Information Comparability? The Accounting Review, 87(5), 1767-1789.
Zeff, A. S. (2007). Some obstacles to global financial reporting comparability and convergence at a high level of quality. The British Accounting Review, 39, 290-302.