Determinants of Bond Spread and Credit Default Swap: Why are they
different? The case of Petrobras
Fernando Nascimento de Oliveira
Ibmec, Departamento de Economia, Rio de Janeiro, RJ, Brazil
Renan Feuchard Pinto Petrobras, Rio de Janeiro, RJ, Brazil
Received on 04.07.2015 – Desk acceptance on 05.26.2015 – 2nd version accepted on 11.24.2015.
ABSTRACT
In this article, we study the main determinants of Petrobras’ credit risk, measured through asset swap spreads (ASWs) and credit default swaps (CDS), replicating the main papers on the theme and analyzing whether the two products price risk differently. Our results allow us to conclude that, curiously, firm-specific (microeconomic) variables are little or no significant to explain the discrepancy between the markets, and that a large part of the difference between them (also known as the CDS-Bond Basis) may be explained by the response of each product to macroeconomic variables. The main contribution of this article is being the first in the literature addressing the theme credit risk or liquidity of a Brazilian company, from the viewpoint of bond spreads and CDS, traded in the foreign market, besides discus-sing why there is a difference between them.
1 INTRODUCTION
The literature on the subject is vast. Among the ma-jor works, Blanco, Brennan, and Marsh (2005) stands out, who, using an extensive database, analyzed a pa-nel of several companies and found that, in the long run, there was equilibrium between the two markets, for most of them. Moreover, they showed that, syste-matically, bond spreads were lower than CDS, highli-ghting some difficulty in the market to arbitrate such discrepancies. They conclude that macroeconomic va-riables (interest rates, term structure, capital market return, and implied volatility of the capital markets) have a greater immediate impact on bond spreads than on CDS, and microeconomic variables (specific to each company) have a greater immediate impact on CDS than on bond spreads.
Also in order to study why the two markets respond differently to changes on the credit risk of companies, Zhu (2004) directly studied the basis (the difference between CDS and bond spread), by using a different approach to the liquidity proxy and trying to analyze whether one security anticipates or reacts to rating events differently from the other. They also concluded that, in the long run, the two markets tend to price risk similarly ending the arbitrage and reaching a positive conclusion in this regard.
Recognizing that there is a difference between the two markets, indeed, and identifying arbitrage oppor-tunities between them, Trapp (2009) worked with fi-xed effects to find evidence that the size of the basis is closely linked to microeconomic (such as credit risk and liquidity) and macroeconomic variables (such as market conditions), too, but the author failed to find long-term convergence between the two markets, relia-bly, for pool of companies used.
Finally, Lin, Liu and Wu (2011) used a structural model to split the company credit risk into two parts: default and non-default, trying to explain in the lat-ter what corresponds to liquidity and taxes and using CDS as a key variable in the analysis. In their results, analyzing series of Money Market Mutual Funds assets, specific liquidity and market rates, counterparty risk, and corporate issuance, they found evidence that there is great importance in taxes and in specific and market liquidity to explain the non-default portion of credit risk.
The remainder of this paper is organized as follows: in Section 2, we review the major papers on the sub-ject and how they may be compared to our results. In Section 3, we address the database used; in Section 4, we present the models used to analyze the sensitivity of bond spreads, CDS, and basis to the explanatory va-riables, as well as the results. Finally, in Section 5, we present the conclusions of this paper.
After the 2008 crisis, the international fixed-income market has been considerably expanded, mainly driven by the rapid fall in U.S. Treasuries rates. Many com-panies from emerging markets took advantage of the excellent time to expand their investments, with access to cheaper credit, including Brazilian companies, such as in the case of Petrobras. Among the various debt ins-truments available, debentures issued internationally, known as bonds, are very common and popular, given their large market and easy access to credit.
This expansion in international liquidity took place at a very timely moment for Petrobras. After the disco-very of oil in the pre-salt layer, its investment plan (An-nual Business and Management Plan - PNG) more than doubled, along with its indebtedness. As bonds have become the main trigger of company debt, studying the variables that most influence the risk premium (which we also name as credit spread), charged by investors who are interested in the Petrobras risk, shows to be of great value for a professional working with this kind of instrument.
In this regard, this paper aims to examine which fac-tors influence the various credit risk markets, including bond spread and credit default swap (CDS), replicating the main studies on the subject for the specific case of Petrobras, in an attempt to analyze whether the two products price risk differently and, if so, why.
We use a wide daily database of CDS and bond spre-ads, largely extracted from Bloomberg, starting in Fe-bruary 2009 and ending in December 2013. In addi-tion, we use a range of relevant explanatory variables, recommended by the literature on the subject, such as market and equity returns, market and equity volatility, company rating, dummies, Treasuries, among others.
The results allow us to conclude that the two pro-ducts, in fact, price the credit risk of Petrobras differen-tly. Among the main explanations for this discrepancy (which, strictly speaking, should not exist, if the two markets price risk efficiently) there is a rather stronger reaction of bond spreads to macroeconomic variables, at first, such as Treasuries and term structure of interest rates. Microeconomic variables, such as equity return, debt, rating and issuance dummies, have shown to have little or no significance in explaining the differen-ce between the two markets.
2 LITERATURE REVIEW
he literature on determinants of corporate bond spreads is relatively new. he most relevant papers date back to the mid-1990s, with Longstaf and Schwartz (1995), which is regarded as the irst great work in this matter. he authors used a structural model to price cor-porate debt incorporating components of default risk and interest rates. he view that corporate risk might be intrinsically related to risk-free interest rates has been well-documented and corroborated by Dufee (1998) and Loncarski and Szilagyi (2012), who found a strong ne-gative relationship between corporate spreads and Trea-suries. In this regard, our results are consistent with the literature, explaining most of the Petrobras’ spreads.
Since then, many studies have taken place, trying to incorporate other variables that may be relevant to ex-plain a company’s credit risk. he idea that credit risk could be divided into a default and non-default portion has been studied by Elton, Gruber, Agrawal and Mann (2001).
he use of CDS to explain the default portion of the spread was an innovation introduced by Longstaf, Mithal and Neis (2005), who showed that 57% of the variation in spreads could be explained by a default component. his innovation gave rise to a relevant literature analyzed in this article: the study of the diference between credit risk measured by a company’s bonds and its CDS.
As shown by Duie (1999), both bond spread and CDS should be equal so that there should be no arbitra-ge between them. Dufee (1999) demonstrates that the best bond spread to use when comparing to CDS is the loating rate bond’s spread over LIBOR. However, bonds with loating rates are not commonly found in the ma-rket. Houweling and Vorst (2002) state that a company’s CDS and a ixed coupon bond’s spread will equal if the payment dates are the same, and the recovery value is a constant fraction of the bond‘s face value. Furthermore, a theoretical tradable swap, where there is an exchange of ixed rates for loating rates (the asset swap spread - ASW), can be made and it is the best spread to be used in any case, according to Felsenheimer (2004). De Wit (2006) and Trapp (2009) also followed this thought in their studies. he literature on the subject, however, is far from consensus in this regard.
But, then, what might lead company’s spreads and CDS to be so diferent and disparate? It would make sense to include in the model more microeconomic measures, directly related to company characteristics. he liquidity (or illiquidity) component of bonds and CDS might be a major factor explaining the diference between them.
However, inding the proxies for liquidity can be quite a challenge. Many authors ignore the liquidity issue in CDS, such as Longstaf et al. (2005) and Blanco et al. (2005), and claim that in the derivatives market there is no need for ballasts and that restrictions on short selling are none-xistent. However, Lin et al. (2011) disagree, showing that bid and ask spreads in CDS quotes are great indications that liquidity may also explain some part of CDS.
Speciic and market liquidities as important factors in explaining spreads and bonds’ and CDS’ rates are tho-roughly documented by Geske and Delianedis (2001), Schultz (2001), Zhu (2004), De Wit (2006), De Jong and Driessen (2007), Loncarski and Szilagyi (2012), Bai and Collin-Dufresne (2013), Helwege, Huang and Wang (2014), and, somehow, by Chakravarty and Sarkar (1999). Elton et al. (2004) go further and state that the most direct liquidity measurement is the diference between bid and ask rates from a spread to another. Some authors claim that speciic liquidity explains just some of the spread, and the reaction of each company to market liquidity is what best explains the liquidity component (Collin-Du-fresne, Goldstein & Martin, 2001). As we will see in our study, interestingly, irm-speciic components have little or no signiicance in explaining Petrobras’ credit spreads.
here is also the possibility that an implicit option exists in CDS contracts, in which, in case of a credit event and CDS trigger, the buyer could go and buy the cheapest bond on the market to deliver to the CDS sel-ler. his option, named as cheapest-to-deliver option (CTD), would tend to make the CDS price rise, increa-sing the basis. Although diicult to measure, this option has great explanatory power in relation to the CDS value or the diference between the two securities, as noticed by Blanco et al. (2005), De Wit (2006), Ammer and Cai (2007), Elizalde, Doctor and Saltuk (2009), Nashikkar, Subrahmanyam and Mahanti (2011), and Bai and Collin--Dufresne (2013). Just as in our study, Zhu (2004) assigns little value to this option. As we will see later, the great explanatory power of our model and changes in the CDS market in recent years leave little room for this option to exist or to be relevant.
Other variables, such as rating, share and market vo-latility, and share and market return are also used and achieve signiicant results in Chakravarty and Sarkar (1999), Gwangheon and Warga (2000), Collin-Dufresne, Goldstein and Martin (2001), Longstaf et al. (2005), and Galil, Shapir, Amiram and Benzion (2014), among others mentioned above. We analyze these variables in our rese-arch, but they show little explanatory power herein.
3 DESCRIPTION OF THE DATA USED
We use an extensive daily database, covering the period from February 11, 2009, to December 31, 2013. Sample onset took place on February 11, because it
rele-vant rating agencies in this market (Standard & Poor’s, Fitch, and Moody’s). The investment grade is relevant in this case, as we will explain later on, having in mind that its investor base is completely different, which may affect the trading market of this asset and, as a consequence, its interest rate level. It was decided to exclude the year 2014, because it was an unusual year for the company, with political, economic, and sports events that would be held in the country and could affect its credit and the trading of its securities.
The reason for choosing Petrobras is justified, be-cause, unlike the U.S. and European markets, no other company is so relevant regarding the issuance of bon-ds when controlling for geography (issuer country/ region), affecting the secondary market with such big deals. Moreover, it is not uncommon to find scarce pricing sources for other Brazilian companies’ secu-rities, precisely due to lack of liquidity in bonds se-condary market. Since this paper also aims to study the CDS market, the issue of analyzing other Brazilian companies becomes even greater. We argue, throu-ghout the article, that Petrobras’ CDS has problems concerning liquidity and few pricingsources. Thus, in-cluding other companies in the analysis and providing a panel with the amount and quality of data similar to Petrobras might make the exercise unfeasible.
For its most part, data used herein was obtained
from the Bloomberg LLP database, which granted us access to a considerable range of pricing sources, and is an excellent service in terms of conveying informa-tion, widely disseminated and used in the market.
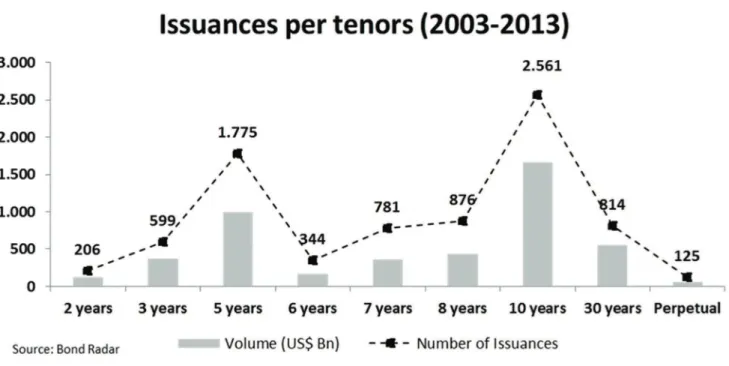
First, we collected data for two reference periods in order to analyze credit risk: 5 years and 10 years. Be-tween them, the 5-year period is more widely used in the literature, however, we also analyze results for the 10-year period, as this is the period more commonly used to issue bonds in the U.S. market (as shown in Figure 1), as well as by Petrobras.
As our aim was analyzing bonds that stand as re-ference for each period, market practice consists on using the current spreads of the last bonds issued as the reference for a new issuance considering similar tenors to the ones of the new issuance.
By doing so, we built a daily time series with Pe-trobras’ dollar bonds, whose time to maturity was as close as possible to the reference period, giving prefe-rence to most recent bonds. At each new issuance for the reference period, the old bond would be exchan-ged by the new one. For the 5-year period we used 4 bonds and for the 10-year period we used 5 bonds. Let us notice that all bonds used in the sample are bullet bonds, i.e. with fixed rates coupons payable semi-an-nually, and payment of the principal only at maturity and no calls.
Figure 1 Issued volume of corporate bonds in dollars in the U.S. market Source: Bond Radar
3.1 Bond Spreads
Credit spreads of a bond are always measured as a risk premium to be paid at a rate regarded as risk-free.
Thus, different spread types are obtained to try reflec-ting company credit risk priced in a bond.
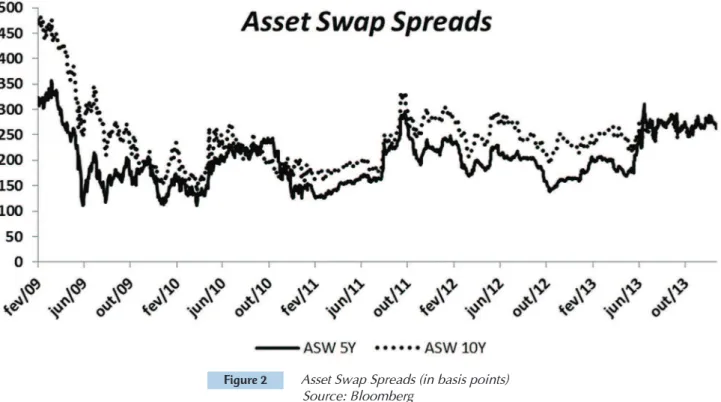
In the extensive literature on the theme, the most frequently used spreads take LIBOR as a reference for risk-free rate. Like Felsenheimer (2004), De Wit (2006), and Trapp (2009), we used as a spread for our bonds the ASW, as shown in Figure 2. Among other advantages, this spread type controls, as a consequen-ce, credit risk, taking the entire LIBOR curve as a ba-sis, as well as being directly negotiable on the market if the holder of some bond with a coupon of fixed pay-ments wish to exchange it (do the swap of his securi-ty) at a floating rate (in this case, LIBOR). Thus, it is possible to separate the credit risk from the interest rate risk. Memani, Foux, Jersey and Zucker (2005)
ar-gue that the bias of using the ASW of a bond with a fixed coupon rate (and not a pure bond with floating interest rate) gets smaller and more negligible as the spread becomes lower.
The bonds used in our sample have great liquidity (taking into account the amount of contributors, pri-ces, and other Brazilian companies). Thus, we chose the price source provided by Bloomberg, the so-called CBBT (Composite Bloomberg Bond Trader), which considers only the estimates that are “feasible” if some investor chooses to buy the bond at the time observed. If there are no estimates in the day for that price sour-ce, we used the BGN (Bloomberg Generic), which is, roughly speaking, an average of all estimates provided to Bloomberg for the asset, either feasible or not.
Figure 2 Asset Swap Spreads (in basis points) Source: Bloomberg
3.2 Credit Default Swaps
The Credit Default Swaps (CDS) are widely known derivatives, much traded in the over-the-counter ma-rket. In CDS, what is traded consists in a protection if an entity (either a company or country) does not observe its commitments to creditors (default), opera-ting as an insurance. Thus, it is an agreement signed by the seller and a buyer, in which the CDS seller agrees to compensate the buyer for an occasional company default (in this case, Petrobras) within a previously agreed period. The buyer of CDS, on the other hand, pays a premium (spread), on a quarterly basis, to the CDS seller by such insurance, until a default occurs or the CDS agreement terminates, whichever comes first.
This spread is typically measured on 3-month LIBOR. So, CDS is also a company credit risk measure, and 5-year agreements are the most commonly used.
becomes chargeable as a result of it; (ii) Failure to pay: failure to pay the values owed for basis assets, after periods defined in the agreement; (iii) Bankruptcy: includes insolvency, appointment of interventors, etc; (iv) Moratorium: authorities impose moratorium on the entity; and (v) Restructuring: change in the terms previously agreed between creditors and entities, due to deteriorating debtor’s financial conditions, noticing, among others, reduced interest rates and the principal previously agreed and their payment deadlines.
As shown by Blanco et al. (2005), in case of default, CDS settlement takes place in two ways: (i) physical, when the seller pays the buyer the notional value of the agreement and the latter delivers the seller the as-set (bond) in default; or (ii) financial, when it is ba-sed on the market value after the bond default and this amount is deduced from the notional value of CDS agreement.
Let us notice, thus, that CDS agreements have an implied option widely documented in the literature, as it can be seen in Elizalde et al. (2009), Ammer and Cai (2007), and Blanco et al. (2005). In case of physi-cal settlement of a CDS agreement, protection buyers could go to the market, see which asset (within the set of assets previously agreed by contract) would be che-aper to buy, and deliver it to the CDS seller. This is the so-called CTD and it tends to lead spread (or CDS price) to get higher in order to compensate the seller, positively influencing the basis.
As it is a derivative, this market does not necessa-rily have fixed ballast in a single basis asset. There is evidence, according to some banks with whom we had contact, that the total volume of most CDS agreements exceeds the amount to be paid for the assets which they refer to. In view of any settlement problems, in the event of a company default, the market entities/ administrators (Markit and Creditex) created a new way to carry out settlement if a credit event occurs. Administrators mediate which assets will ballast CDS operations and organize an auction (Credit Event Auc-tion) with CDS buyers to set the price of these assets, then they can opt for physical or financial agreement settlement.
3.3 Petrobras’ CDS
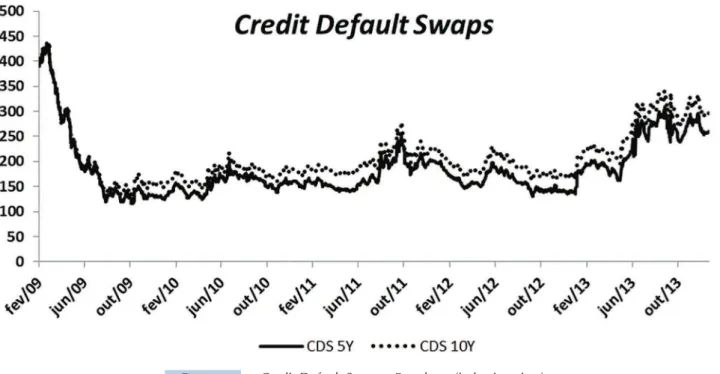
Since this is an over-the-counter market, transpa-rency is very limited, both in volume and in contribu-tors to CDS estimates. In the case of Petrobras, there are two CDS agreements more frequently traded by the market - 5 years and 10 years -, where the first is more frequently used, according to some banks, as shown in Figure 3.
For the 5-year CDS we got 4 estimate contributors: JP Morgan, Morgan Stanley, Credit Suisse, and CMA DataVision. For the 10-year CDS, there were 3 estimate contributors: JP Morgan, Credit Suisse, and CMA Da-taVision. Only CMA DataVision provided estimates for the purchase and sale points.
Figure 3 Credit Default Swaps – Petrobras (in basis points) Source: CMA, JP Morgan, Credit Suisse and Morgan Stanley
3.4 Macroeconomic Variables
Among the variables used that are not intrinsic to Petrobras, that is, which are at a macroeconomic level,
we have listed the following.
which are the market reference bonds for the periods mentioned above, and used by the market as the U.S. Treasury reference rates. Approximately, every three months, the U.S. Treasury issues new stocks of Trea-suries for maturities of 2, 3, 5, 7, 10, and 30 years, re-garded as “active” Treasuries. Treasuries prior to these are immediately regarded as off-the-run (“inactive”), losing a part of their liquidity. To calculate the slope of the yield curve, we use the difference between the rates of Treasuries on-the-run maturing in 10 years and 1 year.
We used a daily series of the S&P500 to calculate the average daily market return for U.S. assets. Similarly, we downloaded the daily series of implied S&P500 vo-latility, obtained from the Bloomberg services, which is measured by the weighted average volatility of out-of--money stock purchase and sale options, whose matu-rity is closer to the reference date, at least 20 working days.
Through the bond issuance data service (Bond Radar), we collected data on the volume of corporate bonds publicly issued on the day around the world, in dollars.
Another important analysis variable is the so-called “Counterparty Risk.” When an investor is interested in a bond issued by an entity, he simply purchases it through his bank/broker of choice, observing the pri-ces offered for it. In this case, the investor is only sub-ject to the risk that the entity does not comply with its obligations at the time of paying for the interests and principal due.
However, when the same investor buys a CDS agre-ement to hedge the risk that the company does not pay him, he is somehow subject to a risk he did not face before: the counterparty risk. The idea is that, although this market is dominated by large banks with a solid financial status, there is always a risk that the coun-terparty in the agreement (the bank) does not meet its obligations. There is, therefore, the Counterparty Risk. Like Taylor (2009) and Lin et al. (2011), we used as a proxy for this risk the difference between the U.S. ma-rket repurchase rate (a rate at which the Federal Reser-ve or another bank agrees to repurchase a giReser-ven goReser-ver- gover-nment security within a future period) and LIBOR, in dollars.
In the case of market liquidity, there are numerous indexes that attempt to capture it in a particular ma-rket. The very term “liquidity” is widely known, but very difficult to be priced, as there is no consensus on the best way to measure it. In this paper, we use the pro-xy defined by Lin et al. (2011), Longstaff et al. (2005), Blanco et al. (2005) and Collin-Dufresne et al. (2001), which consists in the daily difference between the in-terest rates of on-the-run and off-the-run 10-year U.S.
Treasuries.
Finally, we downloaded a monthly time series of va-riation in the balance of U.S. mutual funds, provided by the Investment Company Institute (ICI), U.S. associa-tion of investment companies.
3.5 Microeconomic Variables (Company-Specific)
he variables used that are intrinsic to Petrobras, i.e. they are at a microeconomic (speciic) level, are shown below.
We used a daily series of the average price of Petro-bras’ ADR in dollars to calculate its daily return. Just as in the macroeconomic variable, we downloaded the dai-ly series of implied volatility of the stock obtained from Bloomberg, which is measured by the weighted average volatility of stock options purchase and sale out-of-mo-ney and with maturity closer to the reference date, at least 20 working days.
he inclusion of a variable that measures company sto-ck behavior is justiied by the characteristics of bonds, in a way a hybrid product that has a combination of risk-free government debt and risk of the company that issued the bond, as shown by Weinstein (1985). When prospects in-volving the company become better, its default probabili-ty is reduced, and the value of bonds and stocks increases. We also downloaded a daily time series of the volume of Petrobras’ bonds in circulation, in dollars, traded in the market, within the period under analysis.
Similarly, concerning the information above as for the market liquidity indexes, there is little consensus on the indexes to be used in order to determine the liquidity of an asset. Helwege et al. (2014) conducted an extensive analysis of several proxies of liquidity for corporate bond spreads.
In our model, like Blanco et al. (2005) and Zhu (2004), we use a simple measurement, but widely known as a pro-xy, formed by the diference between the purchase and sale points of spreads, both for the bonds and CDS un-der analysis, so that the higher the index, the less market liquidity. his choice as a proxy may be justiied, since liquidity is an important determinant of such a diferen-ce, as shown by Chakravarty and Sarkar (1999), and also used by Bai and Collin-Dufresne (2013) as the most di-rect measure for determining it. Unfortunately, it was not possible to extract from the Bloomberg database the his-tory of ASW purchase and sale points of Petrobras’ bon-ds. We used, instead of it, the purchase and sale points of bond Z-spreads, which have a construction methodology slightly diferent, but they are very connected and close. We also tested, as robustness for the bonds, the liquidity index indicated by Helwege et al. (2014) as the most sui-table (a inding not shown in the sui-tables), changing it to compensate the change in volume in circulation of each bond used in our sample:
x Qj,t x 1.000.000 1
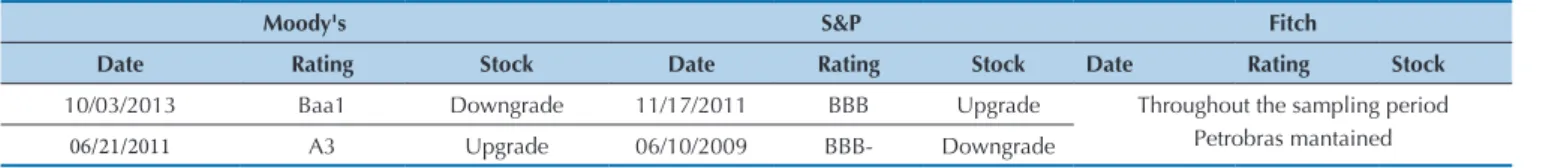
Table 1 Evolution of Petrobras’ Rating
Moody's S&P Fitch
Date Rating Stock Date Rating Stock Date Rating Stock
10/03/2013 Baa1 Downgrade 11/17/2011 BBB Upgrade Throughout the sampling period Petrobras mantained
06/21/2011 A3 Upgrade 06/10/2009 BBB- Downgrade
Source: Prepared by the authors.
Where Maxj(pj,t)is the highest price of the bond j
on the day t; Minj(pj,t)is the lowest price of the bond j on the day t; pj,t is the average price traded for the
bond j on the day t; Mj,t is the volume in circulation of
the bond j, on the day t, in million dollars; and Qj,t is the approximate volume traded on the day of the bond j on the day t, informed by Bloomberg, obtained from TRACE.
Figure 4 Liquidity indexes for the 10-year period (in basis points) Source: Bloomberg, CMA, JP Morgan, Credit Suisse, and Morgan Stanley
We also used a dummy that takes value 1 when a new Petrobras’ bond is issued on the day, within the period under analysis, and value 0 otherwise.
We also added rating dummies introduced by Zhu (2004), which take value 1 for the event of a decrea-se in rating (downgrade), value 0 if there is no chan-ge, and -1 for an increase in rating (upgrade). Thus, we set up five dummies to try capturing whether any of the products (CDS or ASW) anticipates or behaves differently in relation to rating changes. With this, the variables used are: DUMB6190 (taking the values abo-ve when there is a rating change between days [t+61, T+90]), DUMB3160 (when there is a rating change be-tween days [t+31, t+60]), DUMB0130 (when there is a
rating change between days [t+1, t+30]), DUMA0110 (when there is a rating change between days [t-1, t-10]), and DUMA1130 (when there is a rating change between days [T-11, T-30]).
Throughout the review period, Petrobras’ bonds had an investment grade rating granted by the three major market rating agencies: S&P, Fitch, and Moody‘s. Rating levels and the dates in which Petrobras received an up-grade or a downup-grade are shown in Table 1. Like Zhu (2004) and Trapp (2009), we reclassified the rating ta-bles of these agencies by assigning value 1 to the highest rating, 2 to the second highest, and so on. To calculate the “total” rating of Petrobras each day, we averaged the three ratings, rounding up, in order to obtain an integer.
Spreads are useful for three basic reasons: (i) they are indicative of default probabilities; (ii) they help
set-ting an extra fee to be paid to credit buyers, in addition to the risk-free rate; and (iii) they assist in negotiating
risk in CDS (in relation to ASW). So, every day we have a CDS with a different termination date, while in the case of ASW, as we analyzed the same bond every day (at least until a new issuance, when this reference bond is exchanged in our sample), maturity will always be fixed, with a term until maturity (time-to-maturity) every day shorter.
Thus, for fair calculation of basis, we interpolate and extrapolate the 5 and 10-year CDS, linearly, for the same maturity of the reference bond on each day of observation.
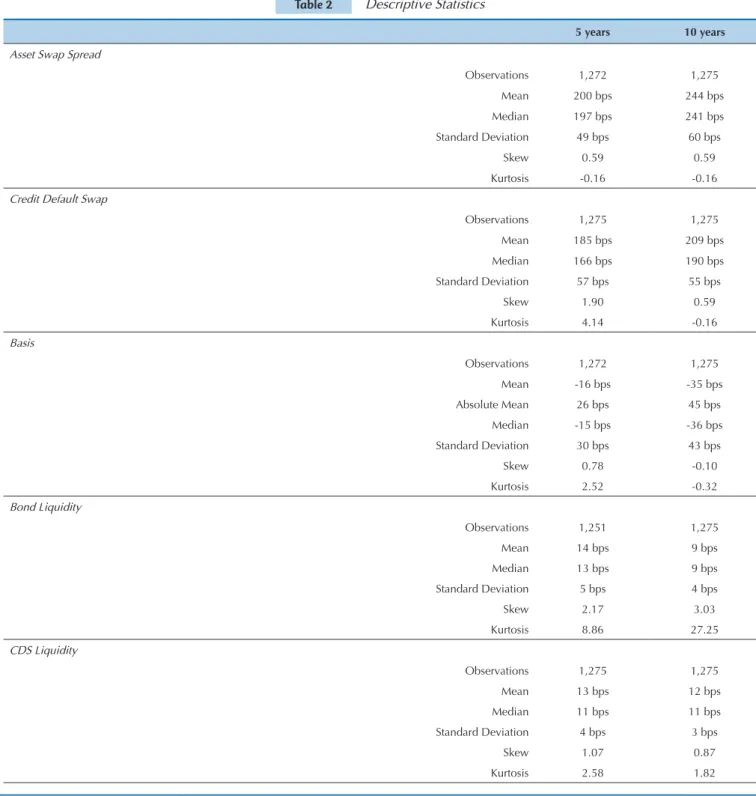
Table 2 shows the descriptive statistics for the main series used, by separating them in terms of 5 and 10 years. The exception is Market Liquidity, for which we used only data from 10-year Treasuries.
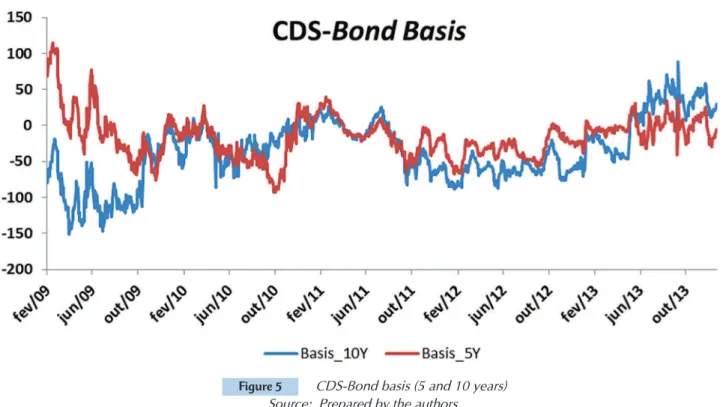
and pricing corporate bonds (Elizalde et al., 2009). In this paper, our interest was studying both the variables that most impact ASW and CDS and, as a consequen-ce, what make them different. As we have seen in the analysis of the two series, they are historically distinct, providing evidence that both markets react differently to changes in credit risk.
It is customary, both in the literature and in the market, to name this difference as “CDS-Bond Basis” (or simply “basis”). So, for calculating the basis his-torically, it would not be correct to only extract ASW from the CDS price, since CDS has a fixed term until maturity (in our case, it is 5 and 10 years, with agree-ments fixed on a daily basis for the same period), be-cause that way we might be overestimating the credit
Table 2 Descriptive Statistics
5 years 10 years
Asset Swap Spread
Observations 1,272 1,275
Mean 200 bps 244 bps
Median 197 bps 241 bps
Standard Deviation 49 bps 60 bps
Skew 0.59 0.59
Kurtosis -0.16 -0.16
Credit Default Swap
Observations 1,275 1,275
Mean 185 bps 209 bps
Median 166 bps 190 bps
Standard Deviation 57 bps 55 bps
Skew 1.90 0.59
Kurtosis 4.14 -0.16
Basis
Observations 1,272 1,275
Mean -16 bps -35 bps
Absolute Mean 26 bps 45 bps
Median -15 bps -36 bps Standard Deviation 30 bps 43 bps
Skew 0.78 -0.10
Kurtosis 2.52 -0.32
Bond Liquidity
Observations 1,251 1,275
Mean 14 bps 9 bps
Median 13 bps 9 bps
Standard Deviation 5 bps 4 bps
Skew 2.17 3.03
Kurtosis 8.86 27.25
CDS Liquidity
Observations 1,275 1,275
Mean 13 bps 12 bps
Median 11 bps 11 bps
Standard Deviation 4 bps 3 bps
Skew 1.07 0.87
* Market liquidity - we used only data from 10-year Treasuries Source: Prepared by the authors.
4.1 Estimating Asset Swap Spread and Credit
Default Swap
There are in the literature numerous structural mo-dels that attempt to explain what constitutes or mostly impacts company credit risk, as shown in Section 2. In this part of the paper, we try to replicate the model pro-posed by Blanco et al. (2005), applying it to the case of Petrobras and adding some variables that are relevant to the specific case of the company.
Long-term interest rates (in the model, 10-year on--the-run U.S. Treasuries) are an important market sen-sitivity factor and funding cost boundary for compa-nies accessing the international market in dollars. On the one hand, Treasuries with higher rates may indicate an environment of tranquility and strength in finan-cial markets, with lower credit spreads reflecting lower risk. Moreover, as shown by Longstaff and Schwartz (1995) and cited by Blanco et al. (2005), a higher level of interest rates can increase the neutral drift to risk in the company’s valuation process, as it increases the ratio between intrinsic value of its assets (V) and the threshold at which a financial stress occurs (K). Thus,
its neutral risk default probability might tend to be lower, resulting in lower spreads. Duffee (1998) also found similar results for short Treasuries.
However, we should notice the possibility of a con-trary motion. When Treasuries are lower, the interest rates of all securities traded in spread over Treasury tend to decrease. Investors interested in absolute re-turns and those who have a certain flexibility reduce investments in less risky bonds (AAA, AA ratings), and invest their resources in securities that still hold an in-vestment grade, but riskier (A and BBB ratings, such as in the case of Petrobras), something which might lead to a drop in their spreads, due to increased demand. So, in our model, we analyze how changes in Treasuries’ rates affect CDS and ASW.
As noticed by Blanco et al. (2005), the process that determines interest rates may depend on factors such as the term structure. If we believe there is a reverse process in relation to the average short interest rate when compared to the long one, an increase in the slo-pe of the term structure may indicate future increases in the short-term interest rates, impacting on spreads. Market Liquidity *
Observations 1,273
Mean 2 bps
Median 3 bps
Standard Deviation 2 bps
Skew -0,28
Kurtosis -1,04
Table 2 Cont.
It is also widely known that Petrobras’ indebtedness, both gross and net, has considerably grown in recent years due to several factors, including a considerable increase in its investments (CAPEX) after the discovery of oil in the pre-salt layer. The company’s financial he-alth, therefore, can affect its credit risk very strongly. We used as a proxy for its financial health variation in its share price within the period.
Inserted in a global environment, in which most of its suppliers and customers are outside their country of domicile (Brazil), the global macroeconomic envi-ronment is also extremely important for Petrobras. We use as a proxy for this variable variation in the S&P500 within the period.
As highlighted by Blanco et al. (2005), an increase in the volatility of a company valuation process can incre-ase the probability of achieving the default boundary, increasing its credit risk and, as a result, their sprea-ds. The same applies to market volatility. Therefore, we made changes in the proxy for volatility in our model.
Moreover, much of a company credit risk may be due to lack of stock liquidity in the market (liquidity risk). The higher the bond and CDS liquidity (in our model, strictly speaking, we are measuring the “illiqui-dity” of securities), the lower the liquidity risk and the lower credit spread. Also, the higher the market liqui-dity, the more money is available for buying securities, so spreads are also lower.
We also included a variable that measures on a daily basis the balance of bonds in dollars issued by Petro-bras. The increased leverage of a company may increase the possibility to reach the threshold K, increasing the default risk and, therefore, spreads. As obtaining com-plete data about a company’s leverage on a daily basis may be a technical limitation, we used Petrobras’ debt on bonds in dollars, open in the market, as a proxy of its financial health, along with ADR return.
Regarding investors’ exposure to the Petrobras risk, all those who bought the company’s securities have li-mited exposure to its credit, according to its internal manuals. So, it may be expected that every time a com-pany accesses the international capital market, inves-tors who hold bonds in their portfolios that will become off-the-run (less traded), as a result of a new issuance, are going to get rid of them to make room for acquiring new bonds, while maintaining the exposure to Petro-bras’ credit. Thus, there is a strong movement to sell the old securities after the issuance is announced, as they will become less traded and show less liquidity, as cited by Chakravarty and Sarkar (1999), Elton et al. (2004), and Elizalde et al. (2009), and, in a way, also by De Wit (2006). We used a dummy that takes value 1 when new securities are issued in the international capital market in dollars, by Petrobras, and 0 otherwise, in order to capture the average impact of a new issuan-ce on spreads.
As for the counterparty risk, when a CDS buyer signs the agreement with his counterparty, there is a risk that the latter has no resources to meet its obliga-tions in the agreement. In this case, this risk becomes important, because it tends to reduce the spread paid by a CDS buyer to compensate for the risk of not recei-ving the principal, negatively impacting the basis.
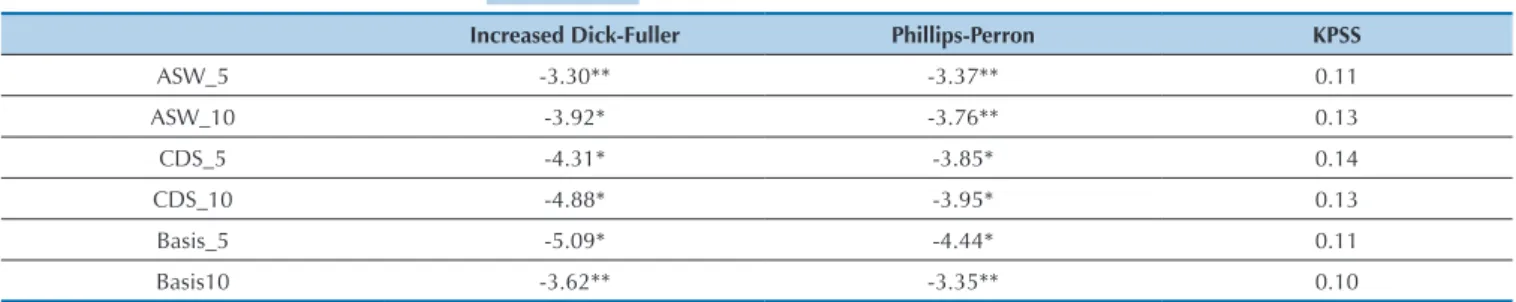
The increased unit root tests proposed by Dick--Fuller (1979), as well as the tests by Phillips-Perron (1988) and KPSS (1992), were performed for the ASW, CDS, and Basis series, 5 and 10 years, respectively. In all tests, we included the intercept and deterministic tendency.
Table 3 shows these tests. The first four rows in the table show that increased Dick-Fuller and Phillips-Per-ron reject the null hypothesis of a unit root, while KPSS does not reject the null hypothesis of stationarity for these series.
Table 3 Statistics of the Unit Root Tests
Increased Dick-Fuller Phillips-Perron KPSS
ASW_5 -3.30** -3.37** 0.11
ASW_10 -3.92* -3.76** 0.13
CDS_5 -4.31* -3.85* 0.14
CDS_10 -4.88* -3.95* 0.13
Basis_5 -5.09* -4.44* 0.11
Basis10 -3.62** -3.35** 0.10
* Significant at 1%; ** Significant at 5%. Source: Prepared by the authors.
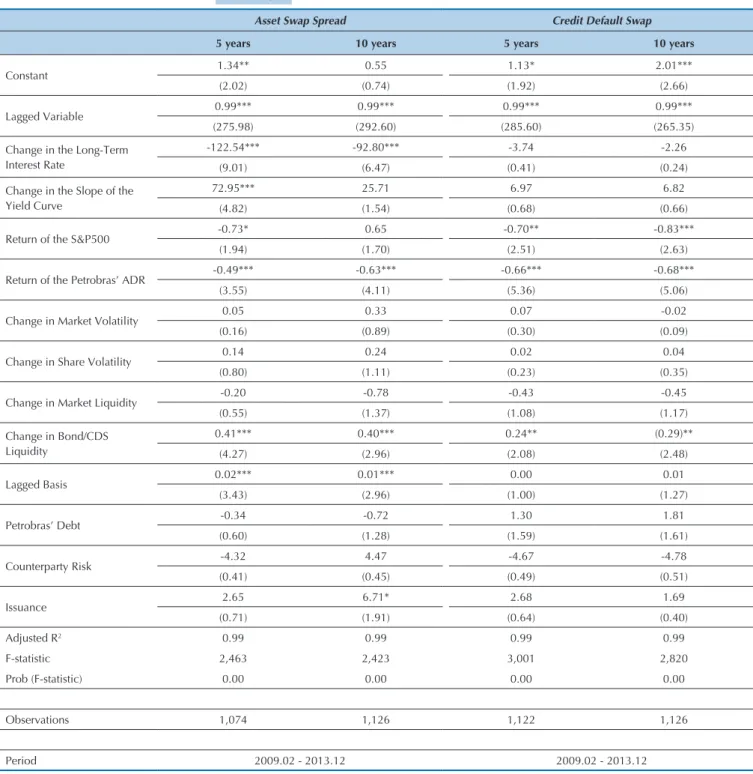
Table 4 shows the OLS regression results for ASW and CDS, for 5 and 10-year maturities, using the mo-del by Blanco et al. (2005). They suggest that changes in market liquidity do not impact a company credit spreads. However, specific liquidity indexes, both for
10-year CDS, which has a sign opposite from the expected one. This may be explained by the low reliability of esti-mates from the CDS purchase and sale points, because there is only one purchase and sale price provider and its estimates are not feasible, in addition to the reduced market for a 10-year Petrobras’ CDS. We also tested the liquidity index of the Equation 1 (results not shown), which was not significant for any of the periods under analysis.
Changes in market return have, in most of the ob-servations, a sign equal to the expected one. An incre-ase in the market return size reduces credit spreads in a few basis points, but significantly, indicating that a better market environment reduces risk aversion. Its
impact has greater significance for CDS, but its absolu-te size is not much bigger.
The reversion term in relation to the average (la-gged variable) is also highly significant and below 1, as expected. However, since we used daily data, both for CDS and ASW, these variables had high persisten-ce, with the need to use many gaps to correct the serial correlation, and a value equal to 0.99 indicates that re-version in relation to the average is very slow.
Our dummy for a new issuance indicates significan-ce only within the 10-year period for ASW, pointing out that a new issuance on the day increases the bond spread by 6 basis points, something which is, in a way, the magnitude order observed in a new issuance.
Table 4 Results of the model for ASW and CDS
Asset Swap Spread Credit Default Swap
5 years 10 years 5 years 10 years
Constant 1.34** 0.55 1.13* 2.01***
(2.02) (0.74) (1.92) (2.66)
Lagged Variable 0.99*** 0.99*** 0.99*** 0.99***
(275.98) (292.60) (285.60) (265.35)
Change in the Long-Term Interest Rate
-122.54*** -92.80*** -3.74 -2.26
(9.01) (6.47) (0.41) (0.24)
Change in the Slope of the Yield Curve
72.95*** 25.71 6.97 6.82
(4.82) (1.54) (0.68) (0.66)
Return of the S&P500 -0.73* 0.65 -0.70** -0.83***
(1.94) (1.70) (2.51) (2.63)
Return of the Petrobras’ ADR -0.49*** -0.63*** -0.66*** -0.68***
(3.55) (4.11) (5.36) (5.06)
Change in Market Volatility 0.05 0.33 0.07 -0.02
(0.16) (0.89) (0.30) (0.09)
Change in Share Volatility 0.14 0.24 0.02 0.04
(0.80) (1.11) (0.23) (0.35)
Change in Market Liquidity -0.20 -0.78 -0.43 -0.45
(0.55) (1.37) (1.08) (1.17)
Change in Bond/CDS Liquidity
0.41*** 0.40*** 0.24** (0.29)**
(4.27) (2.96) (2.08) (2.48)
Lagged Basis 0.02*** 0.01*** 0.00 0.01
(3.43) (2.96) (1.00) (1.27)
Petrobras’ Debt -0.34 -0.72 1.30 1.81
(0.60) (1.28) (1.59) (1.61)
Counterparty Risk -4.32 4.47 -4.67 -4.78
(0.41) (0.45) (0.49) (0.51)
Issuance 2.65 6.71* 2.68 1.69
(0.71) (1.91) (0.64) (0.40)
Adjusted R2 0.99 0.99 0.99 0.99
F-statistic 2,463 2,423 3,001 2,820
Prob (F-statistic) 0.00 0.00 0.00 0.00
Observations 1,074 1,126 1,122 1,126
Period 2009.02 - 2013.12 2009.02 - 2013.12
Note. The numbers in parentheses represent t-Student statistics.
No significance for the CDS is not surprising, sin-ce this is a different market, with regulation, taxes, and investor basis completely different (Wit, 2006). Perhaps, the increased bond spread on the day of an issuance is not necessarily due to an increased per-ception of Petrobras’ credit risk, but only to a tem-porary movement of imbalance between supply and demand.
No significance for the 5-year period for ASW, however, may be explained by the fact that, in an issuance in multiple periods, simultaneously, such as in the case of Petrobras, investors choose a term to “anchor” the issuance and define the bond prices of other terms based on it. In the U.S. market this term, usually, is 10 years.
We did not find significance for the increased Pe-trobras’ debt and counterparty risk. This result may be explained by the fact that we do not use the best proxies for the two variables, as in the case of Petro-bras’ debt there are no daily data on all of its com-ponents (bank debt, with development banks, and export credit agencies), and its bonds might fail to be the best representation of the weight that the gre-at debt volume brought to its spreads (in the market jargon, debt overhang).
On the other hand, changes in ADR return are very significant in both markets and they have the expected sign. An increased ADR return, in theory, indicates an improved perception of company finan-cial health, taking its credit spreads to lower levels.
CTD, quoted in Section 3, although difficult to measure, seemingly, do not have a great effect on spreads. Today, it is possible, at any time, to access a Bloomberg terminal and search what is the bond selected by the auction managers in the event of de-fault (Markit and Creditex). Thus, the value of this option was significantly reduced in recent years, due to developments in CDS settlement. We do not be-lieve that this variable has a significant effect.
In our data, the variable that mostly impacts Pe-trobras’ credit risk, both in terms of relevance and size, is the 10-year Treasury. An increase in the change of Treasury interest rate by one percentage point decreases ASW by 93 to 122 points, as pre-dicted by Longstaff and Schwartz (1995), some-thing which was also found by Blanco et al. (2005), although at a different proportion. In the case of CDS, although the coefficients have the right signs, we found no significance. One possible explanation is that, in addition to the fact that the two markets have trading, liquidity, taxation, regulation and ba-sis from completely different agents, CDS are traded on the 3-month LIBOR basis, while bonds are large-ly traded in terms of spread over Treasury, although their spread over LIBOR can be derived from them (such as ASW). It may be expected, therefore, that this product react more strongly to changes on Tre-asuries than CDS.
4.2 Estimating Basis
Among the papers that directly analyze the basis, we try to replicate the model by Zhu (2004) for the case of Petrobras. In a way, the previous model also assists in finding the variables that explain the diffe-rence between credit risk measured by the two ma-rkets. However, the model used herein brings useful innovations to analysis. In addition to Treasuries and market return, the author has other explanatory variables.
As, in theory, the basis should be zero, i.e. the two markets should price credit risk the same way (Du-ffie, 1999), it may be expected that there is a reverse process to the average basis observed, and the lagged basis coefficient value has to be lower than 1. The closer to 0, the quicker this reversal.
Regarding changes in credit spread, Zhu (2004) argues that if the two markets price credit risk effec-tively, a change on company’s credit conditions should be equally reflected in both markets. Then, we used change on CDS as an analysis variable. If its coefficient on the basis regression was statistically significant, there might be evidence that the two ma-rkets react differently to changes in company’s credit risk.
We also used the rating dummies described in the previous section to test whether there might be any predictive power or greater reaction of one market over the other, in the case of a credit event (company’s rating changes).
We performed the unit root tests proposed by Di-ck-Fuller (1979), Phillips-Perron (1988), and KPSS (1992) on the 5 and 10-year basis series, respectively. In all of them, we included the intercept and deter-ministic tendency. The last two rows in Table 3 de-monstrate that increased Dick-Fuller and Phillips--Perron reject the null hypothesis of unit root, while KPSS does not reject the null hypothesis of stationa-rity for these series. Table 5 shows the results of our regressions for the basis.
According to Zhu (2004), many of the explana-tory variables used, as well as their interpretation, are similar to the model used by Blanco et al. (2005). Nevertheless, herein we use a different perspective, solely analyzing the differences of the two products, instead of the two individually.
dummies under analysis.
Just as in the previous model, we also found a very high value for the lagged variable, and it was needed to use many gaps to correct the serial corre-lation. Again, significance was very high, indicating high persistence in correcting the difference betwe-en the two markets.
We used a variable that measures change on CDS on the date. Theory shows that, if the two markets price credit risk similarly, the coefficient of a change on CDS might not be significant, since there would be a change on ASW, too. We found high significant
for this variable, indicating that the two products, in fact, respond differently to changes on company’s credit status. More precisely, for each standard de-viation of CDS change on the date (about 55 points), bonds spreads only change about 25 points. Ammer and Cai (2007) also claim that CDS does not have a one-to-one ratio to the bond spread, it is quicker.
Table 5 shows the results of OLS regression for the basis, for 5 and 10-year periods, using the model proposed by Zhu (2004). It shows R2 adjusted to each regression, as well as F-statistics and the number of observations.
Table 5 Results of the model for the basis
CDS-Bond Basis
5 years 10 years
(1) (2) (1) (2)
Constant -0.08 0.03 0.25 -0.15
(0.08) (0.03) (0.24) (0.15)
Lagged Basis 0.97*** 0.97*** 0.99*** 0.98***
(171.98) (119.75) (212.73) (155.75)
(Basisi,t-1>0)
-0.21 0.72
(0.40) (1.11)
DCDS 0.55*** 0.55*** 0.57*** 0.59***
(5.24) (5.24) (5.12) (5.97)
Rating 2.34 2.36 -0.36 -0.17
(0.73) (0.74) (0.14) (0.06)
DUMB6190 0.42 0.45 -0.83 -0.56
(0.67) (0.72) (0.94) (0.72)
DUMB3160 0.61 0.64 -0.13 -0.28
(0.89) (0.92) (0.18) (0.37)
DUMB0130 0.63 0.66 -0.09 -0.22
(0.67) (0.70) (0.12) (0.30)
DUMA0110 -0.46 -0.42 -1.83 -1.80
(0.39) (0.35) (1.30) (1.32)
DUMA1130 -0.65 -0.66 -0.80 -0.99
(0.69) (0.70) (1.05) (1.29)
Treasury 58.83*** 58.81*** 68.40*** 69.47***
(12.81) (12.79) (12.74) (13.34)
Retorno do S&P 500 -0.69*** -0.69*** 0.12
(3.14) (3.14) (0.38)
BAS_CDS 0.00 0.00 0.06 0.05
(0.01) (0.03) (0.73) (0.63)
BAS_Bond -0.03 -0.03 -0.13* -0.11
(0.53) (0.53) (1.69) (1.58)
Petrobras’ Debt 0.66 0.65 1.50** 1.51**
(1.28) (1.26) (2.44) (2.52)
Counterparty Risk 1.11 1.02 -1.98 -1.87
(0.10) (0.09) (0.19) (0.19)
Issuance -0.20 -0.19 -6.36 -6.74
(0.03) (1.22) (1.30)
Adjusted R2 0.97 0.97 0.98 0.98
F-statistics 1,450 1,391 1,639 2,133
Note. The numbers in parentheses represent t-Student statistics.
(*) means that the coefficient is significantly different from zero at 10%; (**) and (***) at 5% and 1%, respectively. Source: Prepared by the authors.
Tabela 5 Cont.
Observations 1,148 1,150
Period 2009.02 - 2013.12
To try to reducing any noise on the daily liquidity data, we used a moving average, which is the arithmetic average of the liquidity index within the 10 days before and the 10 days after each observation. We did not find significance for the terms under analysis, except for the 10-year period, to which we found low significan-ce, indicating that liquidity difference in the two ma-rkets is not very important to explain the basis. Again, we believe that data for the 10-year CDS purchase and sale points may have low reliability due to lack of pri-ce providers, undermining the analysis of this variable. Five-year CDS is, by far, that with highest liquidity and most frequently used in the literature, as also mentio-ned by Bai and Collin-Dufresne (2013).
Regarding market return for the 5-year period, we found high significance, suggesting that the two pro-ducts differently incorporate changes to the S&P500, something which goes against the results of the pre-vious model, especially for the 10-year period.
When we observe changes on Treasuries and their impact on spreads, the results confirm what we found earlier: an increased in the rate of change in Treasuries significantly impacts ASW, and it impacts CDS just a little bit, leading the basis to increase. Again, we con-clude that the reaction of the two products to changes on Treasuries is the main reason why they react diffe-rently to changes on Petrobras’ credit risk.
In this model, we find mean significance for the va-riable Petrobras’ debt, because an US$ 1 billion incre-ase in bond balance variation in circulation increincre-ases CDS by 1.5 basis point more than ASW, indicating that these two products also respond differently to this va-riable, although inequality is small.
Finally, like Zhu (2004), we investigated whether there is asymmetry in the basis correction process. As explained above, it may be easier to correct a negative basis (ASW>CDS), as the optimal arbitration strate-gy in this case might be buying the bond (decreasing spread for more demand) and selling CDS (increasing spread). Nevertheless, in the case of a positive basis (CDS>ASW), bond short selling may be difficult. Be-cause there are no derivatives to do this, the market is very restricted, while buying CDS might not be a problem, a fact also noticed by Elizalde et al. (2009). To study this effect, we introduced a dummy that takes value 1 if the basis on the previous day is positive and 0 otherwise. If this hypothesis was correct, there would be a positive sign for this variable. The model was run again, removing the return of the S&P500 for the 10-year period, which was not significant. The results,
dis-played in Table 5, were not very favorable in relation to what was expected.
4.3 Robustness Testing
As shown in the analysis section of our database, the basis proved to be very volatile since 2013. According to some sources, the banks themselves have broken CDS trading desks in favor of fixed-income desks for trading bonds, due to high demand for this market in recent years, especially since 2013.
The two models were run again, separating them into two periods: (i) 2009-2012 and (ii) 2013, and re-moving the variables that correlated more strongly. The results have not significantly changed, helping to main-tain earlier findings. Thus, the effect in 2013 may be explained not through a structural change in the way how the two markets see Petrobras’ credit risk, but as a result of specific market situations within that period.
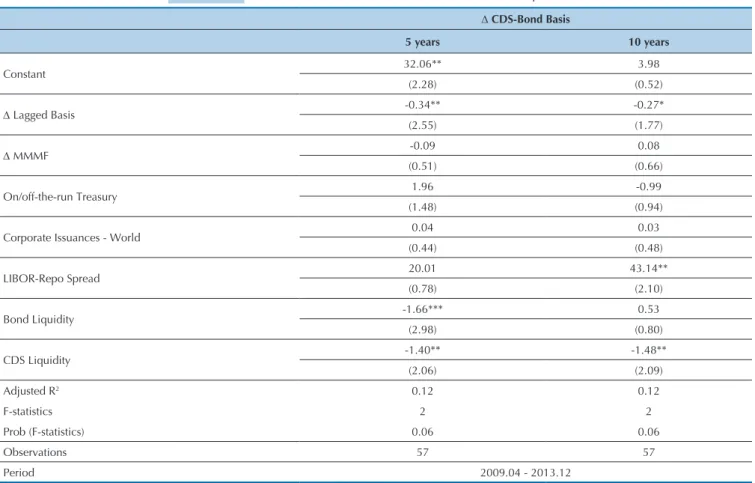
In addition, as a second robustness test, we tried to separate what is not Petrobras’ default risk on spreads and explain this new basis, like Lin et al. (2011) (al-though using a different approach). We run the basis on main components, on a monthly basis, with the va-riables used by the authors, and the results are shown in Table 6.
We have been studying changes on the basis each month. As it can be seen, a large part of the change is not incorporated by our model, given its low explana-tory degree (it was possible to explain only about 12% of the variance, as opposed to models on a daily basis, which can explain up to 99%).
In a way, the result is consistent with findings re-ported by the authors, when it points out that bond and CDS liquidity explain a small part of what is regarded as Petrobras’ “non-default” credit risk. The sign, howe-ver, is contrary to what we expected for CDS liquidity, for reasons already discussed in previous models.
Perhaps, much of the low explanatory power of the model used and some counterintuitive results are due to their poor specification, and also related to our use of a monthly basis for spreads, when these two products are very well traded every day, responding to daily life events. Therefore, results in the end of the month may not reflect events that have influenced them throu-ghout the month.
Table 6 Results of the model for the basis on Main Components
∆ CDS-Bond Basis
5 years 10 years
Constant 32.06** 3.98
(2.28) (0.52)
∆ Lagged Basis -0.34** -0.27*
(2.55) (1.77)
∆ MMMF -0.09 0.08
(0.51) (0.66)
On/off-the-run Treasury 1.96 -0.99
(1.48) (0.94)
Corporate Issuances - World 0.04 0.03
(0.44) (0.48)
LIBOR-Repo Spread 20.01 43.14**
(0.78) (2.10)
Bond Liquidity -1.66*** 0.53
(2.98) (0.80)
CDS Liquidity -1.40** -1.48**
(2.06) (2.09)
Adjusted R2 0.12 0.12
F-statistics 2 2
Prob (F-statistics) 0.06 0.06
Observations 57 57
Period 2009.04 - 2013.12
Note. The numbers in parentheses represent t-Student statistics.
(*) means that the coefficient is significantly different from zero at 10%; (**) and (***) at 5% and 1%, respectively. Source: Prepared by the authors.
5 CONCLUSION
In this paper, we studied the main variables that im-pact a company credit risk, in the case of Petrobras, by means of an analysis of the two main products: asset swap spread (ASW) and credit default swap (CDS).
Using the model by Blanco et al. (2005), to direc-tly study the determinant of each product, and by Zhu (2004), to study the CDS-Bond Basis, our results are in line with the literature on the theme.
We found strong evidence that the two markets in-corporate changes to company credit risk in a diffe-rent way. More precisely, for each standard deviation in change on CDS on the date (about 55 points), bond spreads only change about 25 points.
Macroeconomic variables, in general (long-term in-terest rates and term structure of inin-terest rates), tend to impact immediate and more intensely ASW than CDS, something which partly explains the reason why the two markets react differently to changes on company credit risk. More precisely, an increase in the change of the Treasury interest rate by one percentage point decreased ASW by 93 to 122 points. Changes on ma-rket liquidity were not significant to explain spreads, although changes on the return of the S&P500 are rele-vant, but have a very small effect.
On the other hand, microeconomic variables (such as share return, volatility in the share return, bond and
CDS liquidity, bond issuance on the date, rating, and debt), according to the literature, might tend to impact more on CDS, at first, and less on ASW. In our model, however, these variables have shown to be little or no significant, with mixed results, as the sign expected to change impacts on CDS liquidity on its price. These di-fferences may be explained by low quality of purchase and sale data for CDS.
Finally, none of the two markets tends to anticipa-te a rating event or react differently from each other after this event. Besides, a Petrobras’ debt issuance se-emingly has a significant impact on bond spreads on the new issuance, about six basis points, while on CDS such an impact is not observed, as expected.
Ammer, J., & Cai, F. (2007). Sovereign CDS and Bond Pricing Dynamics in Emerging Markets: Does the Cheapest-to-Deliver Option Matter? Discussion Paper Nº 912. Federal Reserve Board
International Finance.
Bai, J., & Collin-Dufresne, P. (2013). The CDS-Bond Basis. Proceedings
of the American Finance Association Meetings, San Diego, CA,
USA.
Blanco, R., Brennan S., & Marsh I. W. (2005). An Empirical Analysis of the Dynamic Relationship between Investment-grade Bonds and Credit Default Swaps. Journal of Finance, 60, 2255-2281. Chakravarty, S., & Sarkar, A. (1999). Liquidity in U.S. Fixed Income
Markets: A Comparison of the Bid-Ask Spread in Corporate, Government and Municipal Bond Markets Staff Report No 73,
Federal Reserve Board of New York, NY, USA.
Collin-Dufresne, P., Goldstein R.S., & Martin J. S. (2001). The Determinants of Credit Spread Changes, Journal of Finance, 61, 2177-2207
De Jong, F., & Driessen, J. (2007). Liquidity Risk Premia in Corporate Bond Markets [Working Paper]. University of Amsterdam, NL. De Wit, J. (2006). Exploring the CDS-Bond Basis. Working Paper No
104. National Bank of Belgium, Brussels, BE.
Dickey, D.A., & Fuller, W.A. (1979). Distribution of the Estimators for Autoregressive Time Series with a Unit Root. Journal of the
American Statistical Association, 74, 427-431.
Doctor, S., Singh, H., & Elizalde, A. (2010). CDS v2.0 - The New
Architecture of the CDS Market. European Credit Derivatives
Research, JP Morgan.
Duffee, G. R. (1998). The Relation between Treasury Yields and Corporate Bond Yield Spreads. Journal of Finance, 53(6), 2225-2241.
Duffee, G. R. (1999). Estimating the price of default risk. Review of
Financial Studies, 12, 197-226.
Duffie, D. (1999). Credit swap valuation. Financial Analysts Journal, 55, 73-87.
Elizalde, A., Doctor, S., & Saltuk, Y. (2009). Bond-CDS Basis Handbook. European Credit Derivatives Research, JP Morgan.
Elton, E. J., Gruber, M. J., Agrawal, D., & Mann, C. (2001). Explaining the rate spread on corporate bonds. Journal of Finance, 56(1), 247-77.
Elton, E. J., Gruber, M. J., Agrawal, D., & Mann, C. (2004). Factors affecting the valuation of corporate bonds. Journal of Banking &
Finance, 28(11), 2747-2767.
Felsenheimer, J. (2004). CDS: Mechanism, Pricing and Application. HVB Global Markets Research.
Galil, K., Shapir, O. M., Amiram, D., & Benzion, U. (2014). The Determinants of CDS Spreads, Journal of Banking and Finance, 41, 271-282.
Geske, R. L. e Delianedis, G. (2001). The Components of Corporate Credit Spreads: Default, Recovery, Taxes, Jumps, Liquidity, and Market Factors. Working Paper Nº 22-0, UCLA, Anderson School of Management.
Gwangheon H., & Warga, A. (2000). An Empirical Study of Bond Market Transactions, Financial Analysts Journal, 56(2), 32-46. Helwege J, Huang J., & Wang Y. (2014). Liquidity Effects in Corporate
Bond Spreads, Journal of Banking & Finance, 45, 105-116. Houweling, P., & Vorst, T. (2002). An Empirical Comparison of Default
Swap Pricing Models. ERIM Report Series Reference No. ERS-2002-23-F&A
Kwiatkowski, D., Phillips, P. C. B., Schmidt, P., & Shin, Y. (1992). Testing the Null Hypothesis of Stationarity against the Alternative of a Unit Root. Journal of Econometrics 54(1-3), 159-178. Lin, H., Liu, S., & Wu, C. (2011). Dissecting Corporate Bond and CDS
Spreads.The Journal of Fixed Income, 20(3), 7-39.
Loncarski, I., & Szilagyi, P. G. (2012). Empirical Analysis of Credit Spread Changes of US Corporate Bonds. International Review of
Financial Analysis, 24, 12-19.
Longstaff, F. A., & Schwartz, E. S. (1995). A Simple Approach to Valuing Risky Fixed and Floating Rate Debt. Journal of Finance, 50, 789-819.
Longstaff, F. A., Mithal, S., & Neis, E. (2005). Corporate Yield Spreads: Default Risk or Liquidity? New Evidence from the Credit Default Swap Market. Journal of Finance, 60, 2213-2253.
Memani, K., Foux, M., Jersey, I., & Zucker, J. (2005) Structuring
Cash-CDS Basis Trades for High Spread Bonds. Credit Suisse First Boston
Fixed Income Research.
Nashikkar, A., Subrahmanyam, M. G., & Mahanti S. (2011). Liquidity and Arbitrage in the Market for Credit Risk. Journal of Financial
and Quantitative Analysis, 46, 627-656.
Phillips, P. C. B., & Perron, P. (1988). Testing for a Unit Root in Time Series Regression. Biometrika 75(2), 335-346.
Schultz, P. (2001). Corporate Bond Trading Costs: A Peek behind the Curtain. Journal of Finance, 56(2), 677-698.
Taylor, J. B. (2009). The Financial Crisis and the Policy Responses: An Empirical Analysis of What Went Wrong. Working Paper. National
Bureau of Economic Research.
Trapp, M. (2009). Trading the Bond-CDS Basis: The Role of Credit Risk and Liquidity. Working Paper No. 09-16, Center for Financial
Research, Cologne, DE.
Weinstein, M. (1985). The Equity Component of Corporate Bonds. The
Journal of Portfolio Management, 11(3), 37-41.
Zhu, H. (2004). An Empirical Comparison of Credit Spreads Between the Bond Market and the Credit Default Swap Market. BIS Working Paper No. 160. Proceedings of the European Financial
Management Association Basel Meeting, 13.
References
(VECM) into practice to check whether short-term im-balances between the two products are fixed in the long run. The main contribution of this article is being the first in the literature to address the theme credit risk or liquidity of a Brazilian company from the viewpoint of bond spreads and CDS, traded in the foreign market, besides discussing why there is a difference between them.
One possible explanation for the absence of other articles in the literature having the same approach is the fact that few companies access the foreign markets, due to factors such as: high fixed issuance cost; the in-ternational issuance market is accustomed to longer
terms than those usual in Brazil (5, 10, and 30 years); swap for real has a very low or no liquidity, something which can bring problems related to foreign exchan-ge exposure to companies that venture in this market; there are few relevant “international players” in Brazil, so the “investor education” work for a company that intends to issue is hard, and it requires an expensive structure in order to satisfy the doubts and fears of the-se investors; finally, academic papers have the bias of studying the domestic market and its peculiarities, as more Brazilian companies access the domestic market, and the results are more demanded and applied by the target audience of such studies.
Correspondence Address:
Fernando Nascimento de Oliveira Ibmec/RJ – Unidade Centro
Avenida Presidente Wilson, 118 – CEP: 20030-020 Centro – Rio de Janeiro – RJ