Effects of income smoothing practices on the conservatism of public
companies listed on the BM&FBOVESPA
José Elias Feres de Almeida – Brazil
Ph.D. in Controllership and Accountancy from University of São Paulo, Brazil Adjunct Professor at Universidade Federal do Espírito Santo, Brazil
E-mail: [email protected]
Alfredo Sarlo Neto – Brazil
Ph.D. in Controllership and Accountancy from University of São Paulo, Brazil Adjunct Professor at Universidade Federal do Espírito Santo, Brazil
E-mail: [email protected]
Ricardo Furieri Bastianello – Brazil
M.Sc. student in Accountancy at Universidade Federal do Espírito Santo, Brazil
E-mail: [email protected]
Eduardo Zandomenigue Moneque – Brazil
Undergraduate student in Accountancy at Universidade Federal do Espírito Santo, Brazil
E-mail: [email protected]
Received on 9.9.2011 - Accepted on 9.12.2011 - 5th. version on 3.8.2012
ABSTRACT
The aim of this study was to investigate two aspects of accounting information that may be inherently related: income smoothing practices and conditional conservatism. Theoretically, the more a firm employs income smoothing, i.e., uses accruals to reduce the variability of profits, the less possibility there is for the timely acknowledgement of future economic losses (i.e., bad economic news) in profits. Eckel’s model (1981) was used in this study to classify listed companies as smoothing or non-smoothing, and Basu’s model (1997) was used to quantify the degree of conditional conservatism present in each firm. To make the results more robust, samples were created with annual stock return data from both March and December. The results indicated that non-smoothing firms had a higher degree of conditional conservatism, i.e., more opportunity to recognize future economic losses because the market could use the stock return data to anticipate future losses contained in the information regarding profits. This research made it possible to observe theoretical relationships between properties of accounting information: i) there is a relationship between income smoothing and conditional conservatism (i.e., accounting choices); ii) the informational environment of the Brazilian capital market contributes to the market distinction between smoothing and non-smoothing firms; and iii) the improvement of the capital market provides economic operators with greater insight into economic losses that are contained in accounting results.
1 INTRODUCTION
To date, the quality of accounting information cannot be measured by a single variable. When considering the various properties of the accounting information, we can highlight those that are the most researched: relevance, timeliness, conservatism, and earnings management (Lopes & Walker, 2008; Barth, Landsman, & Lang, 2008).
In recent literature, several researchers using the ac-counting information of listed companies in Brazil sou-ght to investigate these properties either individually or jointly. For instance, Lopes and Walker (2008) analyzed how the development of the financial market, the mo-del of governance, and the legal structure of a country can influence the quality of financial statements. Sarlo Neto (2008) verified that ownership structure influences the informativeness of the accounting earnings that are disclosed by companies trading on the BM&FBovespa (Bolsa de Valores, Mercadorias & Futuros de São Paulo). Pimentel (2009) investigated the earnings response coe-fficient and found that there is a long-term relationship between profits and stock prices, that economic variables influence this relationship, and, in the short term, that the response coefficient is weak. In addition, Almeida (2010) found that the quality of accounting information that uses the metrics of relevance, timeliness, conser-vatism, and earnings management varies depending on the degree of competition in the environment in which firms operate.
Although two properties of accounting informa-tion have been identified, namely, income smoothing practices (which is an income management metric) and conditional conservatism, there are few studies that have evaluated the relationship between them. Gassen, Fülbier, & Sellhorn (2006) conducted an international analysis on the relationship between conservatism and income smoothing that considered institutional di-fferences in code law and common law jurisdictions. Assets, Monahan, & Steele (2008) conducted a similar analysis that considered the number of business units in firms.
The conceptual approach of the present study is in ac-cordance with Gassen et al. (2006) and Bens et al. (2008), who contend that income smoothing interferes with the accounting accruals of firms by reducing the ability of accounting to reflect the economic reality of a business and by increasing informational asymmetry in the capital market. These authors found that income smoothing also interferes with the perception of agents with regard to economic losses, which should vary based on the degree of conservatism.
Additionally, the interference of executives who smooth the incomes of their firms to reduce the varia-bility of the firms’ profits can reduce the avaria-bility of sto-ck returns to capture future economic losses included in profits or can conceal the extent of the firm's risk, as measured by variance in the accounting results over
time (Dechow, Sloan, & Sweeny, 1995). Several studies, such as those conducted by Coelho and Lima (2007, 2009) and Barth, Landsman, & Lang (2008), suggest that these properties may be directly related and that one can affect the other.
According to Castro (2008, p. 7), income smoothing is practiced in accounting to reduce the variability of the accounting results. However, executive discretion is not used only in earnings management. For Coelho and Lima (2009), the discretionary power of executives is also reflected in the degree of conservatism of firms. In essence, firms can be more or less conservative in their accounting policies, and that degree of conserva-tism affects their accounting results. Therefore, it is im-portant to understand how the two practices described above can affect the quality of accounting information, as well as how the practice of smoothing results can in-fluence conditional conservatism.
Lopes (2001, p. 93) explains that conservative compa-nies do not disclose optimistic statements. In not disclo-sing optimistic statements, the company reduces its current profits. However, a reduction of optimism in financial sta-tements can also result from income smoothing practices. Excessive interference in reporting financial results decei-ves shareholders by misrepresenting the economic realities of the business and may even prevent increases in profits (Almeida, 2006).
In the Brazilian scenario, conservatism is not practiced by a portion of company managers, which may suggest that these companies are managing (i.e., manipulating) their re-sults (Coelho & Lima, 2007, p. 38).
In light of these practices, the present study seeks to investigate the following question: How do income smoo-thing practices affect conditional conservatism in listed companies in Brazil?
The present research is unique because it investiga-tes the possible interference of income smoothing prac-tices on conditional conservatism in Brazilian compa-nies. The relevance of the present study lies in the fact that the quality of accounting information depends on its qualitative characteristics and on how those who elaborate financial statements exert judgment on each of its properties.
2 THEORETICAL FOUNDATIONS
2.1 Accounting information: conservatism and
earnings management
Accounting information is continually influenced by risks, uncertainties, and, above all, economic factors (Ko-thari, 2001). Lopes and Martins (2005, p. 66) argue that conservatism can "impair the measurement of economic reality by imposing the smallest value between two availa-ble alternatives." Financial adjustments that depreciate as-sets are most often reflected in firms’ accounting results, for example, via provisions for loan losses, adjustments to asset depreciation rates, or losses raised by impairment tests. These accounting choices are subjective and are directly related to the degree of discretion of those who draft the financial statements.
Scott (2009, p. 419) considers two aspects of con-servative accounting: contractual performance and executive compensation. On the one hand, excessive conservatism can reduce the effectiveness of contracts because even with great effort on the part of the execu-tives, profits and pay will be lower. On the other hand, this degree of conservatism increases the efficiency of contracts by reducing the need to manipulate earnings to increase them because, for rational investors, lower but constant profits can be more enticing. Thus, redu-cing the ability of earnings management to expropria-te shareholders, investors, and creditors only benefits executives.
Castro (2008) shows that it is interesting for managers to reduce the uncertainties or “risk measures” that are seen by investors concerning the economic and financial situa-tion of the entities they manage. One type of uncertainty or "risk measure" is the variation or dispersion of earnings over time, which can be reduced via smoothing techniques that aim, within statutory accounting standards, to decre-ase the dispersion of the accounting results, i.e., their va-riability.
Other evidence in Brazil indicates that the practice of income smoothing has a direct relationship to the capital structure of Brazilian firms (Martinez & Castro, 2009a), lowers the cost of third-party capital and long-term debt structuring, and leads to the best ratings possible issued by risk agencies for the public issuance of debentures (Martinez & Castro, 2009b). Companies whose results have been analyzed by a greater number of analysts have a reduced rate of earnings manage-ment, as measured by discretionary accruals (Marti-nez, 2011).
2.2 Conservatism
As has already been briefly discussed, one characteristic of accounting information is conservatism. The definition used by Basu (1997, p. 7) is as follows:
I interpret conservatism as capturing accountants' ten-dency to require a higher degree of verification for
recog-nizing good news than bad news in financial statements. […] conservatism results in a greater probability of timely accounting recognition of bad news than good news. In research studies, conservatism has been analyzed from two perspectives: conditional and unconditional. Co-elho (2007, p. 136) conceptualizes the two forms of conser-vatism as follows:
a) Unconditional; arising from the rule that between two alternatives of measurement and recognition of events, equally valid, you should choose the one that results in the lowest assessment of proprietors’ assets; its purpose is that of prudence and is related to the de-gree of uncertainty about the derivative effects of tran-sactions initiated;
(b) Conditional; referring to the possibility of antici-pating the accounting recognition of economic losses – that is, not yet carried out – regarding the estimates performed by management based on current events of a negative slant; it is worth noting that this form is equi-valent to recognizing economic facts in accounting with timeliness and with asymmetry, privileging evidence of negative results.
Scott (2009, p. 96) explains that conditional conser-vatism is considered ex post, i.e., the write-downs are ad-justed to construe a loss in the market value of the shares as an event occurs. Unconditional conservatism occurs ex ante, i.e., assets are valued below their current value on an ongoing basis, which will not affect the market value of the shares. One can then infer that unconditional con-servatism interferes with the ability of economic agents in the capital market to distinguish an economic loss during a given period from the occurrence of continuous losses or from the undervaluation of assets. This condition is di-rectly related to the anticipation or deferral of revenues and expenditures.
In the present study, conservatism will be analyzed in its conditional form by applying Basu’s model (1997), which will be presented in the methodology section. Ac-cording to Ryan (2006), Basu’s study (1997) was the most influential study on the topic in the past decade and con-sequently is the most widely used model.
2.3 Income smoothing
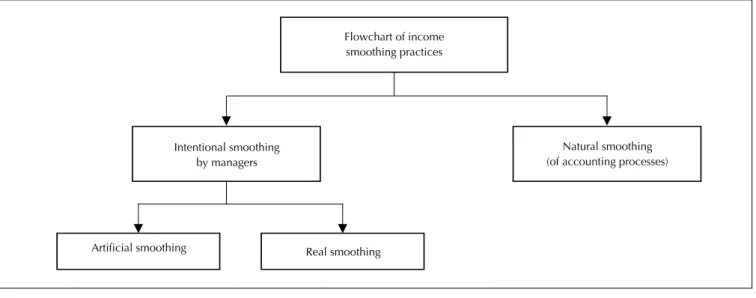
Figure 1 Income smoothing processes
Source: adapted from Eckel (1981, p. 29)
Michelson, Jordan-Wagner, & Wootton (1988, p. 323) define income smoothing in the following way: "Managers of accounting selectively reduce fluctuations that arise in profits during accounting exercises accor-ding to a framework of generally accepted accounting principles."
There are several metrics that can verify the presence of income smoothing. Among these metrics are Eckel’s model (1981) and a metric developed by Leuz, Nanda, & Wysocki (2003). The income smoothing metric develo-ped by Leuz et al. (2003) uses the standard deviation of the operating profit divided by the standard deviation of the operating cash flow to generate a new variable that aggregates all of the observations of a firm over the years.
For the purposes of the present study, this metric would inhibit the application of Basu’s model (1997) because it aggregates the standard deviations of observations and would not catch the possibility of income smoothing by a firm in one period and not in another, which would lead to other methodological issues, such as how to sti-pulate the mean or median cut-point for separating fir-ms into smoothers and non-smoothers.
Therefore, in the present study, Eckel’s model (1981) has been chosen, enabling this study to divide the sample objectively into two groups of firms: smoothing and non-smoothing.
Eckel’s (1981, p. 29) flowchart showing smoothing prac-tices is shown in Figure 1.
Artificial smoothing
Real smoothing Intentional smoothing
by managers
Natural smoothing (of accounting processes) Flowchart of income
smoothing practices
Smoothing may occur through the accounting proces-ses of recognition, measurement, and disclosure, as well as intentionally. Artificial smoothing implies the use of accruals, which does not affect cash flow and is not based on economic events; rather, it is similar to a postpone-ment or anticipation of revenues and expenditures. Con-versely, real smoothing involves economic events, such as the sale or purchase of fixed assets, which also affect cash flow. However, in both cases, executives act intentionally to smooth results.
2.4 The relationship between conservatism and
income smoothing and the development of
our hypothesis
In general, both conditional conservatism and income smoothing are properties of accounting information that are directly related to and influence the quality of the ac-counting information that is disclosed to the market.
The reduction of optimism in the results disclosed is theoretically a feature of accounting conservatism; howe-ver, in this case, reduced optimism can also be a conse-quence of income smoothing practices that are intended to prevent profits from appearing to be too far above or below
market expectations. Therefore, both of these practices, conservatism and smoothing, can result in a reduction of optimism.
Gassen et al. (2006) analyzed how conservatism is affec-ted by the practices of income smoothing in code law and common law countries by considering 23 jurisdictions using Basu’s model (1997) with Fame-Mac Beth regression coefficients. The results support the theoretical claim that smoothing interferes with a firm’s capacity to recognize bad economic news (i.e., economic losses).
The abovementioned authors argue that conditional conservatism is positively associated with the degree of indebtedness of firms, as income smoothing affects firms’ dividend policies. The legal system also has an effect on the degree of conservatism and optimism reflected in financial statements in that the code law system reduces the explana-tory power of conditional conservatism.
ability to communicate bad economic news in a timely manner, Bens et al. empirically established that accounting discretion is used by business units to reduce the variation in profits among the units until a consolidated result is ob-tained that is released to the market and that does not re-flect economic losses.
Thus, considering that smoothing practices have an effect on a firm’s level of conditional conservatism and in-crease informational asymmetry in the capital market, the following research hypotheses were developed:
H1: Non-smoothing listed companies acknowledge economic losses in a timelier manner than do companies that participate in smoothing.
This hypothesis was motivated by the gap in the litera-ture concerning the effects of accounting choices on con-ditional conservatism and income smoothing. Another motivation for this hypothesis was to ascertain whether elaborate theoretical models including different constructs can explain the phenomena highlighted in the present stu-dy with empirical evidence.
3 METHODS
A literature review was the starting point of the present study, which gave theoretical support to the relationship between conditional conservatism and income smoothing. The present study is of an empiri-cal-analytical nature and consequently is quantitative in that phenomena are observed and conclusions are inferred from the results obtained through the applica-tion of econometric models to secondary data (Martins & Theóphilo, 2007, p. 37). This study is based on a po-sitive approach toward accounting phenomena (Watts & Zimmerman, 1986, p. 1), as it begins with theoretical arguments to support conclusions regarding the topic studied.
3.1 Sample selection, data collection, and data
analysis
The sample set studied was composed of listed com-panies with shares that are traded on the São Paulo stock market (BM&FBovespa). All data, namely, total assets, total revenues, net income, the closing value of shares in December and March from 1997 to 2009, net profits, and net losses, were obtained using Economa-tica® software.
To strengthen the results and give consistency to the theoretical constructs in the models, two sample sets were derived. One sample set included data from March after the publication of the financial statements (throu-gh Economatica® software analysis, it was found that the studied companies released results until March and that it was not necessary to use data from April). The other sample set included data from December to check ther there would be any changes in the results and whe-ther the market had already provided that information in advance.
To analyze the object of study (i.e., to compare the de-gree of conservatism among the groups of listed compa-nies that either smooth or do not smooth results), Eckel’s model (1981) was applied, which will be explained in sec-tion 3.2.1.
Subsequently, from the original data (8,352 observa-tions), the observations needed (net income and sales revenue) to classify the companies into smoothers and non-smoothers were extracted, reducing the sample
set to 4,044 observations. Next, variables with extreme values based on Eckel’s model were excluded, leaving a total of 3,978 observations in the sample set (March and December).
The next step was to classify companies into smoothers and non-smoothers, to normalize the variables in Basu’s model (1997), and to exclude observations greater than three standard deviations from the mean. After the classi-fication, there were 476 companies in the smoothers group and 388 in the non-smoothers group in the December sample set, and there were 650 companies in the smoothers group and 566 companies in the non-smoothers group in the March sample set.
The procedures adopted to process the samples follo-wed the suggestions of Fávero, Belfiore, Silva & Chan (2009, p. 56) and Martins (2002, p. 59), who indicated that the outliers (i.e., the disparate observations in the sample) can either be directly excluded or can be repla-ced using the Winsorization method on each side of the distribution or by standardizing the variables to exclude observations above three standard deviations from the mean. It is worth noting that the method applied depen-ds on the interests and goals of the researcher. In the present study, the Winsorized variables are not suitable because they would affect our ability to observe the phe-nomenon investigated by repeating the values of obser-vations above or below a cut-off point in each tail, which would affect the measurement of income smoothing and conservatism. In any case, the treatment of data in ap-plied social sciences studies is subjective and allows the researcher to choose the method that is least likely to alter the phenomenon investigated.
It was also necessary to exclude observations that could not be classified as income smoothing or non-smoothing because they had coefficient of variation values, which are discussed in section 3.2.1, that fell within a band called a gray area. This procedure was adopted according to the studies of Iñiguez and Pove-da (2004), Castro (2008, p. 76), Martinez and Castro (2009a, 2011), and Valipour, Talebnia and Javanmard (2011).
Table 1 Data processing
Initial observations – 696 irms per year 8.352
(-) Observations with errors or incomplete observations based on Eckel’s model (4,308) (4.308)
(=) Number of observations without errors 4.044
(-) Processing the outliers – exclusion of the observations above or below three standard deviations from the mean (65)
(=) Sample after iltering data pertaining to Eckel’s model 3.978
Reference month Dezembro Março
(=) Subtotal of observations 3.978 3.978
(-) Variables with errors or null variables associated with proits and stock returns (3.061) (2.734)
(=) Total segregated sample 917 1.298
(-) Processing the outliers – exclusion of the observations above or below three standard deviations from the mean, based on Basu’s model (1997)
(36) (54)
(=) Subtotal of samples 881 1.244
(-) Exclusion of observations in Eckel’s grey area (17) (28)
(=) Final sample of income smoothing companies 476 650
(=) Final sample of non-smoothing companies 388 566
CVΔ%Net Profit CVΔ%Sales
NIit
Pit-1 ERit P
it-1
ERit Pit-1
3.2 Models applied
Eckel’s model (1981) for the classification and se-gregation of the sample into smoothing and non-smoothing companies and Basu’s model (1997), which measures conditional conservatism, were the models applied in the present study, and their metrics are ex-plained below.
3.2.1 Eckel’s model for measuring income smoothing Eckel’s model (1981) is based on the premise that re-venues and costs are linear over time. Therefore, they grow or decline at the same rate; when a linear rela-tionship is not observed, this property may be due to interference from executives to smooth the results. In section 2.3, the justification for the use of this model despite the detriment incurred on the metric of Leuz et al. (2003) was summarized.
To observe the relationship between profits and re-venues, the coefficients of the percentage variations of profits and sales revenue are used. When the coefficient of the profit is less than that of the revenue, this de-monstrates that the company is interfering in the profits through artificial smoothing. The author's definition is as follows:
CVΔ%Net Profit ≤ CVΔ%Sales = Smoothing, where
CVΔ%Net Profit = Net Profitt – Net Profitt-1 / Net Profitt-1. CVΔ%Sales = Revenuet – Revenuet-1 / Revenuet-1. From these data, income smoothing is estimated using Eckel's index formula (EI):
According to Iñiguez and Poveda (2004), Martinez and Castro (2009a), and Castro (2008, p. 76), an interval betwe-en 0.9 and 1.1 is considered a gray area in which it is not possible to sort firms into smoothers or non-smoothers. This procedure allows for the objective classification of
firms, thus reducing risk of bias from the researcher. The observations falling within that range were excluded, as de-monstrated by the processing of the sample shown in Table 1. The following formula defines the gray area:
0,9< <1,1
This shows that if the index obtained is less than 0.9, the company performs income smoothing, and if the index is greater than 1.1, the company does not perform income smoothing.
3.2.2 Basu’s model for estimating conditional conservatism
Basu’s model (1997) is a metric that facilitates the analysis of conditional conservatism, as explained in the section describing the theoretical basis for this work. Basu’s model is based on the premise that, upon recognition of a future economic loss in profit of a gi-ven entity, the market recognizes that loss in stock re-turns in a timely manner.
Basu’s model is represented by the following regression:
= βo+ β1Dit+β2 + β3Dit* + εit
where
NIit = The net income per share of company i in the year t, corrected by unfoldings;
Dit = A dummy variable, which is one if the economic return is negative and zero if it is positive for firm i in year t;
ERit = The economic return per share of company i in year t (Pit – Pit–1/ Pit–1, adjusted by the payment of divi-dends and unfoldings);
Pit–1 = The share price of company i at the end of year t-1, adjusted for unfoldings and dividends;
β2 = This captures the accounting profit opportunity ba-sed on the economic returns of the accounting profits;
β1 and β3 = These reflect the accounting profit oppor-CVΔ%Net Profit
Table 2 Descriptive statistics for sample data from March
Panel A: General sample
Variables Obs. Mean SD Min. Max.
EI 1.244 790,63 26960,4 -24854,4 948174
NI 1.244 0,099 0,398 -2,451 2,509
ER 1.244 0,460 1,035 -0,947 13,362
D 1.244 0,349 0,477 0 1
D*ER 1.244 -0,119 0,214 -0,947 1
Panel B: Sample of listed smoothing companies
EIs 650 -98,522 1284,665 -24854,42 0,897
NIs 650 0,082 0,393 -2,451 2,509
ERs 650 0,420 0,971 -0,904 7.660
Ds 650 0,377 0,485 0 1
D*ERs 650 -0,132 0,222 -0,904 0
Panel C: Sample of listed non-smoothing companies
EIns 566 1850,806 39939,16 1,103 948174
NIns 566 0,123 0,399 -2,06 1,936
ERns 566 0,505 1,114 -0,947 13,362
Dns 566 0,322 0,467 0 1
D*ERns 566 -0,104 0,202 -0,947 0
Note: EI = Eckel’s index; NIit= net income per share of company i in year t, corrected by unfolding; Dit = dummy variable, which is one if the economic
return is negative and zero if it is positive, for irm i in year t; ERit = economic return per share of company i in year t (Pit – Pit–1/ Pit–1, adjusted by the
pay-ment of dividends and unfoldings). The letters "s" and "ns" represent variables in the samples of smoothing and non-smoothing irms, respectively.
Table 3 Descriptive statistics for sample data from December
Panel A: General sample
Variables Obs. Mean SD Min. Max.
EI 881 2,026438 244,7953 -3897 4888
NI 881 0,105 0,5069909 -2,642 2,392
ER 881 0,536 1,216656 -0,977 11,954
D 881 0,382 0,4862785 0 1
D*ER 881 -0,163 0,2584022 -0,977 0
continues tunity, i.e., the recognition of economic returns from the
accounting profits;
εit = White’s robust error regression coefficient.
According to the theoretical foundations of the present study, it is expected that the β3 coefficient will be positive for the companies that do not smooth their results; that is, for this group, it is expected that the opportunity to recognize future
economic losses in the disclosed profits will be greater. If the β3 coefficient is not statistically significant and positive for the group that does not smooth results, or if the inverse is found, this result would show that there is a gre-ater opportunity to recognize bad economic news for com-panies that smooth results, and the theoretical constructs and models used in this study would need to be revisited.
4 ANALYSES OF THE RESULTS
The analyses of the results were performed using descriptive statistics that reveal the behaviors and characteristics of the va-riables, correlations between the vava-riables, and regression analy-ses by applying Basu’s conditional conservatism model (1997).
4.1 Descriptive statistics
Table 2 (panels A, B, and C) summarizes the descripti-ve statistics for the March samples of smoothers and non-smoothers.
The means and standard deviations of Eckel’s index were high, despite the data processing that was performed. For the purposes of the model application, these high values do not affect the analysis because Eckel’s index was only used to sort the firms into smoothers and non-smoothers. The means of the other variables did not show major dispari-ties in any of the samples. The means of the variables were
actually similar between samples; for example, the means for the variable NI, which is dependent on Basu’s model, are 0.099, 0.082, and 0.123 for the general sample, the in-come smoothing sample, and the non-smoothing sample, respectively.
Panel B: Sample of listed smoothing companies
Variables Obs. Mean SD Min. Max.
EIs 476 -30,48 202,95 -3897 0,885
NIs 476 0,048 0,523 -2,642 2,086
ERs 476 0,523 1,20 -0,930 9
Ds 476 0,384 0,487 0 1
D*ERs 476 -0,170 0,263 -0,930 0
Panel C: Sample of listed non-smoothing companies
EIns 388 41,95 287,76 1,103 4888
NIns 388 0,180 0,474 -2,059 2,392
ERns 388 0,555 1,241 -0,977 11,954
Dns 388 0,379 0,486 0 1
D*ERns 388 -0,154 0,249 -0,977 0
Note: EI = Eckel’s index; NIit = net income per share of company i in year t, corrected by unfolding; Dit = dummy variable, which is one if the
econo-mic return is negative and zero if it is positive, for irm i in year t; ERit = economic return per share of company i in year t (Pit – Pit–1/ Pit–1, adjusted by the
payment of dividends and unfoldings). The letters "s" and "ns" represent variables in the samples of smoothing and non-smoothing irms, respectively. Table 3 continued
Table 4 Correlations among variables in the conservatism model
Panel A: Correlations for March data
Variables NI ER D D*ER
NI 1
ER 0,138*** 1
D -0,168*** - 1
-0,566***
D*ER 0,193*** 0,518*** - 1
-0,760*** Panel B: Correlations for December data
Variables NI ER D D*ER
NI 1
ER 0,224*** 1
D -0,210*** - 1
-0,624***
D*ER 0,225*** 0,576*** -0,804*** 1
***, **,* = signiicant at 1, 5, and 10%, respectively. NI = the earnings per
share by set by price in year t-1; ER = the return on shares; D = a dummy variable equaling one for negative returns and 0 otherwise; D*ER = the interaction between D and ER.
Table 5 Results of regression analyses
= β0 + β1Dit + β2 + β3Dit* + εit
Independent Variables March Sample December Sample
β3 D*ER
0,270 *** 0,257 ***
(0,774) (0,109)
[3,50] [2,35]
β2 ER
0,0169 0,056
(0,040) (0,048)
[0,42] [1,18]
β1 D
-0,0276 - 0,02
(0,449) (0,072)
[-0,61] [-0,28]
β0
0,133 *** 0,125 ***
(0,0348) (0,05)
[3,83] [2,40]
No. Obs. 1.244 881
R² -Adjust. 0,0397 0,0642
Prob - F 0,000 0,000
Note: coeficients are shown in the irst row, standard errors are shown inside
parentheses in the second row, and t-statistics are shown in brackets in the
third row. ***,**,* = signiicant at 1, 5, and 10%, respectively. ER = the economic return of irm i in period t; D = a dummy variable equaling one for
negative returns and 0 otherwise; ER*D = the interaction between ER and D. NIit
Pit-1 ERit P
it-1
ERit Pit-1 Table 3 shows in panels A, B, and C that the mean of
NI fluctuates between 0.105, 0.048, and 0.18, respectively. It is worth noting that the standard deviation of NI is lower among non-smoothing companies (0.474). There were no relevant differences for the other variables. The mean va-lue of the economic return (ER) variable was notably close among the samples.
4.2 Correlations among the variables
The correlation between variables shows the degree of association among them, which can alert us to any possi-ble propossi-blems in the estimators used to conduct regressions. Table 4 shows the correlations of Basu’s model variables (1997) for March (Panel A) and December (Panel B).
It is worth noting that the variables from the Decem-ber data (Panel B) are more strongly inter-correlated than are the same variables from the March data (Panel A). In
addition, the correlation between NI and ER in March was 0.138, whereas the correlation was 0.224 in December, whi-ch may suggest that there are greater expectations concer-ning the information contained in profits and prices publi-shed in December, i.e., prior to any disclosure of financial statements.
4.3 Regression analysis
Table 6 Results of regression analyses for listed smoothing companies
= β0 + β1Dit + β2 + β3Dit* + εit
Independent Variables March Sample December Sample
β3 D*ER
0,125 0,094
(0,083) (0,152)
[1,50] [0,62]
β2 ER
0,058 0,112 ***
(0,025) (0,041)
[2,26] [2,72]
β1 D
- 0,016 0,006
(0,049) (0,087)
[-0,34] [0,07]
β0
0,080 *** 0,003
(0,0236) (0,047)
[3,41] [0,07]
No. Obs. 650 476
R² -Adjust. 0,0439 0,0813
Prob - F 0,000 0,000
Note: coeficients are shown in the irst row, standard errors are shown
inside parentheses in the second row, and t-statistics are shown in brackets
in the third row. ***,**,* = signiicant at 1, 5, and 10%, respectively. ER = the economic return of irm i in period t; D = a dummy variable equaling
one for negative returns and 0 otherwise; ER*D = the interaction between ER and D.
NIit
Pit-1 ERit P
it-1
ERit Pit-1
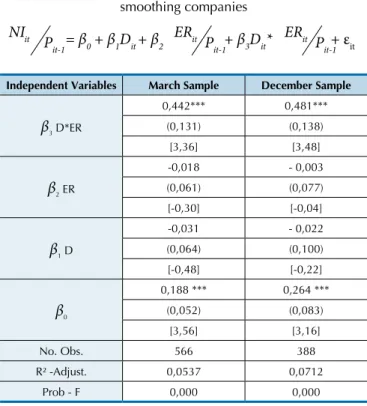
Table 7 Results of regression analyses for listed non-smoothing companies
= β0 + β1Dit + β2 + β3Dit* + εit
Independent Variables March Sample December Sample
β3 D*ER
0,442*** 0,481***
(0,131) (0,138)
[3,36] [3,48]
β2 ER
-0,018 - 0,003
(0,061) (0,077)
[-0,30] [-0,04]
β1 D
-0,031 - 0,022
(0,064) (0,100)
[-0,48] [-0,22]
β0
0,188 *** 0,264 ***
(0,052) (0,083)
[3,56] [3,16]
No. Obs. 566 388
R² -Adjust. 0,0537 0,0712
Prob - F 0,000 0,000
Note: coeficients are shown in the irst row, standard errors are shown
inside parentheses in the second row, and t-statistics are shown in brackets
in the third row. ***,**,* = signiicant at 1, 5, and 10%, respectively. ER = the economic return of irm i in period t; D = a dummy variable equaling
one for negative returns and 0 otherwise; ER*D = the interaction between ER and D.
NIit
Pit-1 ERit P
it-1
ERit Pit-1 This initial evidence can confirm whether the model for
the total sample conforms to what is predicted by the the-ory. The β3 coefficient of the variable D*ER, displayed in Table 5, is positive and significant for both March and De-cember data (0.270 and 0.257, respectively), as well as for the total sample, as expected by the theory. In other words, firms are generally conservative, i.e., they acknowledge bad economic news in a timely manner and incorporate it into reports of profits, and the market identifies this informa-tion in the stock returns.
Table 6 displays the results for the sample of companies that smooth results.
As observed in Table 6, only the positive economic re-turns (i.e., the good news) of the coefficient β2 for the ER variable were significant for the December data (0.112). According to the theory behind the present study, firms that smooth results eventually interfere with the results they disclosed by, for example, provisioning more or adjus-ting depreciation, amortization, or other accruals that ul-timately distort the economic realities of the business; this makes it difficult for the market to recognize anticipated economic losses in profits. This is probably a consequence of unconditional conservatism, i.e., of continuously un-derstated assets.
Table 7 shows the regression results for the non-smoo-thing firms according to Eckel’s model.
According to the theory behind this study, it is expec-ted that when firms do not smooth their results, i.e., when there is less interference in the linearization of profits, fu-ture economic losses can most expediently be recognized by the market. As the results that are disclosed by these non-smoothing firms do not suffer as much interference (or suffer less interference from accounting choices) at the discretion of those who elaborate the accounting informa-tion, it was possible to observe conditional conservatism as represented by the β3 D*ER variable.
Analysis of the variable β3 D*ER, which is the interac-tion between the dummy for negative returns and the eco-nomic return, verified that the coefficients for this variable are positive and are statistically significant for both March (0.442) and December (0.481). This indicates that the re-porting of the profits of non-smoothing firms is of a higher quality, which facilitates the market’s recognition of econo-mic losses (bad econoecono-mic news).
In addition, we found that the classification of listed companies into groups of smoothers and non-smoothers based on Eckel’s (1981) model justified the application of Basu’s (1997) conditional conservatism model.
5 FINAL CONSIDERATIONS
The present study investigated the relationship betwe-en two phbetwe-enombetwe-ena: earnings managembetwe-ent using income
phe-Almeida, J. E. F. (2006). Earnings management no Brasil: estudo empírico em indústrias e grupos estratégicos. Dissertação (Mestrado em Ciências Contábeis) – Programa de Pós-Graduação em Ciências Contábeis, Fundação Instituto Capixaba de Pesquisas em Contabilidade, Economia e Finanças (FUCAPE), Vitória, ES, Brasil.
Almeida, J. E. F. (2010). Qualidade da informação contábil em ambientes competitivos. Tese de Doutorado FEA- USP, Programa de Pós-Graduação em Ciências Contábeis, Departamento de Contabilidade e Atuária, Faculdade de Economia, Administração e Contabilidade da Universidade de São Paulo, São Paulo, SP, Brasil.
Barth, M., Landsman, W., & Lang, M. H. (2008, June). International Accounting Standards and accounting quality. Journal of Accounting Research, 46 (3), 467-728.
Basu, S. (1997). he conservatism principle and the asymmetric timeliness of earnings. Journal of Accounting and Economics, Amsterdam, 24 (1), 3-37.
Bens, D. A., Monahan, S. J., & Steele, L. (2008). he association between inter-segment proit smoothing and the conservatism of accounting earnings. Working Paper. Recuperado em 16 outubro, 2011, de http:// www.tilburguniversity.edu/research/institutes-and-research-groups/ center/sem/9monahan.pdf
Castro, M. A. R. (2008). Análise do alisamento de resultados contábeis nas empresas abertas brasileiras. Salvador. Dissertação de mestrado acadêmico em Ciências Contábeis, Faculdade de Ciências Contábeis - UFBA, Salvador, Bahia, Brasil.
Coelho, A. C. D. (2007). Qualidade informacional e conservadorismo nos resultados publicados no Brasil. Tese de doutorado, Programa de Pós-Graduação em Ciências Contábeis, Departamento de Contabilidade e Atuária, Faculdade de Economia, Administração e Contabilidade da Universidade de São Paulo, São Paulo, SP, Brasil.
Coelho, A. C. D., & Lima, I. S. (2007, setembro-dezembro). Qualidade informacional e conservadorismo nos resultados contábeis publicados no Brasil. Revista de Contabilidade & Finanças, 18 (45), 38-39. Coelho, A. C. D., & Lima, I. S. (2009, setembro-dezembro).
Conservadorismo condicional: requisito para a qualidade dos lucros e para a eiciência informacional da contabilidade. Revista Eletrônica de Administração – REAd, 15 (3), 1-26.
Dechow, P. M., Sloan, R. G., & Sweeny, A. P. (1995). Detecting earnings management. he Accounting Review, 70 (2), 193-225.
Eckel, N. (1981). he income smoothing hypothesis revisited. Abacus, 17 (1), 28-40.
Fávero, L. P., Beliore, P., Silva, F. L. da, & Chan, B. L. (2009). Análise de dados: modelagem multivariada para tomada de decisões. Rio de Janeiro: Elsevier.
Gassen, J., Fülbier, R. U., & Sellhorn, T. (2006). International differences in conditional conservatism: the role of unconditional conservatism and income smoothing. European Accounting Review, 15 (4), 527-564.
Iñiguez, R., & Poveda, F. (2004). Long-run abnormal returns and income smoothing in the spanish stock market. European Accounting Review, 13 (1), 105-130.
Kothari, S. P. (2001). Capital markets research in accounting. Journal of Accounting and Economics, 31 (1-3), 105-231.
Leuz, C., Nanda, D, & Wysocki, P. D. (2003). Investor protection and earning management: an international comparison. Journal of Financial Economics, 69 (3), 505-527.
Lopes, A. B. (2001). Uma contribuição ao estudo da relevância da informação contábil para o mercado de capitais: o Modelo de Ohlson aplicado à BOVESPA. Tese de doutorado, Departamento de Contabilidade e Atuária, Faculdade de Economia, Administração e Contabilidade, Universidade de São Paulo, São Paulo, SP, Brasil. Lopes, A. B., & Walker, M. (2008). Firm-level incentives and the
informativeness of accounting reports: an experiment in Brazil.
Working Paper. Recuperado em 19 september, 2009, de http://ssrn. com/abstract=1095781.
Lopes, A. L., & Martins, E. (2005). Teoria da Contabilidade: uma nova abordagem. São Paulo: Atlas.
Martinez A. L. (2001).“Gerenciamento” dos resultados contábeis: estudo empírico das companhias abertas brasileiras. Tese de doutorado, Programa de Pós-Graduação em Ciências Contábeis, Departamentos de Contabilidade e Atuária, Faculdade de Economia, Administração e Contabilidade da Universidade de São Paulo, São Paulo, SP, Brasil. Martinez, A. L. (2011, July-August). he role of analysts as gatekeepers:
enhancing transparency and curbing earnings management in Brazil.
RAC – Revista de Administração Contemporânea, Curitiba, 15 (4), 712-730.
Martinez, A. L., & Castro, M. A. R. (2009a). Ratings, custo de capital de terceiros e alistamento de resultados no Brasil. Anais do Encontro Brasileiro de Finanças, SBFin, São Leopoldo, RS, Brasil, 9.
Martinez, A. L., & Castro, M. A. R. (2009b, novembro-dezembro). Income smoothing, custo de capital de terceiros e estrutura de capital no Brasil. Revista de Administração Mackenzie – RAM, São Paulo, edição especial, 10 (6), 25-46.
Martinez, A. L., & Castro M. A. R. (2011, January-March). he smoothing hypothesis, stock returns and risk in Brazil. BAR, Curitiba, 8 (1), 1-20. Martins, G. A. (2002). Estatística geral e aplicada (2. ed.). São Paulo: Atlas. Martins, G. A., & heóphilo, C. R. (2007). Metodologia da investigação
cientíica para ciências sociais aplicadas. São Paulo: Atlas.
References
nomena are consequences of accounting choices, and one of them (income smoothing) has a direct influence on the other (conditional conservatism).
To verify empirically that the accounting phenome-na investigated in the present study are interrelated, two metrics were applied to the data: Eckel’s model (1981) was used to measure the degree of smoothing that companies employed, and Basu’s model (1997) was used to measure the conditional conservatism of companies. Although se models operate under different methodologies, the the-oretical framework of the study and the variables utilized in the models justified their joint use.
As noted, the accounting choices that make a firm more conservative (e.g., constantly reducing profits or smoothing them) directly influence its level of conditional conserva-tism; for example, highly conservative firms might comple-tely mitigate a loss through accounting procedures. When a group of companies practices conservatism continuously over time (even in excess), the accounting numbers disclo-sed are distorted, which affects the economic decisions of agents in the market.
The models used in this study confirmed the
hypothe-sis that firms that interfere the least with their results (e.g., by avoiding the use of income smoothing practices) have a greater ability to recognize future economic losses.
The results of the present study implicate the need for more monitoring of the choices and the accounting practi-ces that are adopted by firms; for example, regulators could establish policies to improve the quality of the informatio-nal environment, investors and shareholders could monitor the decisions of executives, and creditors could establish clauses in contracts requiring the timely disclosure of bad economic news.
Michelson, S. E., Jordan-Wagner, J., & Wootton, C. W. (1995, December). A market based analysis of income smoothing. Journal of Business Finance and Accounting, 22 (8), 1179-1193.
Pimentel, R. C. (2009). Accounting earnings properties and determinants of earnings response coeicient in Brazil. Tese de doutorado, Programa de Pós-Graduação em Ciências Contábeis, Departamento de Contabilidade e Atuária, Faculdade de Economia, Administração e Contabilidade da Universidade de São Paulo, São Paulo, SP, Brasil. Ryan, S. (2006). Identifying conditional conservatism. European
Accounting Review, 15 (4), 511-525.
Sarlo Neto, A. (2008). Relação entre a estrutura de propriedade e a informatividade dos lucros contábeis no mercado brasileiro. Tese de
doutorado, Programa de Pós-Graduação em Ciências Contábeis, Departamentos de Contabilidade e Atuária, Faculdade de Economia, Administração e Contabilidade da Universidade de São Paulo, São Paulo, SP, Brasil.
Scott, W. R. (2009). Financial accounting theory (5th ed.). Toronto: Pearson Education Canada.
Valipour, H., Talebnia, G., & Javanmard, S. A. (2011, December). he interaction of income smoothing and conditional accounting conservatism: Empirical evidence from Iran. African Journal of Business Management, 5 (34), 13302-13308.