130 Rev Bras Med Esporte – Vol. 19, No 2 – March/April, 2013
SUBGROUP DISTRIBUTION BASED ON PHYSIOLOGICAL
RESPONSES IN PROFESSIONAL SOCCER PLAYERS BY
K-MEANS CLUSTER TECHNIQUE
Luiz Fernando Novack1
Vitor Bertoli Nascimento1
Fabiano de Macedo Salgueirosa1,2
Luís Felipe Carignano1
André Fornaziero1
Elton Bonfim Gomes1
Raul Osiecki1
1. Federal University of Paraná – UFPR, Center of Studies of Physical Performance – CEPEFIS – Curitiba, Paraná, Brazil.
2. Tuiuti University of Paraná – UTP – Curitiba, Paraná, Brazil.
Mailing address:
Rua Coração de Maria, 92, Jardim Botânico 80215-370 – Curitiba, PR, Brasil E-mail: vitorbertolinascimento@yahoo. com.br
ABSTRACT
Introduction: Physical fitness in soccer needs to be constantly updated due to current demands in contemporary soccer. Objective: Therefore, the purpose of this study was to assess the sensitivity of the statistical K-means Clustering in the distribution of groups based on physiological responses relevant to soccer. Methods: The athletes underwent anthropometric evaluations to determine the percentage of fat (%F) and lean mass (LM), treadmill incremental test to obtain the VO2 maximum (VO2max) and
ventilatory threshold velocity (VL), as well as testing field for agility (AG) and vertical jump (VJ). Data were analyzed by Kruskal-Wallis and distribution of groups was developed by the technique of Cluster K-means as the similarities of the players with these physiological variables, assuming a significance level of p < 0.05. The results showed that both groups differed significantly only with respect to VJ (p < 0,001), LM (p < 0.001), VL (p = 0.011) and VO2max (p = 0,029) indicating that the athletes for these
variables need to be distributed in groups. However the %F and AG (p = 0.317; p = 0.922) respectively, were not different indicating that these variables can be improved in all athletes collectively. Conclusion: Given these results, we conclude that the distribution of groups by K-means clustering technique can be performed using physiological responses of athletes as well as optimize the training for the professional soccer players can focus on the main training needs that athletes have in common regardless of the tactical function exercised in the field.
Keywords: cluster analysis, physical education and training, soccer.
INTRODUCTION
In a soccer game, the different tactical functions played by each athlete require different physiological needs1, which also require
differentiated adaptations in the physiological processes2. Soccer
is a sports modality which implies in the practice of many inter-mittent exercises of variable intensity3, with recruitment of many
energy sources and different behavior form the body when facing the external load received, and it can hence be characterized as a sport with aerobic-anaerobic metabolic demand4.
A great difficulty in the physical preparation in soccer is the need to work with a great number of athletes in a team, and de-spite of that, lead in consideration the inter-individual variability principle. A way of decreasing this problem would be subdividing the athletes in smaller groups according to similar physiological responses, specific characteristics of the tactile function and need of development of physical abilities in common. For instance, a group of athletes predominantly composed of left and right-backs and forwards, presenting high indices of aerobic power, but deficit in the velocity characteristic; therefore, similar training needs.
The K- means cluster (grouping analysis) is a non-hyerarchic statistical instrument used to classify a set of values of a sample in groups which have characteristics as similar as possible between each other, making different classification groups determined a priori to the test. The same way it preserves the values within each group which are very close; it performs the heterogeneity of these sets of data grouping them in clusters (grouping) as distinct as possible 5-7.
The algorithm for the K-means clusters randomly chooses a centroid within each variable and separates the groups’ elements through the distance between elements and the centroid, aggre-gating elements closer to the centroid through Euclidian distance. After the groups’ formation, an F test is used to verify whether the groups are statistically different, justifying hence its formation5.
Thus, the aim of the present study was to demonstrate the use of the K-means Clustering technique in the identification of groups based on physiological variables of a professional soccer team.
METHODS
Participants
The non-probabilistic sample used was composed of 33 profes-sional athletes namely: seven central forwards, four forwards, two goalkeepers, six wide midfielders, 11 midfielders and five midfield sweepers of a professional club from the city of Curitiba-PR, par-ticipant of the first league of the Brazilian Championship (table 1). In order to participate in the present study, all players signed the Free and Clarified Consent Form (TCLE), which contained informa-tion about the tests protocols of the study, as well as the probable risks and benefits to the volunteers. The TCLE was previously de-signed and approved by the Ethics in Research Committee of the Federal University of Paraná under the number: 1024.149.10.10/2010.
Anthropometric analyses
The anthropometric evaluations were always performed by the same evaluator, with experience for more than five years in
131
Rev Bras Med Esporte – Vol. 19, No 2 – March/April, 2013
characterized by the ventilation (VE) and expired carbonic gas volume (VCO2) ratio was used for determination of the ventilatory threshold, a criterion named anaerobic threshold of gas exchange.
The moment the sudden increase occurred was determined based on the insertion of two lines by visual inspection, so that it was possible to determine the velocity corresponding to this marker during the incremental test.
Agility and vertical jump tests
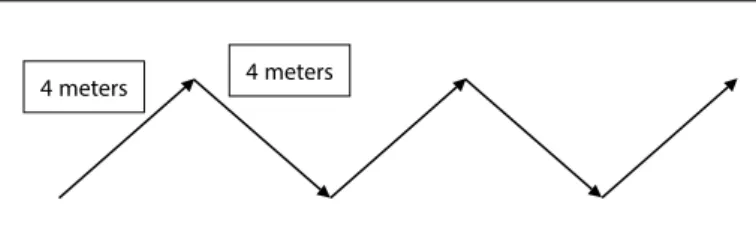
Agility was assessed with the Little and Williams test12. This test
consists of a 20 m path with successive changes of direction at every four meters (figure 1). Two pairs of photoelectric cells (Cefise®
Speed Test 6.0) were placed, one pair at the beginning (0 m) and another at the end of the path (20 m). The athletes started the test passing by the first pair of photoelectric cells, starting the time count, performing all the changes of direction marked until crossing the second pair of photoelectric cells at the end of the 20 m path, where the time count ended. Each participant was allowed to perform the path once for familiarization with the test, followed by a recovery period of two minutes before the test itself.
The vertical jump was performed with the aid of a jump plat-form Jump System Fit (CEFISE®) with useful area of 500 mm x 5,000
mm, in counter movement with the aid of the upper limbs. During the test, the subjects performed kneee flexiono f approximately 110°, justified for being an optimum angle for application of force 13.
Table 1. Descriptive data of the athletes participating in the present study, composed of mean, standard deviation (SD), minimum and maximum values.
Variables Mean ± sd Minimum Maximum
Age (years) 22.54 ± 2.89 18.00 30.00 Body mass (kg) 75.32 ± 6.96 63.15 89.65
Stature (m) 1.78 ± 0.05 1.67 1.90
%F 12.21 ± 1.70 8.87 15.54
LM (kg) 66.00 ± 5.56 56.77 77.79
VO2max (ml/kg/min) 59.77 ± 3.31 50.00 66.80
physical evaluations involving professional soccer athletes. In order to participate in the evaluation procedures the individuals did not perform physical exercises in the 24 hours before the tests and, in order to avoid circadian variations, all the evaluations were performed at the same period of the day (from eight to ten o’clock in the morning). Initially, stature and body mass were verified with a Sanny stadiometer with precision of one millimeter and a Toledo scale with precision of 50 grams.
Chest, biceps, subscapular, triceps, mid-axillary, suprailiac, abdominal, mid-thigh and calf skinfold measurements were collected using a Harpenden adipometer with precision of 0.2 mm and pressure of 10 g/mm2. The measurements were performed
according to the technique described by Petroski8.
Body composition (%F) was analyzed using the equation de-veloped by Faulkner9 and the lean mass (LM) index by subtraction
of the body mass values by the fat equivalent.
Incremental test and VO2max velocity (vVO2max)
Maximum exertion was evaluated on a treadmill model X-Fit 7 Power Treadmill. Maximum oxygen consumption (VO2max) was
deter-mined with the metabolic system Parvo Medics TrueOne 2400
Me-tabolic Measurement System – USA, analyzing data breath-by-breath and the gas analyzer was calibrated according to the manufacturer’s specifications every three tests with the aid of a three-liter calibrating syringe (Hans Hudolf, USA) and the gas cylinder containing a known amount of CO2 3.98% and 16.02% of O2.
The used protocol in the present study was incremental, with steady inclination of one per cent, starting at the velocity of eight km/h with increments of one km/h in one-minute stages. The VO2max
was obtained according to the criteria established by the ACSM10 as
oxygen acquisition plateau with exertion intensity increase (< 2.1 ml/kg/min), respiratory quotient (R) above 1.15, signs of extreme physical tiredness (voluntary exhaustion), as well as heart rate in the last stage ± 10 bpm in relation to the predicted maximum heart rate (HRMax). The HRMax was determined by the equation HRMax = 220-age, which despite not being specific to this population, was used only to characterize the physical exertion of the athletes, always added to the remaining criteria mentioned before.
The VO2max was determined through the values obtained in the
30 final seconds of the two progressive stages when there was no variation (<2.1 ml/kg/min), while the running velocity correspon-ding to the VO2max (vVO2max) was the exercise intensity at which the lowest VO2max value was obtained.
The velocity corresponding to the ventilatory threshold (VLim) was determined based on the ventilatory responses derived from the maximum incremental test; the protocol described by Meyer et al.11
Figure 1. Representation of the path to be completed by the participant during the agility test (Little and Williams12).
4 meters 4 meters
Statistical analysis
Group distribution in relation to the position on the field was analyzed with the Kruskal-Wallis test. The data were calculated so that the groups were statistically arranged by similarities derived from the applied tests, determined by K-means Cluster technique. The differences of the variables between each group was assessed through the F test adopting significance level of p < 0.05 in all analyses, using the SPSS 17 software.
RESULTS
The anthropometric and physiological measurements obtained from the athletes involved in the present study are represented in table 1, composed of mean, standard deviation, minimum and maximum values.
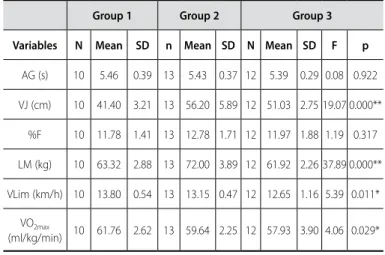
Cluster K-means, three groups were arranged through statisti-cal analysis of group distribution by K-means cluster, where the number of players distributed in each group (n) and the F test to demonstrate the differences between each group are presented in the table below (Tabela 2).
132 Rev Bras Med Esporte – Vol. 19, No 2 – March/April, 2013
DISCUSSION
Some studies indicate that the physical training adopted in soccer does not present the specificity necessary to the different actions during the game14.
Balikian et al.1, in a study with the aim to compare soccer players of
different positions concerning the Anaerobic Threshold (Lan) variable, found significant differences when confronting the VLim results of goalkeepers (12.66 ± 0.89 km/h) with the remaining positions and when comparing the results of the laterals (14.33 ± 0.66 km/h) and midfielders (14.11 ± 0.51 km/h) compared with the central forwards (13.15 ± 1.56 km/h) and forwards (13.23 ± 0.86 km/h).
Wittich et al.15 found significant differences when compared
the %F of soccer players who played as midfielders (13.6 ± 3.3%) compared with central forwards (11.2 ± 2.8%) and forwards (11.0 ± 2.3%). As in our study, the author did not find significant differences in the LM of central forwards (75.3 ± 4.7 kg), midfielders (75.4 ± 5.3 kg) and forwards (75.5 ± 5.4 kg).
Santos and Kokubun14, in a study with the aim to detect
oc-casional differences in the body composition, VO2max, Lan, and VJ
concerning the functional specialization of soccer athletes, did not find significant differences in the body fat percentage (midfield sweepers: 10.7 ± 2.2%; laterals: 11.4 ± 2.7%; midfielders: 12.0 ± 2.2% and forwards: 12.1 ± 2.9%) and VLim (midfield sweepers: 14.5 ± 1.7 km/h; laterals: 14.4 ± 1.2 km/h; midfielders; 14.0 ± 1.0 km/h and forwards: 12.9 ± 1.3 km/h), corroborating the results of this investigation.
The same fact did not occur with the VO2max (midfield sweepers: 59.5 ± 6.7 ml/kg/min; laterals: 59.3 ± 3.6 ml/kg/min; midfielders: 56.8 ± 5.5 ml/kg/min; forwards: 54.9 ± 8.2 ml/kg/min) and VJ (midfield sweepers: 33.4 ± 4.9 cm; laterals: 35.7 ± 4.2 cm; midfielders: 36.3 ± 3.9 cm; forwards: 37.5 ± 4.3 cm), where the authors found significant differences in VO2max between laterals
(59.3 ± 3.6 ml/kg/min) and forwards (54.9 ± 8.2 ml/kg/min), as well as significant difference in the VJ test with the midfielders (36.3 ± 3.9 cm) and forwards (37.5 ± 4.3 cm).
Balikian et al.1 compared soccer of different positions concerning
the VO2max, and did not find significant differences, except concerning
the goalkeepers, who presented oxygen maximum consumption values lower than the athletes who play in the front.
Concerning the use of the K-means cluster, we found in the literature some studies involving physical exercise and sport. Bamman et al.7 applied the statistical technique to assess the
myogenic expression during myofibrillar hypertrophy after resisted training in humans.
Petrella et al.16 used the K-means cluster to classify individuals,
having as criterion the extent to which they have been responsive concerning the myofibrillar hypertrophy after resisted training applied to the knee extensor musculature.
Paes et al.6 applied the technique with the aim to classify young
athletes according to their level of sports performance, having as parameters anthropometric variables and physical fitness tests.
Kiss et al.17 indicated that this statistical technique has been
used in the evaluation of the long-term training process; however, with the aim to select sports talents.
Chan et al.18, based on technical variables obtained during the
Table 3. Group distribution by tactical functions and frequency of participation in each of the groups.
Tactical function
Group 1 Group 2 Group 3 Frequency % Frequency % Frequency %
Forward - - 2 15.4 2 16.7
Lateral 3 30 - - 3 25.0
Midfielder 4 40 2 15.4 5 41.7
Midfield sweeper 1 10 3 23.1 1 8.3
Central forward 2 20 5 38.5 -
-Goalkeeper - - 1 7.6 1 8.3
Total 10 100.0 13 100.0 12 100.0
VJ (p < 0.001), indicating that these groups should receive differentiated training for these values; for the AG and %F variables the groups are homogeneous, which did not justify the sub-groups.
We can observe the display of the groups through K-mean clus-ter below concerning position on the field, where no significant difference was evidenced (p = 0.198) between them (tabela 3).
After group sorting by the statistically significant characteristics (L, VJ, VLim and VO2max), a gradual distribution between groups and the distribution concerning the position on the field was observed. Concerning the VJ, it is possible to rank groups, where Group 2 (56.2 ± 5.89) with the best result, Group 3 (51.3 ± 2.75) intermediate, followed by Group 1 (41.4 ± 3.21), since these groups were statisti-cally different, confirmed by the F test (p = 0.000).
Concerning physiological characteristics such as VO2max and VLim, Group 1 presented (VO2max 61.76 ± 2.62; VLim 13.08 ± 0.54),
Group 2 (VO2max 59.64 ± 2.25; VLim 13.15 ± 0.47) and Group 3 (VO2max 57.93 ± 3.9; VLim 12.65 ± 1.16).
Thus, Group 1 presented better aerobic performance and was characterized by higher concentration of midfield players (40%) and lateral players (30%). Group 2, characterized with better VJ and LM result, revealed higher concentration of central forwards (38.5%) and midfield sweepers (23.1%).
This ranking and positioning of the players on the field within each group allows better training guidance applied to the groups.
Table 2. Mean and standard deviation distribution of the Agility (AG), Vertical Jump (VJ), Fat Percentage (%F), Lean Mass (LM), Threshold Velocity (VLim) and VO2max, variables
in each group by K-means cluster.
Group 1 Group 2 Group 3 Variables N Mean SD n Mean SD N Mean SD F p
AG (s) 10 5.46 0.39 13 5.43 0.37 12 5.39 0.29 0.08 0.922 VJ (cm) 10 41.40 3.21 13 56.20 5.89 12 51.03 2.75 19.07 0.000**
%F 10 11.78 1.41 13 12.78 1.71 12 11.97 1.88 1.19 0.317 LM (kg) 10 63.32 2.88 13 72.00 3.89 12 61.92 2.26 37.89 0.000** VLim (km/h) 10 13.80 0.54 13 13.15 0.47 12 12.65 1.16 5.39 0.011*
VO2max
(ml/kg/min) 10 61.76 2.62 13 59.64 2.25 12 57.93 3.90 4.06 0.029*
133
Rev Bras Med Esporte – Vol. 19, No 2 – March/April, 2013
game (technical scout), used the statistical technique K-means cluster to define different types of players within each position in a team of the National Hockey League (NHL).
Unfortunately, we could not find in the literature other scientific studies which have used the K-means cluster technique as an alternative to place athletes closer based on their main physiological needs, making it impossible hence to compare the results obtained in the present study with the remaining investigations involving soccer athletes or other team sports.
The present study demonstrated that common needs to the players concerning improvement in LM, VJ, VLim and VO2max can be
found; however, AG and %F did not demonstrate difference even when athletes with different tactical functions are assessed as a whole.
Therefore, this statistical technique seems to demonstrate sensi-tivity in distinguishing the level of physical fitness of the professional soccer players who are under the same training regimen, except for the goalkeepers of the sample who develop specific training for their functions.
Within the context of physical preparation in soccer, the group distribution by the used technique in the present study may fa-cilitate the training plan, optimizing the time for development of physical abilities the athletes present deficiencies.
Thus, further research with the aim to investigate the sensitivity
of the K-means cluster technique in demonstrating the alterations of physiological parameters after a training period between groups, besides sorting the athletes in a more homogeneous manner during the main competitions along the annual schedule, are suggested. Since the K-means cluster technique promotes the development of group formation based on distribution of similar elements, the present study had the aim to aid the professionals who develop their daily activities with team sports, an alternative and efficient methodology concerning improvement of physical preparation of athletes in a time the physical assessment become necessary within the annual training program of the sports teams. It is considered that the diagnostic and structured planning of the season depends on tests choice to be performed19-21.
CONCLUSION
We can conclude that the K-means cluster technique can be used as an alternative in the formation of homogeneous groups, demonstrating hence a non-visual, but mathematical and scientific means in the organization of the physical training for sports teams, grouping the athletes according to their main training needs.
All authors have declared there is not any potential conflict of interests concerning this article.
REFERENCES
1. Balikian P, Lourenção A, RIbeiro LF, Festuccia WTL, Neiva CM. Consumo máximo de oxigênio e limiar anaeróbio de jogadores de futebol: comparação entre as diferentes posições. Rev Bras Med Esporte 2002;8:32-6.
2. Reilly T. Energetics of high-intensity exercise (soccer) with particular reference to fatigue. J Sports Sci 1997;15:257-63.
3. Ekblom B. Applied physiology of soccer. Sports Med 1993;3:50-60.
4. Reilly T, Bangsbo J, Franks A. Anthropometric and physiological predispositions for elite soccer. J Sports Science 2000;18:669-83.
5. Bassad WO, Miazaki ES, Andrade DF. Introdução à Análise de Agrupamentos. 9º Simpósio Brasileiro de Probabilidade e Estatística. IME/USP, 1990.
6. Paes FO, Uezu R, Massa M, Böhme MTS. Classificação e seleção de jovens atletas através da análise de cluster. R da Educação Física/UEM 2008;19:369-75.
7. Bamman MM, Petrella JK, Kim JS, Mayhew DL, Cross JM. Cluster analysis tests the importance of myogenic gene expression during myofiber hypertrophy in humans. J Appl Physiol 2007;102:2232-9.
8. Petroski EL. Antropometria: técnicas e padronizações. Porto Alegre: Palotti, 1995.
9. Faulkner JA. Physiology of swimming and diving. Baltimore: Academic Press, 1968;415-46.
10. American College of Sports Medicine. ACSM’s Guidelines for exercise testing and prescription. 8 ed. Lippincott: Williams & Wilkins, 2010.
11. Meyer T, Lucia A, Earnest CP, Kindermann W. A conceptual framework for performance diagnosis and training prescription from submaximal gas exchange parameters – Theory and application, Int J Sports Med 2005;26:38-48.
12. Little T, Williams AG. Specificity of acceleration, maximum speed, and agility in professional soccer players. J Strength Cond Res 2005;19:76-8.
13. Hespanhol JE, Silva Neto LG, Arruda M. Confiabilidade do teste de salto vertical com 4 séries de 15 segundos. Rev Bras Med Esporte 2006;12:95-8.
14. Santos JW, Kokubun E. Limiar anaeróbio de atletas profissionais de futebol nas diferentes posições de jogo. Motriz 1999;5:1
15. Wittich A, Oliveri MB, Rotemberg E, Mautalen C. Body composition of professional football (soccer) players determined by dual x-ray absorptiometry. J Clin Densit 2001;4:51-5.
16. Petrella JK, Kim J, Mayhew DL, Cross JM, Bamman MM. Potent myofiber hypertrophy during resistance training in humans is associated with satellite cell-mediated myonuclear addition: a cluster analysis. J Appl Physiol 2008;104:1736-42.
17. Kiss MAPDM, Böhme MTS, Mansoldo AC, Degaki E, Regazzini M. Desempenho e Talento Esportivos. Rev Paul Educ Fís 2004;18:89-100.
18. Chan TCY, Cho JA, Novati, DC. Quantifying the Contribution of NHL Player Types to Team Performance. Interfaces 2012;42:131-45.
19. Braz TV, Spigolon LMP, Borin JP. Proposta de bacteria de testes para monitoramento das capacidades motoras em futebolistas. R. da Educação Física/UEM 2009;20:569-575.
20. Taskin H. Evaluating sprinting ability, density of acceleration, and speed dribbling ability of professional soccer players with respect to their positions. J Strength Cond Res 2008;22:1481-6.