Reliability (test-retest) of the
Swedish
“Demand-Control-Support Questionnaire” scale
among industrial restaurants
workers, state of Rio de Janeiro,
Brazil
Odaleia Barbosa de Aguiar
IMaria de Jesus Mendes da Fonseca
IIJoaquim Gonçalves Valente
III Departamento de Nutrição Aplicada do Instituto de Nutrição da Universidade do Estado do Rio de Janeiro - UERJ
II Departamento de Epidemiologia da Escola Nacional de Saúde Pública da Fundação Oswaldo Cruz – FIOCRUZ, Rio de Janeiro, RJ
Correspondência: Odaleia Barbosa de Aguiar.Departamento de Nutrição Aplicada, Instituto de Nutrição da Universidade do Estado do Rio de Janeiro – UERJ. Rua São Francisco Xavier, 524 sala 12026 Bl D, Maracanã – Rio de Janeiro, RJ CEP 20550-013. E-mail: [email protected]
Abstract
Objective: This study aims to verify
the test-retest reliability of the Portuguese version of the Swedish “ Demand-Control-Support Questionnaire (DCSQ)” scale in a population of workers with low education.
Method: The questionnaire was
adminis-tered to 52 employees of three restaurants in industrial companies in Rio de Janeiro twice, with intervals from 7 to 15 days. As indicators of stability, the Intraclass Cor-relation Coeficient (ICC), weighted Kappa statistics and Bland and Altman’s plot were used; for internal consistency evaluation, Cronbach’s alpha coefficient was used.
Results: The ICCs for the “psychological
demand”, “decision latitude” and “social support in the workplace” dimensions were 0.70, 0.68 and 0.80, respectively. Cronbach’s alpha showed the following results in the retest for the previously mentioned di-mensions: 0.75, 0.50 and 0.82, respectively.
Conclusions: Although the outcome of the
Demand-Control scale has been considered low for Cronbach’s alpha, other reliability indicators point to good stability of the in-strument, allowing its use in studies on the association between job stress and health-related outcomes.
Keywords: Reproducibility of Results;
Introduction
Considering the context of restructur-ing of the world economy, linked to the redefinitions of work processes, efforts have been required to develop objective scales, which can assess work-related stress with outcomes in the sphere of health1. In
the 1970s2, studies on stress emphasizing
workers’ individual characteristics began, whereas the evaluation of psychosocial aspects of work, such as psychological de-mand, decision latitude and social support, has largely dominated the investigations since the 1980s3.
Recently, the use of instruments that evaluate psychosocial aspects of work has increased considerably in the literature4.
The questionnaire that has been frequently used in the United States, Canada, Europe and Japan is the Job Content Questionnaire (JCQ), which combines two psychosocial aspects of work: psychological demand and decision latitude1,2. Psychological demand
is deined as the individual’s perception of the intensity with which he is required or requested to perform their tasks and of the existing conlicts in the work relationship. The level of decision latitude would be the individual’s capacity to decide about their work program or how to perform it, expressed by the authority to make deci-sions and develop abilities4,5. Subsequently,
Johnson et al. added the dimension of social support in the workplace to the model, which results from the interaction occur-ring among workers and between workers and supervisors in the work environment 6.
The original “Job Strain Model” pre-dicts that highly stressful jobs are those that combine high psychological demand originated from work and low control of such work, classiied as high-demand. In addition, the model also predicts that the combination of high psychological demand and high decision latitude leads to high-strain jobs, where the challenges resulting from this work develop one’s abilities, trust, competence and well-being2. However, the
combination of low psychological demand
and low decision latitude point to a reduc-tion in the capacity to provide solureduc-tions for the dificulties associated with work activi-ties, deined as passive jobs. The combina-tion of low psychological demand and high decision latitude indicates low demand in the workplace and, probably, an “ideal” work process situation7.Social support in
the workplace has been seen as a buffer in the effects of high-demand work, enabling social interaction, existing in the work en-vironment among coworkers and between these and the managers, to be observed. To understand how the work environment affects the well-being of workers has been of great interest to researchers in the area of health and work4,6. Investigations on the
association between stress in the workplace and different outcomes, such as psychiatric disorders3, interruption of routine activities8
and, especially, cardiovascular problems, have been described in the literature2,9,10.
The JCQ comprises 49 questions and deals with the following dimensions: psychological demand (nine questions), physical demand (ive questions), decision latitude - including two components, use of abilities (six questions) and authority to make decisions (11 questions) - and social support in the workplace from manage-ment (ive questions) and coworkers (six questions), and insecurity in the workplace (six questions). There is one question about the level of qualiication required for the work performed (corresponding to the level of education required in the position occupied)2,4.
The short modiied JCQ version was in-troduced by Theorell, in 1988, the Swedish “Demand-Control-Support Questionnaire – DCSQ”, including three dimensions pro-posed in the JCQ: psychological demand, decision latitude and social support7. This
perform tasks, and one refers to conlict among different demands. In the items re-lated to decision latitude, four refer to use and development of abilities and two, to the autonomy to make decisions about the work process. The “social support in the work-place” dimension includes six questions about relationships between coworkers and managers7. Both scales were adapted
to Portuguese and used in epidemiological studies in Brazil. The JCQ was applied to nurses and oil reinery workers3,9 and the
DCSQ, to a cohort of civil servants of a uni-versity in the state of Rio de Janeiro, in the
Pró-Saúde (Pro-Health) Study10,11.
In studies on reliability of scales in use in Brazil, both from the JCQ and the DCSQ, study populations predominantly showed a high level of education, without the pres-ence of results of workers with a low level of education.
To obtain a reliable measure has become a challenge to researchers in the areas of medical clinic and epidemiology, due to the dificulty and impossibility to control all possible sources of variability of the measure12. To test the reliability of studies
has become an essential step to guarantee adequacy of the information gathered in the ongoing investigation and its repro-ducibility, which represents the extension in which the results obtained by a speciic instrument or test can be reproducible in other populations13,14.
The present study aimed to observe the test-retest reliability (intra-observer) of the Portuguese version of the Swedish “Demand-Control-Support Questionnaire (DCSQ)” scale in a population of workers with low level of education.
Methods
A test-retest study with an interval from seven to 15 days between applications was performed to enable the analysis of reli-ability of the Swedish “Demand-Control-Support Questionnaire (DCSQ)”. All workers from the three restaurants, selected for convenience from a meal delivery company
established in the city of Rio de Janeiro, were interviewed. Interviews occurred in the company’s cafeteria during the period when no meals were distributed.
Criteria for exclusion from the study were as follows: night-shift workers, worker on a sick or maternity leave, length of stay in the job of less than 30 days or workers with no direct participation in the meal produc-tion process were also excluded.
Of all 56 eligible workers in these three restaurants, four did not participate: one was dismissed in the week following test application, two were on vacation in this period and one refused to participate. Thus, the population that performed the test-retest totaled 52 workers (92.8%) and none refused to repeat the interview. Questionnaires were applied face-to-face by only one interviewer, during their work time, after reading and signing an Informed Consent Form.
Workers interviewed in this study on test-retest showed characteristics, such as sex, age, level of education and work process, that were similar to those of the population that would be investigated in a different study entitled, “Pressão no traba-lho: impedimento das atividades laborais e ambiente de trabalho entre trabalhadores dos Restaurantes Populares do Rio de Janei-ro” (“Pressure in the workplace: an obstacle to work activities and environment among workers of Budget Restaurants in Rio de Janeiro”), in nine budget restaurants ope-rating in 200715.
The following variables were included: professional qualification, employment situation and socio-demographic charac-teristics. The DCSQ scale used had been translated and adapted to Portuguese by the Pró-Saúde study7.
The present study was approved by the
Data Analysis
Standardized score calculation of each of the three dimensions was performed to analyze data, attributing points to each response selected. The “psychological de-mand” and “decision latitude” dimensions could be given the following values: (4) frequently, (3) sometimes, (2) rarely, and (1) never or almost never for these dimen-sions. The “social support in the workplace” dimension could be given the following values: (4) I totally agree, (3) I agree more than disagree, (2) I disagree more than agree, and (1) I totally disagree.
A score was created for the psychological demand scale, based on the sum of values obtained from the ive questions about de-mand and varying between ive and 20. The question, “Do you have enough time to per-form all the tasks of your job?”, has a reverse direction. Thus, a score 1 was attributed to “frequently”; a score 2 to “sometimes”; a score 3 to “rarely”, and a score 4 to “never” or “almost never”. The reason is that the more frequent the time to perform work, the lower the weight of demand.
A score based on the sum of values, ob-tained from the six questions about control and varying between six and 24, was created for the “decision latitude” scale. In this di-mension, the question, “In your job, do you have to repeat the same tasks many times?”, also had a reverse direction. As a result, the less frequent the repetition of tasks, the more control over work one had.
The third and last dimension, social sup-port in the workplace, was also created from the sum of values of scores of the six ques-tions about this support, varying between six and 24 points. None of the questions of this dimension had a reverse scoring.
Reliability of the Questionnaire Score
Reliability of the “psychological de-mand”, “decision latitude” and “social sup-port in the workplace” dimensions, resulting from the sum of scores, was evaluated using the intraclass correlation coeficient (ICC)
with a 95% confidence interval (CI) and Bland & Altman plot14,16.
The ICC has been considered appro-priate to evaluate the consistency and conformity of studies, as it is capable of estimating the proportion of total variation due to the variability among independent units of analyses. The ICC is equivalent to quadratic weighted kappa statistics for continuous variables and it has the same amplitude of possible values (from zero to +1.0, in the case of perfect agreement). The limitation to this method is in the dependence on the level of variability in and among the observations, affecting the ICC results2. To analyze these results,
calculation was performed using analysis of variance (ANOVA), one-way model with ixed effects17.
Bland & Altman plot enables the evalu-ation of the pattern of agreement or disa-greement among repeated measurements, or among a given measurement and the gold standard, in addition to its incorpora-ting certain limits of tolerance. In this plot, the magnitude of disagreement (including systematic differences) and strange values (outliers) can be seen and trends can be veriied,14,16.
Reliability of Questionnaire Questions
Reliability of items of the three dimen-sions was evaluated by weighted kappa, once these items have the form of ordinal variables. Next, agreement was evaluated, considering the perfect level of agreement (main diagonal in the contingency table), and so was the magnitude of disagreement, by attributing different weights, according to the greater or lower proximity among variable categories14. Criteria proposed by
Reliability of Internal Consistency of the Questionnaire
Cronbach’s alpha coeficient was used in the analysis of internal consistency of scores of DCSQ dimensions. This index identiies the homogeneity of questions (item) that aims to measure the same construct13,
con-sidering the variance attributable to indivi-duals and the variance attributable to the interaction between individuals and items. In addition, this estimate is affected by the number of items, intercorrelations among items and instrument dimensionalities18.
Bland & Altman (1997) recommend alpha values between 0.7 and 0.8 as satisfactory to compare groups. When alpha is applied to a construct aimed at clinical evaluation, a minimum of 0.9 could be considered19.
RESULTS
All the 52 workers who participated in the test-retest were 38.4 years of age on average, with a standard deviation (SD) of 10.5, corresponding to a number of males equal to 75% of the total. Among interviewees, 32.7% had not completed ele-mentary school, 15.4% had only completed elementary school; 25.0% had not comple-ted high-school, and 19.2% had complecomple-ted high-school. Only nutritionists had a higher education (7.7%). Mean length of work in the kitchens was 5.2 (SD=5.6).
As regards the results obtained in the reliability study, Table 1 shows that the ICC for psychological demand, decision latitude and social support in the workplace was 0.70
(95% CI: 0.56-0.83), 0.68 (95% CI: 0.53-0.82) and 0.80 (95% CI:0.71-0.90) respectively, indicating that agreements were good in the three dimensions, according to cut-off points attributed by Byrt.
Cronbach’s alpha showed the following results for the “psychological demand”, “decision latitude” and “social support in the workplace” dimensions: in the test, 0.59, 0.33 and 0.66; and, in the retest, 0.75, 0.50 and 0.82, respectively. Variations in the estimates of internal consistency were not observed, according to sex or age group (data not shown).
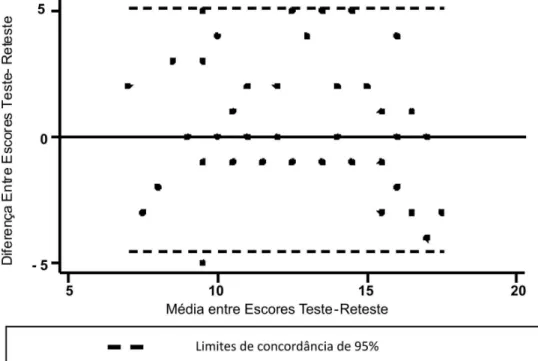
In the analysis of “psychological de-mand” and “decision latitude” scales by the Bland-Altman method, in Figures 1 and 2 respectively, the means of scores between test and retest are found in the x-axis. The y-axis shows the difference between scores of the first (test) and second interviews (retest). Figure 1 shows the mean of diffe-rences, 0.31, and 95% of the “psychological demand” values are found in the limits of agreement, between the mean of differences plus two standard deviations (5.1 psycho-logical demand) and minus two standard deviations (-4.4 psychological demand). The information about psychological demand in the workplace revealed a positive difference between test and retest, indicating a higher concentration in the upper limit of the plot, suggesting a trend of underestimation in the retest, when compared to the test.
In terms of decision latitude, Figure 2 shows that the mean of 0.36 differences and 95% of values of decision latitude are found between the mean of differences plus two
Tabela 1 - Estatística, Coeiciente de Correlação Intraclasse e Alfa de Cronbach das dimensões: Demanda Psicológica, Controle do trabalho e Apoio Social no Trabalho; Restaurantes Industriais, 2006.
Table 1 - Statistics, Intraclass Correlation Coeicient and Cronbach’s Alpha of the Dimensions: Psychological Demand, Decision Latitude and Social Support at Work; Industrial Restaurants, 2006.
DCSQ dimension Number of
items
Test Retest ICC (95% CI)
Mean score
SP Cronbach’s alpha
Mean score
SP Cronbach’s alpha
Psychological demand 5 13,0 2,9 0,59 12,7 3,3 0,75 0,70 (0,56 - 0,83)
Decision latitude 6 16,2 2,2 0,33 15,8 2,9 0,50 0,68 (0,53 - 0,82)
Social support in the workplace
Figure 1 - Bland & Altman’s Plot for Scores of Psychological Demand in Test and Retest.
Figure 2 - Bland & Altman’s Plot for Decision Latitude Scores in Test and Retest.
standard deviations (4.4 decision latitude) and minus two standard deviations (-3.7 decision latitude), with the coniguration of points indicating a smaller distance be-tween the point and the horizontal line. The
negative values, thus indicating an overesti-mation of informed values in the retest. In the calculation of weighted kappa values, values varying from 0.48 (fair) in item 5 to 0.63 (good) in item 2 were obtained for “psychological demand”, for each of the 17 items of the DCSQ questionnaire (Table 2).
In the “decision latitude” dimension, values varied between 0.37 (poor) in item 2 and 0.70 (good) in item 4. Item 3 showed a fair level of agreement, while the level of the other items was good.
In the case of “social support in the workplace”, variation was between 0.28 (poor) in item 1, which showed the lowest level of agreement between test and retest responses, and 0.86 (very good) in item
5. Moreover, item 2 showed a fair level of agreement; item 3, good; and items 4 and 6, very good.
DISCUSSION
Findings from this investigation show that, although the result of internal consis-tency of the scale for decision latitude was considered low, other reliability indicators point to good stability of the instrument.
Agreement between the information assessed in the test and that in the retest in industrial restaurant workers, seeking to observe the consistency and conformity of the study, was considered good. This indi-cates greater stability in the “psychological
Tabela 2 - Reliability of the DCSQ Questionnaire Questions
DCSQ Items Weighted
Kappa*
95% CI
Psychological demand
1. Do you have to perform your work tasks quickly? 0,61 (0,42-0,80)
2. Do you have to work intensely? (in other words, produce a lot in little time)
0,63 (0,47-0,80)
3. Does your work require too much from you? 0,57 (0,37-0,78)
4. Do you have enough time to perform all the tasks of your job?
0,56 (0,28-0,84)
5. Does your work usually involve contradictory or discordant requirements?
0,48 (0,24-0,72)
Decision latitude
1. Is it possible for you to learn new things through your work? 0,64 (0,38-0,91)
2. Does your work require much ability or specialized knowledge?
0,37 (0,03-0,70)
3. Does your work require you to show initiative? 0,53 (0,22-0,83)
4. In your job, do you have to repeat the same tasks many times?
0,70 (0,48-0,92)
5. Can you choose HOW to do your job? 0,68 (0,50-0,86)
6. Can you choose WHAT to do in your job? 0,62 (0,36-0,88)
Social support in the workplace
1. Is there a calm and pleasant environment where you work? 0,28 (0,00-0,57)
2. At work, do you have a good relationship with each other? 0,47 (0,25-0,68)
3. Can you rely on the support of your coworkers? 0,78 (0,57-0,99)
4. If you are not having a good day, do your coworkers understand you?
0,85 (0,74-0,97)
5. At work, do you have a good relationship with your superiors?
0,86 (0,53-1.00)
6. Do you like to work with your coworkers? 0,84 (0,43-1,00)
* ponderação quadrática [quadratic weighted]
demand” and “social support in the work-place” dimensions and lower stability in “decision latitude”. These results differ from the Pró-Saúde study (Alves, 2004), where the stability of responses assessed by the Intra-class Correlation Coeficient showed higher values, ICC= 0.88 for psychological demand, ICC=0.87 for decision latitude and ICC=0.86 for social support in the workplace. These differences may be attributed to the level of education, once the interpretation of the scale presupposes an understanding of the responses, in view of its not being direct.
Cronbach’s alpha showed differences between the test and retest, as it was low in the irst interview and closer to being ade-quate in the second application of the scale, with the exception of decision latitude. This can be partly explained by the fact that, in the test, the DCSQ scale was applied conco-mitantly with the other variables included in the questionnaire (socio-demographic variables and professional qualiication, for example), whereas only the DCSQ scale was applied in the retest. Individual results for the questions about decision latitude were much worse than those for “psychological demand” or “social support in the workpla-ce”. Items 2, “Does you work require much ability or specialized knowledge?”, and 4, “In your job, do you have to repeat the same tasks many times?”, were those showing the best correlations. With few exceptions, correlations between each question of each item and the inal score of each item impro-ved from the test to the retest.
In the process of adaptation of the scale to Portuguese, in the Pró-Saúde study, the following results were found for the internal consistency of the “psychological demand”, “decision latitude” and “social support in the workplace” dimensions: alpha of 0.72, 0.63 and 0.86, respectively7.
Josephson et al. (1997), using the short version of Karasek’s questionnaire in a population of nurses from Northern Swe-den, found a Cronbach’s alpha of 0.69 for “psychological demand” and 0.51 for “de-cision latitude”, in addition to low internal consistency for decision latitude21. Even in
studies where the level of education was considered high, the internal consistency of the “decision latitude” dimension did not show adequate results. The results found both in Brazil and Sweden were similar to the low internal consistency for “decision latitude” observed in the retest of the pre-sent study.
In the sectional study with the Job Con-tent Questionnaire ( JCQ), performed by Araújo and Karasek (2008), authors found low internal consistency for “psychologi-cal demand” (alpha=0.55) and decision latitude (alpha=0.62) among informal market workers22. According to authors,
“psychological demand” can have different meanings in distinct groups of the working population, in their cultural, social and oc-cupational contexts. However, in the study by Sanne et al. (2005), Cronbach’s alpha was adequate for “psychological demand” (0.73), “decision latitude” (0.74) and “social sup-port” (0.83)23. Moreover, studies performed
in Brazil that evaluated the “social support in the workplace” dimension have found the internal consistency to be very good7, 22.
Cortina (1993) warns that the internal consistency must be interpreted with cau-tion, given the fact that the same refers to the level of interrelationship among items, rather than the homogeneity and the fact that its use will be more appropriate in a set of data of a normal distribution. In addition, Cronbach’s alpha can change its result due to the number of items, intercorrelation among items and dimensionality18
.Bland-Altman plot has also been considered as a good measure of magnitude of validity, once it analyzes the pattern of disagreement between repeated measures, or between a given measure and the gold standard14,16.
This graphic form has been used in diffe-rent studies of reliability with continuous discrete variables to observe the hypothesis of normality of differences, according to the limits of agreement24,25. However, it was not
In the evaluation of weighted kappa for DCSQ scale questions, the lowest value attributed to item 5 of “psychological de-mand” can be due to the workers’ dificulty in interpreting “contradictory or discordant requirements”. As regards the low agreement of weighted kappa in item 2 of ”decision latitude”, one possible explanation would be the industrial restaurant workers’ dificulty in considering the fact that their activities require “ability” or “specialized knowledge”, once no previous professional experience in the area is required in the majority of cases of industrial restaurant personnel hired. The “social support” scale showed the greatest level of dificulty in understanding the options of responses by workers, due to its structure, which included items such as “agree more than disagree” or “disagree more than agree”. In item 1, “calm and plea-sant environment”, weighted kappa showed the lowest value of scale, perhaps due to the dificulty in attributing a perception of pleasantness and serenity to an industrial restaurant environment, which the question seeks to obtain, or due to a change of pattern of response in the scale.
Another possible explanation for the disagreements found can be associated with the time interval between the applications of both tests. Even considering the interval from seven to 15 days between both me-asurements, the items that comprise the dimensions can be subject to the understan-ding in the irst contact with the scale and the interviewee’s mood. Moreover, the rela-tionship between workers and work overlo-ad can affect the perception of psychosocial aspects in the work environment.
Among the study limitations, the impos-sibility of extrapolating results to the general
population should be emphasized, because this investigation only included workers, most of whom had a low level of education and were formally employed. However, the results found can be generalized to popu-lations of workers with a proile similar to those of industrial restaurants, or to those with a low level of education.
The DCSQ scale, which aims to assess work-related stress, is considered relatively short and simple, enabling its inclusion into a multidimensional questionnaire. None-theless, in the analysis of results of empiri-cal research on work-related stress, issues related to the world of work in different countries where they are applied should be considered, such as: questions about work organization, conditions of the work envi-ronment, level of technology, organization of labor movements, improvement of the legislation and worker’s socioeconomic con-ditions should be taken into consideration in health outcomes7.
Conclusion
Based on the findings of the present study, it could be concluded that, despite the low result of internal consistency of the “decision latitude” scale, other indicators of reliability point to good stability of the instrument. The use of the DCSQ scale in the population of workers in the private sector, who have a low level of education, can be reproduced in other populations, with similar characteristics and a broader sample. Thus, the fragility of certain items, which have been shown in the literature in populations with higher levels of education, can be conirmed.
References
1. Landsbergis P, Theorell T. Measurement of psychosocial workplace exposure variables. Occup Med 2000; 15(1): 163-88.
2. Karasek R, Baker D, Marxer F, Ahlbom A, Theorell T. Job decision latitude, job demands, and cardiovascular disease: a prospective study of Swedish men. AJPH 1981, 71(7): 694-705.
3. Araújo TM, Aquino E, Menezes G, Oliveira OS, Aguiar L. Aspectos psicossociais do trabalho e distúrbios psíquicos entre trabalhadoras de enfermagem. Rev Saúde Pública 2003;37(4): 424-33.
5. Karasek R, Theorell T. Healthy work: stress, productivity, and the reconstruction of working life. New York: Basic Books Publishers; 1990.
6. Kristensen TG. Job stress and cardiovascular disease: a theoretic critical review. J Occup Health Psychol, 1996, 1(3): 246-260.
7. Alves MGM, Chor D, Faerstein E, Lopes CS, Werneck GL. Versão resumida da “job stress scale”: adaptação para o português. Rev Saúde Pública 2004; 38(2): 164-171.
8. Macedo LET, Chor D, Andreazzi V, Faerstein E, Werneck GL, Lopes C. Estresse no trabalho e interrupção de atividades habituais, por problemas de saúde, no estudo pró-saúde. Cad Saúde Pública 2007; 23(10): 2327-2336.
9. Dantas J, Mendes R, Araújo TM. Hipertensão arterial e fatores psicossociais no trabalho em uma reinaria de petróleo. Rev Bras Med Trab 2004, 2(1): 55-68.
10. Alves, MGM. Pressão no trabalho: estresse no trabalho e hipertensão arterial em mulheres do estudo pró-saúde [tese de doutorado]. Rio de Janeiro: Escola Nacional de Saúde Pública da FIOCRUZ; 2004.
11. Brito, AS. Estresse e acidentes no trabalho: estudo pró-saúde [tese de doutorado]. Rio de Janeiro: Instituto de Medicina Social da UERJ; 2007.
12. Streiner DL, Norman GR. Health Measurements Scales. 2nd ed. New York: Oxford University Press; 1998. p. 4-13.
13. Luiz RR, Costa AJL, Kale PL, Werneck GL. Assessment of agreement of a quantitative variable: a new graphical approach. J Clin Epidemiol 2003; 56:963-967.
14. Szklo M, Nieto FJ. Epidemiology: beyond the basics. 2nd ed. USA: Jones and Bartlett Publishers; 2007. p. 313-345.
15. Aguiar, OB. Aspectos Psicossociais do impedimento laboral por motives de saúde em trabalhadores de cozinhas industriais [tese de doutorado]. Rio de Janeiro: Instituto de Medicina Social da UERJ; 2009.
16. Bland JM, Altman DG. Statistical methods for assessing agreement between two methods of clinical measurement. Lancet 1986; 1(307):10
17. Shrout PE, Fleiss JL. Intraclass Correlations: Uses in assessing rater reliability. Psychological Bulletin 1979; 86(2): 420-428.
18. Cortina JM. What is coeficient alpha? An examination of theory and applications. J Appl Psychol 1993; 78 (1): 98-104.
19. Bland JM, Altman DG. Statistics notes: Cronbach’s alpha. BMJ 1997; 314:572.
20. Faerstein E, Chor D, Lopes CS, Werneck GL. Estudo pró-saúde: características gerais e aspectos metodológicos. Rev Bras Epidemiol 2005; 8(4): 454-66.
21. Josephson M, Lagerström M, Hagberg M, Hjelm EW. Musculoskeletal symptoms and job strain among nursing personnel: a study over a three year period. Occup Envirom Med 1997; 54: 681-685.
22. Araújo TM, Karasek R. Validity and reliability of the job content questionnaire in formal and informal jobs in Brazil. SJWEH suppl 2008; 6:52-59.
23. Sanne B, Torp S, Mykletum A, Dahl A. The Swedish demand-control-support questionnaire (DCSQ): factor structure, item analyses, and internal consistency in a large population. Scand J Public Health 2005; 33: 166-174.
24. Vilete LMP, Coutinho ESF, Figueira ILV. Coniabilidade da versão em Português do inventário de fobia social (SPIN) entre adolescentes estudantes do município do Rio de Janeiro. Cad Saude Pública 2004; 20(1): 89-99.