Online data mining services for dynamic spatial
databases I: system architecture and client
applications
II International Conference and Exhibition on Geographic Information, Estoril Congress Center, May 30- June 2, 2005
Manuel Costa, Inês Sousa, Alexandra Fonseca, Diana Henriques, Paulo Rosa, Ivan Franco, Nuno Capeta, Luís Teixeira, Jorge Cardoso and Vasco Carvalho
This paper describes online data mining services for dynamic spatial databases connected to environmental monitoring networks. These services can use Artificial Neural Networks as data mining techniques to find temporal relations in monitored parameters. The execution of the data mining algorithms is performed at the server side and a distributed processing scheme is used to overcome problems of scalability.
To support the discovery of temporal relations, two other families of online services are made available: vectorial and raster visualization services and a sonification service. The use of this system is illustrated by the DM Plus client application and the SNIRH Data Mining Web site. The sonification service is described and illustrated in the part II paper.
KEYWORDS
Online data mining services, artificial neural networks, dynamic spatial databases, Web Services, distributed processing, scalability, environmental monitoring networks.
INTRODUCTION
An increasing number of dynamic spatial databases linked to environmental monitoring networks are currently being developed as decision makers realize the benefit of using data analysis to support their decisions. In these networks, parameters are measured over time in each of its monitoring stations. In search for valuable information hidden in large volumes of collected data, values over time can be “mined” to find unexpected patterns and relationships in sets of data.
Artificial Neural Networks (ANNs) are often used in data mining as an alternative to traditional statistical methods due to [1][2 - Haykin]. There are numerous software packages that run ANNs and other data mining algorithms, though they do not support direct access to dynamic sources of data. Oracle® Data Mining is a commercially available middleware that facilitates this process in an Oracle® database system. However, it does not execute computational costly algorithms such as the ones associated with ANNs training and it only supports Oracle® platform and products.
This paper describes a scalable online service system that employs ANNs to find temporal relations in spatial dynamic databases connected to environmental monitoring networks. The use of this system is illustrated by the website SNIRH Data Mining and a client application, DM Plus. The research work presented herein was partially developed for the project Spatial Sound Data Mining (SDM).
ONLINE DATA MINING SERVICES System architecture
The online data mining services that were developed are based on a Service Oriented Architecture (SOA) with a set of functionalities to explore temporal relations in dynamic spatial databases. The services are provided as Web Services to simplify interoperability. All data mining services were developed in C# for the Microsoft® .NET framework.
In the service system, there are two main services: (a) meta information service that retrieves information from the database; (b) data mining service that submits tasks, provides information of the task execution state and downloads results. Depending on the final goal, the service system can
have several auxiliary services to produce maps or sound. The part II paper explains in detail the sonification service.
The system architecture is based on three layers (Figure 1): (a) Data Layer, providing access to heterogeneous geo-referenced data sources; (b) Logic Layer, supporting knowledge extraction based on data mining processes; (c) Presentation Layer, including a set of user friendly tools to explore relations in dynamic databases, based on visualization and sonification processes.
ANN Service
Meta-Information Service
Data Layer
Logic Layer
Presentation Layer
Se
rver
Cl
ient
Sond
Maps
Auxiliary services
Submission State Download
Figure 1 - Architecture of the online data mining services Customization targeting specific databases
Databases for automatic environmental monitoring networks are usually managed by different institutions and have specific needs. Their structure is unique, with particular processes of access and control. In addition, each monitoring network can have specific requirements in how the monitoring stations and measured parameters should be shown to clients. The online services system was developed by modules, being totally adaptable to the specific needs of each database.
In the service system, there are two modules: Data Server and a meta-information service. Data Server converts generic data mining requests into specific SQL queries. The meta-information service represents a Web Service describing the available monitoring stations and their parameters. The Web Service is customized to the specific needs of how the information should be provided.
Two versions of the online data mining services were implemented targeting, respectively, two dynamic databases: (1) air quality monitoring network (QualAr), managed by Instituto do Ambiente (IA); and (2) water quality monitoring network of the Sistema Nacional de Recursos Hídricos (SNIRH), owned by Instituto da Água (INAG).
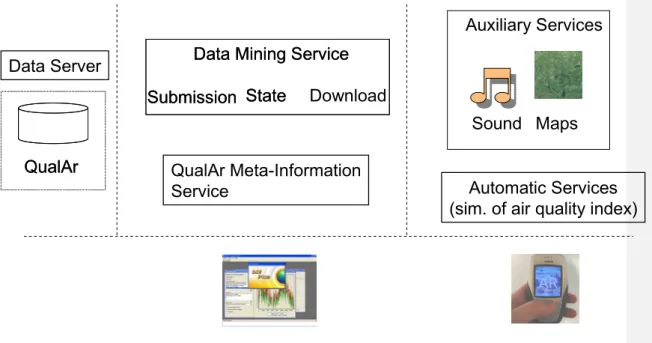
The online data mining services for the QualAr database have two client applications (Figure 2): DM Plus and the Automatic Forecast of the Air Quality Index (explained in the part II paper). There are two auxiliary services used by these client applications. A visualization service produces maps in a user-specified format and resolution, adaptable to the client screen capabilities and bandwidth. A sonification service produces sound from input data. This sonification service allows an air quality index to be represented acoustically instead of visually, providing a more effective presentation of data and information in devices with low graphical capabilities.
Jorge Cardoso 2/4/11 3:08 PM
QualAr Meta-Information
Service
Sound Maps
Auxiliary Services
Data Mining Service
Submission State
Data Mining Service
Submission State
Download
Automatic Services
(sim. of air quality index)
Data Server
QualAr
QualAr
Figure 2 - Online data mining services for QualAr database and applications for end-users The online data mining services for the SNIRH database will be made available to the public through the SNIRH Data Mining (Figure 3). This interface is an html front-end to the online services supported by a GIS system to help on the selection of the monitoring stations and measured parameters. DM Plus for the SNIRH database is another client application.
SNIRH Meta-Information
Service
Maps
Auxiliary Services
Data Mining Service
Submission State
Download
Data Mining Service
Submission State
Download
Data Server
SNIRH
SNIRH
Figure 3 - Online data mining services for the SNIRH database and applications for end-users
Jorge Cardoso 2/4/11 3:08 PM
Artificial Neural Networks (ANNs)
Artificial Neural Networks (ANNs) are a popular technique for data driven modeling [8]. ANNs are interconnected assemblies of simple processing logic units, nodes or neurons, connected in layers, each with an activation function that yields an output to an input flowing into the neuron. The knowledge is stored in inter-unit connection weights, generated by a learning process from a set of experimental training patterns [3].
The original contribution of ANNs modeling approach lies in the nonlinear multilayer nature of its underlying model structure [2]. In particular, the massively parallel-distributed structure and the ability to generalize from noisy or incomplete data are two information-processing capabilities inherent to neural networks that allow them to solve complex problems [1].
The growing availability of data and the limitations associated with numerical models are also fostering the use of ANNs [8].
ANNs have also limitations, though. The efficient scaling with dimensionality of a neural network due to the nonlinear functions of the adaptive parameters costs a number of additional complications associated with nonlinear optimization such as the presence of multiple minima in the error function. In feed-forward neural networks it is very easy for gradient algorithms to get stuck in local minima when learning the network weights. The optimization process will always need human interaction and knowledge of the underlying mathematics supporting the use of a number of techniques and heuristics to address this problem. Still, there is no universal fast and reliable training algorithm that will guarantee the convergence of a global minimum [5]. The complexity associated with the ANN training methods is a very significant limitation for the ordinary user, preventing the use of ANNs in the fields of Environmental and Civil Engineering.
Neural networks are often criticized as black boxes that are simply fed in with inputs and miraculously provide outputs without revealing causal paths. There are methods for deriving mathematical explanations of neural networks’ outputs, for example, based on the derivatives of the outputs with respect to the inputs that caused them [9]. Probabilistic and statistical characterization of a neural network also makes internal states of the neural network more accessible and understandable. Still, the weights learned by ANNs are often difficult for humans to interpret, for example, learned ANNs are less easily communicated to humans than learned rules. However, the goal of most engineers often is not creating a comprehensive and exhaustive causal model of the system. They simply want to rapidly and dynamically obtain the “suitable black box” defining a mathematical path between the inputs and the outputs, without compromising the necessary understanding of the system.
Steps of data mining using ANNs
Data mining processes typically include data preprocessing, data mining model construction, and model evaluation [1]. Data preprocessing involves: (a) data selection – identify target datasets and relevant fields; (b) data cleaning – remove noise and outliers, data transformation.
Data preprocessing
To select input and output parameters, the user should be aware of the geographical position of the targeted monitoring stations and how the parameters can influence each other. For example, to forecast the daily average water depth in a particular hydrometric station in some river three days ahead, the user must be aware if the measured flow is influenced by an upstream dam. If it is not, the prediction can be made, theoretically, with the previous water depth and the intermediate
precipitation values of a meteorological station in the upstream vicinity.
Data cleaning is also a very important task in the preparation of the data. In some situations, the presence of outliers can jeopardize the application of data mining techniques, such as the use of ANNs. However, if properly trained, ANNs can successfully deal with the presence of these values without an expressive impact on the results.
Variables should be scaled to the same ranges such that they are given equal importance. A standardization process is often carried out by scaling the variables to limits of the activation (or transfer) function, which usually ranges between 0 and 1. However, if the values are scaled to the extreme limits of the transfer function, the size of the weight updates is extremely small and flat-spots are likely to occur [4]. Scaling is, therefore, carried out for ranges between 0.1 and 0.9 or 0.2 and 0.8.
Model construction
The network architecture represents how the neurons connect to each other in the network. The shape of the connection associated with the activation functions defines the mathematical path between inputs and outputs.
The multilayer feed-forward network is a popular type of neural network architecture [3]. The network is arranged in layers of neurons: an input layer; one or more hidden layers, which extracts useful features from the input data; an output layer. Each neuron receives inputs from the preceding neurons, multiplied by the weight along which it flowed. The weighted inputs are summed and passed through the neuron’s activation function before being passed onto the next layer. ANNs with more than one hidden layer are used when variables show discontinuities, and are much harder to train than single layer ones [5].
There are several training algorithms for neural networks, each of which offers different advantages and limitations. The most commonly used is the back-propagation algorithm, a form of supervised learning which generally works well, is simple to understand, and can be easily implemented as a software simulation. In the back-propagation algorithm, all neurons change their weights based on the accumulated derivatives of the error with respect to each weight. These changes move the weights in the direction the error declines more quickly. Although back-propagation provides an interesting method for changing the weights, there are shortcomings associated with this approach [4], for example, the error can converge to a local minimum instead of the global minimum. A variety of techniques and heuristics to improve back-propagation can be found in the literature [3] [Haykin]. [7] proposed a formula to update the weights with a variable step size to take into account the changing curvature of the error surface.
The number of examples used before each correction to the network weights is known as epoch and represents an important variable. If the epoch is too small, the correction can be significantly influenced by the presence of outliers, eluding the direction of the true gradient.
The criteria to decide when to stop training is also of vital importance, as it will determine if a model is optimally or sub-optimally trained. The most used method is cross-validation requiring some examples from the data set to be used in an intermediate validation process. In practical terms, however, the success of this method is not straightforward raising some discussion about the balance between benefits and shortcomings [4]. The user will always have to confirm the results by further training the network.
Model evaluation (validation)
The validation process of the network model is a key step. The validation is carried out by leaving some data outside the training process and compare if the network has the same prediction capabilities with validation data as for the training. If it has a better capacity, there is a high probability that the network is over-fitting training data.
The ANN service uses the modified back-propagation algorithm described in [7] with the following parameters: Kappa = 0.1, Phi = 0.5, Theta = 0.7 and Mu = 0.9. It can only have one hidden layer and provides the control of three variables: number of neurons, number of iterations and rate of data to be used in training and validation. Both inputs and outputs are scaled to values ranging from 0.2 and 0.8.
The current version of the ANN service does not allow data cleaning. To mitigate the problems created by the presence of outliers, the size of the epochs is 200 examples. If the training set is smaller than this value, the epoch embraces the entire data set.
Cross-validation removes some data from the training universe and has some practical shortcomings, the expected stopping criteria used will be brute force. The user can submit several tasks at same time with different parameterizations and benefit from the parallelization of the training process at server side.
The weights of the network are randomly started within the range of -0.5 to 0.5. To escape from local minima problems, the user can employ brute force again by submitting several tasks at the same time.
3. IMPLEMENTATION OF THE ONLINE DATA MINING SERVICES Data Layer
The Data Layer is composed by a server, Data Server, which converts data mining queries into SQL, targeting a specified database (step 1.1 in Figure 4). Given that services were intended to be used in environmental monitoring networks, records are geo-referenced time series.
However, the volume of data to be transferred between the Data Server and the Task Executer can easily achieve values of 100 MB, creating scalability problems. To mitigate these problems, data is streamed out to the Task Executor as it is read from the database engine (step 1.2 in Figure 4). The Data Server uses sockets and data is transferred in a specific binary format to minimize the network overhead created by the Web Services.
Logic Layer
The Data Server always sends data to the Task Executor as raw data (step 1.2 in Figure 4). The Task Executor saves the raw data and only starts preprocessing it once all data is received (step 3 in Figure 4). Task execution, for model building using the data mining service, starts when data preprocessing ends (step 3 in Figure 4).
Jorge Cardoso 2/4/11 3:08 PM
Data Server
Data mining task executer
Ra
w
Data
(GeoX,GeoY)
1-ADa
ta
Prep
ara
tion
1.1
1.2
Data streaming
Start in = 1/1/2003 ... End in = 31/1/2003 Station 1, Parameter A; Station 2 Parameter BData mining query
SQL
Builder
(GeoX,GeoY)
1-B= f(
)
ANN
T
ran
in
g
2
3
Figure 4 - Steps for the execution of a data mining task
Available data transformation processes
Data mining queries include parameters, such as starting date and time range (e.g. 1 hour, 1 day), and a list of parameters per station. For each parameter, several aggregation options (e.g. the median) can be selected. If at least one of the parameters has no data for a time range, the trial data record is removed. Specific dates, instead of time ranges, can also be defined to be included in the data records.
Available data mining modules
1 - Data Stats Module This module has two goals:
Deploy data transformation functionalities and afterwards download the transformed data. For example, the automatic monitoring network of water quality parameters stores the measured parameters in an hour scale. However, the user might want the daily average and median for a specified set of parameters.
Analysis of the parameters to be used in the ANN Module. The user will be able to inspect how many records can be used in the neural network training for the selected temporal aggregation. The user will also be able to explore if there are correlations between the parameters to be used for modeling.
2 - Artificial Neural Network (ANN) Module
The ANNs represent a very powerful mathematical approach to establish relations between inputs and outputs. As it was previously mentioned, the training algorithms must be fed with several parameters, too complex to handle for the ordinary user. Therefore, to simplify their use by experts with no profound knowledge in training algorithms, the ANN Module provides a minimum number of parameters controllable by the user. In addition, the neural network can only have one hidden layer.
Scalable task execution
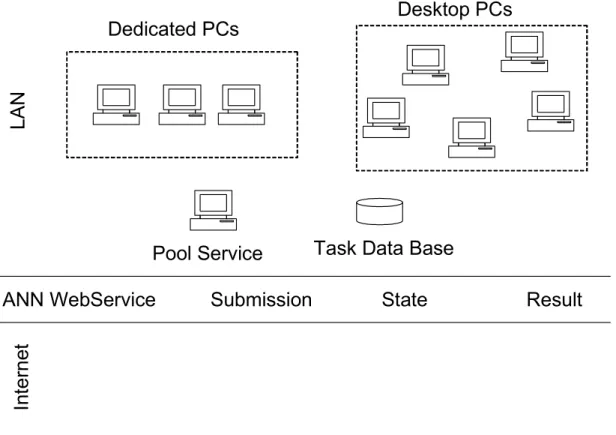
The execution of a data mining algorithm such as a neural network can be intensive. If the algorithms are processed at the server side, a distributed scheme must be used to handle the computational effort required.
In the current implemented version, data mining tasks can be executed in a mix environment of dedicated computers and desktop PCs running as background jobs with low priority (Figure 5), following the architecture based on grid computing proposed [6]. The data mining service has three types of main functionalities routed to the task pool service: task submission, execution state information and task result download. This Web Service manages tasks and uses the task database to save task queries and associated results. All the software developed for the scalable task execution was written in C# for the Microsoft® .NET Framework.
In
ter
ne
t
LAN
ANN WebService
Dedicated PCs
Desktop PCs
Pool Service
Submission
State
Result
Task Data Base
Figure 5 - Scalable architecture for the distributed execution of data mining tasks PRESENTATION LAYER
SNIRH Data Mining
SNIRH includes several automatic monitoring networks (water quality, hydrometric, meteorological and reservoirs) and non-automatic monitoring networks (like, for example, water treatment plants or subsurface water quality). All data is available to the public in a Web site (http://snirh.inag.pt).
Jorge Cardoso 2/4/11 3:08 PM
SNIRH Data Mining is a Web site for end-users of the online data mining services targeting the SNIRH database. To access the data mining functionalities, the user must have an account. After the login, the user has four steps ahead before submitting a task.
The first step is to select the stations (Figure 6 a)). To do so, the Web site provides a GIS with several auxiliary layers, such as the river networks or the reservoirs. The user has also the possibility to browse the geographic data through the provided zooming and panning functionalities. The selected stations are painted on the map with a size larger than the ones available for selection. Each station is painted with a specific color associated with a network to simplify the discrimination of the monitoring stations.
The second step is to select parameters measured in each station (Figure 6 b)). This is done by checking the desired parameters.
Figure 6 - Selection of the monitoring stations a) and measured parameters b)
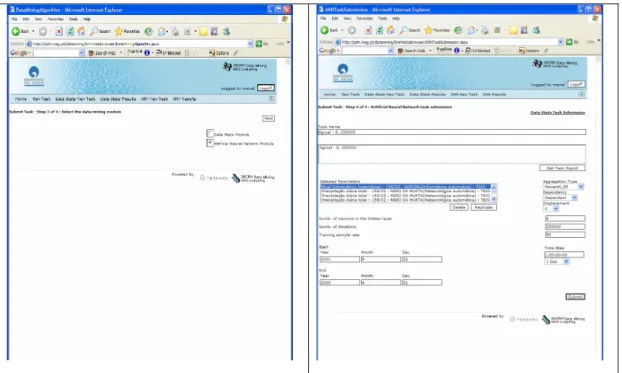
The third step is to select the data mining algorithm (Figure 7 a)). The Web site provides the functionalities included in both the Data Stats module and the ANN module. The example described below uses the ANN module.
After selecting the ANN module, the user jumps to the fourth and final step: specify the parameters of the task submission (Figure 7 b)). For example, suppose that the user selected the water depth measured in some station at the scale time of 15 minutes and the daily precipitation in a meteorological station located upstream. To predict the daily percentile 95 of the water depth profile 3 days ahead based on the previous value and the intermediate precipitation, the user has to create new variables with temporal displacements. To do so, he or she has to select the hydrometric parameter and press “replicate”, and do the same three times for the precipitation parameter. After that, the aggregation type for both water depth parameters (original and replicated) should be changed to percentile 95. In one of the two, the dependency should be set to “Dependent” and the displacement set to 0. The other dependency must be set to “Independent” and the displacement to -3. For the precipitation, the displacement should be, respectively, set to the values ranging from -3 to 0, and the dependency to “Independent”. The aggregation for these variables is not important, since they are already stored in a daily time scale. Finally, the user has to change the time range (or time step) to 1 day, choose the number of neurons in the hidden layer and the number of iterations, and give a user-friendly name to the task.
Jorge Cardoso 2/4/11 3:08 PM Deleted: Figure 6 Jorge Cardoso 2/4/11 3:08 PM Deleted: Figure 6 Jorge Cardoso 2/4/11 3:08 PM Deleted: Figure 7 Jorge Cardoso 2/4/11 3:08 PM Deleted: Figure 7
Figure 7 – a) Selection of the data mining algorithm; b) Parameterization of the associated task After submitting the task, the user can check its state, which can be “downloading data from the database”, “processing” with the associated percentage of the executed iterations, or “Executed” (Figure 8 a)). The execution of the algorithm is carried out by a desktop computer of INAG. To avoid conflicts with the desktop user, the data mining task is executed with low priority.
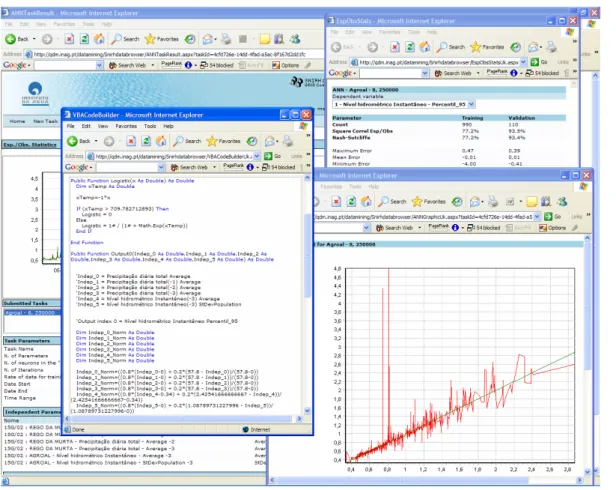
In the results page, a graphic with the variation over time of the expected/observed values is shown, when the execution is done (Figure 8 b)). In this page, the user can also select the task to retrieve further information.
Figure 8 – a) ANN task execution evaluation; b) Expected and observed values over time The results page has four links to auxiliary information/tools of the results (Figure 9). The first one gives information of the correlation between expected/observed values. The second link produces
Jorge Cardoso 2/4/11 3:08 PM Deleted: Figure 8 Jorge Cardoso 2/4/11 3:08 PM Deleted: Figure 8 Jorge Cardoso 2/4/11 3:08 PM Deleted: Figure 9
the trained network in Microsoft® Visual Basic® For Application, which allows using the network function in Microsoft® Excel. The third link gives the possibility to build graphics based on used data and values predicted by the neural network. Finally, the last link provides the data used for training and validation in ASCII files compacted in a zip file.
Figure 9 - Auxiliary functionalities to analyze the task results YDreams DM Plus, an application to browse relations in dynamic spatial databases
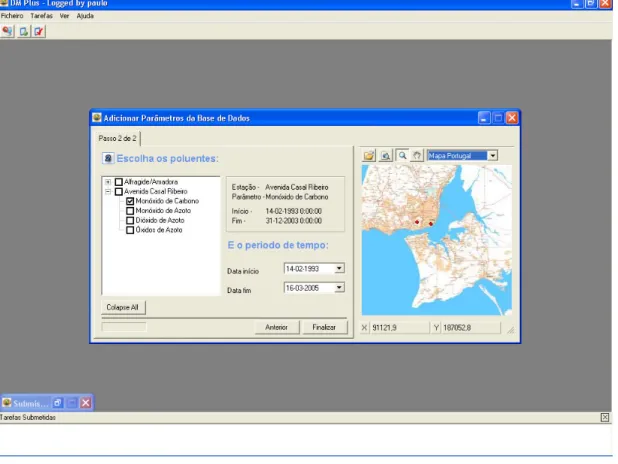
DM Plus is a client application to browse relations between parameters by taking advantage of all functionalities provided by the online data mining and auxiliary map services. There are two map services, one for raster imagery (e.g. orthophotomaps), and another for vectorial information (e.g. rivers).Two versions of DM Plus were implemented, targeting two dynamic databases: QualAr and SNIRH.
As opposed to the SNIRH Data Mining, which represents a specific website, the base application is always the same with the exception of two graphical components that should be customized. Thereby, the front-end for the selection of the stations is specifically implemented for each targeting database: DM Plus QualAr (Figure 10 ) and DM Plus SNIRH (Figure 12). The front-end for the visualization of the results is the second graphical component to customize. Figure 13 shows the results form in the DM Plus SNIRH.
DM Plus gives also the possibility to submit user data to the server to be used in the data mining tasks, a functionality of the data mining online services. Given that QualAr database has no meteorological parameters, this functionality is crucial to produce results like the ones present in [part II] for the prediction of an air quality index.
Jorge Cardoso 2/4/11 3:08 PM Deleted: Figure 10 Jorge Cardoso 2/4/11 3:08 PM Deleted: Figure 12 Jorge Cardoso 2/4/11 3:08 PM Deleted: Figure 13
Figure 12 - DMPlus SNIRH: monitoring stations and the selection of a measured parameter
Figure 13 - DMPlus SNIRH: task execution evaluation CONCLUSIONS AND FUTURE WORK
The online data mining services, through customized implementations, showed to be quite useful in browsing data and exploring relations in dynamic spatial databases associated with environmental monitoring networks. The proposed underlying system allows executing data mining algorithms with the most recent data retrieved directly from spatial databases, and in a computationally efficient manner based on distributed processing schemes. Auxiliary online services, in particular visualization (map) services, improve system effectiveness in supporting data analysis.
As future work, the authors plan to extend the online data mining services to multiple data warehouses. The online service system will then manage data streaming between data warehouses and data mining execution house.
AKNOWLEDGEMENTS REFERENCES
1. Han, J. and Kamber, M. Data Mining – Concepts and Techniques. San Francisco, CA: Morgan Kaufmann, 2001.
2. Hand, D., Mannila, H., & Smyth, P.. Principles of Data Mining, Cambridge, MA: The MIT Press, 2001.
College Publishing Co, 1999.
4. Maier, H.R and Dandy G.C. “Neural Networks for the prediction and forecasting of water resources variable: a review of modeling issues and applications”. Environmental Modelling & Software, 15, 101-124, Elsevier, 2000.
5. Masters, T. Practical Neural Network Recipes in c++. Academic Press, 1993.
6. Sarmenta L., Chua S., Echevarria, P., Mendonza, J., Santos R. R. and Tan S.. “Bayanihan Computing .NET: Grid Computing with XML Web Services” in the Workshop on Global and Peer-to-Peer Computing at the 2nd IEEE International Symposium on Cluster Computing and the Grid (CCGrid ’02), Berlin, Germany, May 2002
7. Smith, M. .Neural Networks for Statistical Modelling. Van Nostrand Reinhold, New York, N.Y., 1993.
8. Solomatine, D. P. “Data-driven modeling: paradigm, methods, experiences”. In Proceedings 5th International Conference on Hydroinformatics, Cardiff, UK, July 2002, pp.757-763, 2002. 9. Swingler, K.. Applying Neural Networks – A Practical Guide. Morgan Kaufman Publishers,
1996. AUTHORS INFORMATION Manuel COSTA manuel.costa@ydreams.com YDreams, www.ydreams.com Inês SOUSA ines.sousa@ydreams.com YDreams, www.ydreams.com Alexandra FONSECA afonseca@igeo.pt
Instituto Geográfico Português Diana HENRIQUES
dianafranco@netcabo.pt
Grupo de Análise de Sistemas Ambientais, DCEA-FCT-UNL
Paulo ROSA
par@sapo.pt
Grupo de Análise de Sistemas Ambientais, DCEA-FCT-UNL Ivan FRANCO Ivan.franco@ydreams.com YDreams, www.ydreams.com Nuno CAPETA Nuno.capeta@ydreams.com YDreams, www.ydreams.com Luís TEIXEIRA lmt@porto.ucp.pt
Universidade Católica do Porto
Jorge CARDOSO
jccardoso@porto.ucp.pt
Universidade Católica do Porto Vasco CARVALHO
jvcarvalho@porto.ucp.pt

