To cite this article: J M Pereira et al 2019 J. Phys.: Conf. Ser. 1379 012034
View the article online for updates and enhancements.
A dual measurement and stimulating system to monitor and
promote NNS
J M Pereira1,2, V Viegas1,3, O Postolache1,4 and P S Girão1,5 1 Instituto de Telecomunicações, Lisboa, Portugal
2 ESTSetúbal, Instituto Politécnico de Setúbal, Setúbal, Portugal
3 Centro de Investigação Naval (CINAV), Escola Naval, Base Naval de Lisboa – Alfeite, Almada, Portugal
4 ISCTE – Instituto Universitário de Lisboa, Lisboa, Portugal
5 Instituto Superior Técnico, Universidade de Lisboa, Lisboa, Portugal
Email: dias.pereira@estsetubal.ips.pt
Abstract. The present paper presents a dual system that can be used to measure and to generate non-nutritive sucking (NNS) signals. The NNS measurement is based on a pressure sensor that is pneumatically connected to a silicone pacifier. By its turn, the NNS stimulator is based on a miniature pump and a miniature electro-valve that are operated by opposite phased signals to produce the pulsed pressure signal that is pneumatically applied to the silicone pacifier. The paper highlights some specific issues related with the calibration of the pneumatic signal measuring chain. Processing and wireless transmission capabilities are provided by a low-cost solution based on a microcontroller. Calibration and experimental results are also included in the paper.
1. Introduction
Measurement of non-nutritive sucking signals in neonatology services, namely in neonatal intensive care units (NICU), is a very important topic. This topic has a strong clinical appeal and a different NNS related subjects had been studied in the last 20 years highlighting the relationship between NNS behavior and baby's physiological variables. The effectiveness of NICU affects directly the improving of the survival rate of premature babies. However, it is important to refer that NICU fixed and variable costs are extremely high [1]. As a reference of the direct costs in NICU, it can be cited an annual cost over 4 billion USD in the United States for low-birth-weight infants through their first year of life [2]. This paper proposes a low-cost and dual measurement and stimulating system that can be used to measure non-nutritive sucking signals of premature babies and to stimulate an autonomous nutritive sucking capability.
Considering the importance of this topic, this paper presents a low-cost and safe solution that can be used to measure and to generate very low amplitude pressure signals that are required to analyze and to stimulate, nutritive and non-nutritive sucking activities, respectively. It is important to underline that one of the main challenges associated with the development of the prototype that is presented in this paper is associated with the very low pressure measuring and generating amplitude ranges of the NNS pressure signals with the required accuracy. The paper also focusses some issues related with calibration [3-7] that is an essential concern whenever low amplitude measurements are at stage. It is
2
stimulate NNS signals. Moreover, these commercial solutions are as usual closed solutions in terms of hardware and software.
2. Measurement system
The block diagram of the dual measurement and stimulating NNS system is represented in figure 1. The system includes a common silicone pacifier that is connected through two pneumatic tubes to the input of the sucking pressure measurement (SPM) unit and to the output of the sucking pressure stimulator (SPS) unit. The microcontroller-based unit [10] includes 8 A/D conversion channels, 22 digital I/O ports, 6 of which are PWM, and a Flash Memory of 32 KB, of which 2 KB are used by the boot loader. Wireless transmission capabilities are easily supported by connecting the Arduino unit to a Bluetooth Module HC-05 [11].
Figure 1. Measurement system block diagram.
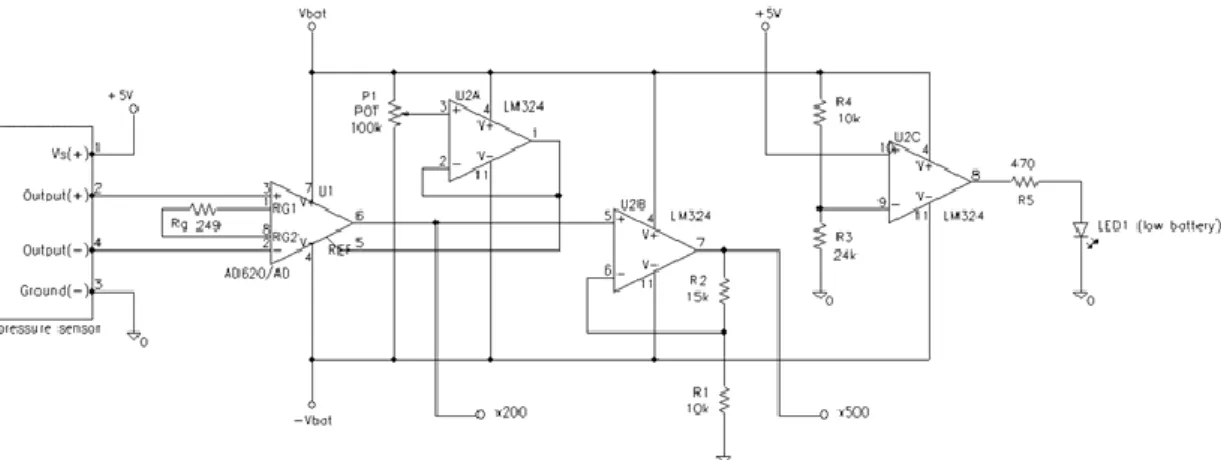
The SPM unit performs the signal conditioning of the electrical signal delivered by the pneumatic pressure sensor and the SPS unit generates the sucking signal patterns that are applied to the silicone pacifier. Figures 2 and 3 represent the schematic diagram of the SPM and SPS units, respectively. The circuits include several COTS devices, the pneumatic pressure sensor [12], a low-cost miniature pneumatic pump [13] and a miniature electro-valve [14] similar to the ones that are used in commercial blood pressure measurement devices [15]. Regarding the main specifications of the sensors and actuators, it is important to refer that the pneumatic pump delivers a maximum output pressure equal to 15 p.s.i. and the electro-valve has a maximum flow rate amplitude equal to 1.2 l/min. The pressure transducer has a relative pressure measuring range equal to 15 p.s.i., a linearity error lower than 0.25 % of its span and a repeatability plus hysteresis error lower than 0.2 mV for a nominal supply voltage of 10 V.
Figure 2. Schematic diagram of the SPM unit. SUCKING PRESSURE MEASUREMENT SUCKING PRESSURE STIMULATOR A R D U I N O SILICONE PACIFIER
Figure 3. Schematic diagram of the SPS unit.
The software that runs in the Arduino device performs several simple tasks related with HW and SW configurations, data processing and packing, data transmission and some self-test functions to monitor the proper working conditions of the system. More complex functions that require higher data processing capabilities are performed remotely in a Smartphone or Laptop of the NICU supervision center that can communicate, by its turn, with several NNS measurement and stimulating units.
3. System calibration
The required accuracy of the measurement system implies the calibration of the pneumatic pressure sensor measurement chain. Figure 4 depicts the devices that were used for calibration purposes that include a pneumatic pump [16], an inclined U-tube manometer [17], a pressure indicator and pressure loop calibrator [18], and the pressure sensor unit under calibration.
Figure 4. Calibration apparatus set-up.
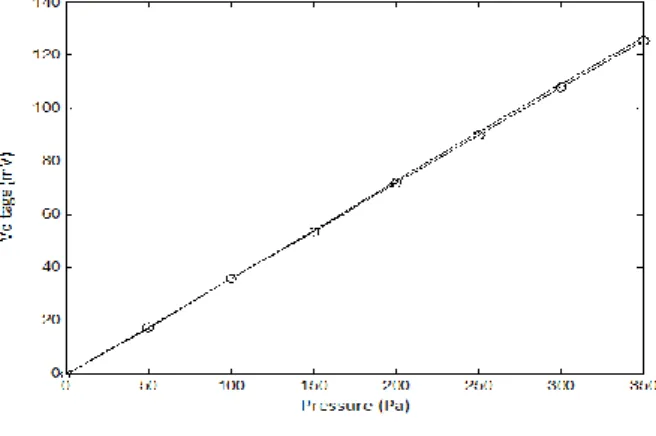
Figure 5 represents the calibration results that were obtained after three calibration cycles. Using a linear curve fitting of the full set of the calibration points, the linear relationship between pressure and voltage values is given by:
V0=0.368∙p+8.6 (1)
where V0 represents the output voltage of the conditioning circuit in mV, p represents the input pressure in Pa, and the constant, 8.61 mV, is an offset deviation caused by the non-linearity error of the sensor plus conditioning circuit. The linearity of the measuring chain is experimentally confirmed, and the correlation coefficient is almost equal to one (cc=0.99996).
4
represents the input pressure in Pa. From the previous relationships, it is possible to confirm that the hysteresis of the input pneumatic measuring chain is lower that 0.91 % of the measuring range span.
Figure 5. Calibration results.
It is important to underline that the expected uncertainty of the instrument after calibration is mainly related with the uncertainty of the pressure measurements since the voltage measurements obtained from a 5 1/2 digit multimeter [19] is about 0.13 mV in the selected DC voltage measurement range. The error that is associated with the pressure measurements is 0.1 % of the FS (200 mbar) that corresponds to 20 Pa. Using the calibration curve relationship, it is possible to obtain an overall voltage measurement accuracy better than 7.5 mV, and an accuracy better than 25 Pa in terms of pressure measurements. This accuracy level is acceptable for the instrument purposes since the main pressure parameter related with NSS measurements is the maximum pressure amplitude that is typically higher than 500 Pa, which means that a maximum relative error lower than 5 % is achieved.
4. Experimental results
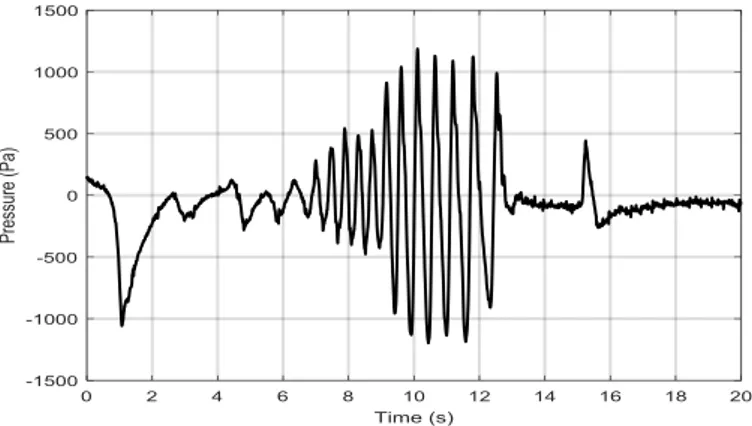
A low-cost data acquisition board (NI USB-6008) and a simple LabVIEW routine was developed to obtain some tests of the proposed NNS dual measurement and stimulating system. Figure 6 represents NNS measurement results when the proposed system was tested with a preterm infant. In this case, it was acquired a NNS signal with a burst duration almost equal to 7 s, the suction frequency is approximately equal to 1,3 Hz and the maximum pressure suction amplitude (PSA) in equal to 1200 Pa.
Concerning stimulating NNS signal stimulation, figure 7 represents the experimental results that were obtained with a data acquisition rate of 1 kS/s for a stimulating sucking pattern with a frequency of 4.8 Hz, 12 pulses per sucking burst and an inter-burst interval equal to 1 s. The signal with a square waveform profile corresponds to the pneumatic pump control signal and the signal with a ramp waveform profile corresponds to the associated pressure sensing signal.
Figure 6. Measurement of a NNS burst (fsuction=1,3 Hz; burstduration=7 s; PSApk=1200 Pa).
Figure 7. NNS signal stimulation (fsuction=4,8 Hz).
By its turn, figure 8 represents the experimental results that were obtained in similar testing conditions but for a stimulating sucking pattern with a frequency of 1,7 Hz. As it is clearly visible, the output conditioning signal amplitude of the pressure signal, in this case, is much higher than the one that was previously obtained, since the transfer function associated with these signals has a low-pass filter first order behavior, being the time constant dependent on the pneumatic characteristics of the pacifier, pneumatic tubes and, obviously, air compressibility.
6
Besides its low-cost, the system exhibits a high flexibility in terms of configuration and operation. Concerning flexibility, it is important to underline that the proposed system can generate sucking patterns with different parameters, such as, amplitude, frequency, number of pulses, sucking burst per minute, and duty rate between stimulating and measuring periods, being possible to perform an on-line adjustment of any of these parameters according to the premature infant evolution.
Acknowledgements
The work was supported by Fundação para a Ciência e Tecnologia, Project TAILORPHY - PTDC/DTP-DES/6776/2014, and Instituto de Telecomunicações.
References
[1] Kornhauser M and Schneiderman R 2010 How plans can improve outcomes and cut costs for preterm infant care Managed Care Review
[2] Narang A, Kiran P S and Kumar P 2005 Cost of neonatal intensive care in a tertiary care center Indian Pediatric 42 10 989-97
[3] Frank R 2013 Understanding Smart Sensors (Boston/London: Artech House)
[4] Ponmozhi J, Frias C, Marques T and Frazão O 2012 Smart sensors/actuators for biomedical applications: review Measurement 45 7 1675-88
[5] Pertijs M, Aita A, Makinwa K and Huijsing J H 2010 Low-cost calibration techniques for smart temperature sensors IEEE Sens. J. 10 61098-105
[6] Meijer G, Pertijs M and Makinwa K 2014 Smart Sensor Systems: Emerging Technologies and Applications (John Wiley & Sons)
[7] Pereira J M, Postolache O and Girão P S 2005 Adaptive self-calibration algorithm for smart sensors linearization Proc. 22th IEEE Instrumentation and Measurement Tech. Conf. (Ottawa) vol 1 pp 648-652
[8] NTrainer New device helps premature babies get off feeding tubes better http://www.science20.com
[9] Site of Care Systems, Neonatal healthcare software http://www.siteofcare.com/products/nursery [10] Store.arduino.cc, Arduino Nano https://store.arduino.cc/arduino-nano
[11] Electrofun Módulo Bluetooth HC-05 Para Arduino
https://www.electrofun.pt/comunicacao/modulo-bluetooth-arduino-hc05 [12] Honeywell Temperature compensated pressure sensor (Ref. 40PC001B)
http://www.sensortechnics.com
[13] Shenzhen aliElectric Technology Co., Ltd, KPM14A mini monitor with solder point https://ru.aliexpress.com/item/32234902089.html
[14] Xiamen AJK Technology Co., Ltd, Pressure relief mini solenoid valve AJK-F051 https://www.ajkpump.com/pressure-relief-mini-solenoid-air-valve_p49.html [15] Hartmann Tensoval Blood pressure monitor for reliable upper arm measurement
https://hartmann.info/en-za/products/diagnostics/blood-pressure-monitors/upper-arm-products/tensoval%C2%AE-comfort-classic
[16] AMETEK Portable pneumatic tester – model T730
http://www.testequipmentdepot.com/ametek/pressurepumps/t730.htm [17] Airflow Developments Type 504 manometer
https://www.bsria.co.uk/instrument/sales/product/airflow-developments-type-504-manometer
[18] GE Sensing, GE Druck DPI 800/802 Pressure indicator and loop calibrator
https://www.instrumart.com/products/18294/ge-druck-dpi-800-802-pressure-indicator-and-loop-calibrator
[19] Keithley 2110-220 - Bench digital multimeter 2110 series 1 kV 10 A 5.5 digit