GiESCO Mendoza 2017 - 16
USING AN UNMANNED GROUND VEHICLE TO SCOUT VINEYARDS
FOR NON-INTRUSIVE ESTIMATION OF CANOPY FEATURES AND
GRAPE YIELD
UTILISATION D'UN ROBOT TERRESTRE POUR ESTIMER LES CARACTERISTIQUES DE LA CANOPEE ET LE RENDEMENT AU VIGNOBLE
LOPES, Carlos M.1*; TORRES, Albert2; GUZMÁN, Robert3; GRAÇA, João1; REYES, Miguel2; VITORINO, Gonçalo1; BRAGA, Ricardo1; MONTEIRO, Ana1; BARRIGUINHA, André4
1LEAF, Instituto Superior de Agronomia, Universidade de Lisboa, Lisboa, Portugal.
2Ateknea Solutions, Barcelona, Spain.3. Robotnik Automation S.L.L, Valencia, Spain.4. Agri-Ciência, Consultores de Engenharia
Lda, Lisboa, Portugal. *Corresponding author: carlosmlopes@isa.ulisboa.pt
Abstract
This paper aims to present some results of the EU VINBOT (Autonomous cloud-computing vineyard robot to optimize yield management and wine quality) project focused on vineyard yield estimation. A ground truth evaluation trial was set up in an experimental vineyard with two plots of the white varieties ‘Alvarinho’ and ‘Arinto’, trained on a vertical shoot positioning system and spur pruned. For each varietal plot, six smart points were selected with 10 contiguous vines each. During the ripening period of the 2016 season the vines were manually assessed for canopy dimensions and yield and then scanned by the VINBOT sensor head composed with a 2D laser rangefinder, a Kinect v2 camera and a set of robot navigation sensors. Ground truth data was used to compare with the canopy data estimated by the rangefinder and with the output of the image analysis algorithms. Regarding canopy features (height, volume and exposed leaf area), in general an acceptable fit between actual and estimated values was observed with canopy height showing the best agreement. The regression analysis between actual and estimated values of canopy features showed a significant linear relationship for all the features however the lower values of the R2 indicate a weak relationship. Regarding the
yield, despite the significant R2 (0.31) showed by the regression analysis between actual and estimated values,
the equation of the fitted line indicate that the VINBOT algorithms underestimated the yield by an additive factor. Our results showed that canopy features can be estimated by the VINBOT platform with an acceptable accuracy. However, the underestimation of actual yield, caused mainly by bunch occlusion, deserves further research to improve the algorithms accuracy.
Keywords: grapevine, image analysis, precision viticulture, robot, rangefinder, yield estimation. Résumé
Cet article a pour but de présenter quelques résultats d´un projet de recherche Européen - VINBOT (“Autonomous cloud-computing vineyard robot to optimize yield management and wine quality”) qui a pour objectif principal l'estimation du rendement du vignoble. Un essai de validation a été mis en place dans un vignoble expérimental avec deux parcelles de variétés blanches ‘Alvarinho’ et ‘Arinto’, conduites sur un plan relevé (espalier) et taillé en cordon Royat unilatéral. Pour chaque parcelle variétale, six groups de 10 ceps chacune ont été sélectionnés. Au cours de la période de maturation de la saison 2016, les ceps ont été évalués manuellement pour les dimensions de la canopée et pour les composants du rendement, puis scannées par la tête du capteur VINBOT composée d'un télémètre laser 2D, d'une caméra Kinect v2 et d'un ensemble de capteurs de navigation pour le robot. Les données obtenues au champ ont été utilisées pour comparer avec les données des dimensions de la canopée estimées par le télémètre et avec les estimations du rendement obtenues par des algorithmes d'analyse d'image. En ce qui concerne les caractéristiques de la canopée (hauteur, volume et surface exposée du feuillage), en général, un ajustement acceptable entre les valeurs réelles et estimées a été observé avec la hauteur de la canopée montrant le meilleur accord. L'analyse de régression entre les valeurs réelles et estimées des caractéristiques de la canopée a montré une relation linéaire significative pour toutes les caractéristiques cependant les faibles valeurs du R2 indiquent une faible relation. En ce qui concerne le
rendement, malgré le R2 (0.31) significatif montré par l'analyse de régression entre les valeurs réelles et
GiESCO Mendoza 2017 - 17
un facteur additif. Nos résultats montrent que les caractéristiques de la canopée peuvent être estimées par la plate-forme VINBOT avec une précision acceptable. Cependant, la sous-estimation du rendement réel, causée principalement par l'occlusion des grappes, mérite des recherches supplémentaires pour améliorer la précision des algorithmes.
Mots clés: vigne, analyse d'image, viticulture de précision, robot, télémètre, estimation du rendement. Introduction
According to the EU Strategic Research Agenda For Robotics in Europe 2014-2020, robotics technology will become dominant in the coming decade in all domains, being Agriculture considered a domain where there is already strong early market development and considerable future potential (euRobotics aisbl, 2013). Among agricultural sectors Viticulture is one where aerial and ground robots can provide several services allowing numerous advantages. Regarding the ground robots, there are already some cultural practices that have been successfully automated (e.g. mechanical weeding; Vitirover, 2017) while others are currently under development (e.g. pruning; Visionrobotics, 2017).
Besides the execution of cultural practices and transport, robots can also be used as autonomous platforms to carry different types of sensors for crop monitoring and phenotyping allowing an increase of data gathering, improving traceability and farm statistics and, ultimately, the farming decision making (euRobotics aisbl, 2013). Recently the use of these autonomous platforms have deserved a strong attention with several research projects being developed aiming to obtain devices able to produce high throughput plant phenotyping (e.g. canopy temperature, vigor and yield maps, grape composition maps, etc). An example of this research effort is the recent (2014-2016) EU research project VINBOT (Autonomous cloud-computing vineyard robot to optimise yield management and wine quality: http://www.vinbot.eu/) which aimed at developing an all-terrain autonomous mobile robot with a set of sensors capable of capturing and analyzing vineyard images and 3D data by means of cloud computing applications, in order to obtain canopy and yield maps representing the spatial variability of the vineyard plots.
Vineyard vigour and yield can display temporal, regional and local variability. Quantification of this variability can bring several advantages for the entire production chain. For example, an accurate yield estimation can have the following benefits: help to decide about bunch thinning needs, to organize the harvest, to plan cellar needs and purchases or grape sales, to establish grape prices and to manage wine stocks, to manage grape and wine market; to program investments and develop marketing strategies, etc.
There are several methods for vineyard yield estimation being the methods based on the estimation of yield components the most commonly used in commercial vineyards (Clingellefer et al., 2001). For example, one of these methods needs manual bunch samples combined with historical data of bunch weight at harvest, practice that, besides being destructive, is very labor intensive and could provide inaccurate results as it is extrapolated for the entire vineyard based only on the assessment of a small percentage of the bunches.
Recently, several attempts have been made to apply image analysis technologies for bunch and/or berries recognition in images and processing methods for grape yield estimation (e.g. Dun and Martin, 2004; Diago et al., 2012, 2015; Liu et al., 2013; Nuske et al., 2014; Herrero-Huerta et al., 2015; Ivorra et al., 2015). These technologies, when combined with an autonomous ground platform, as is the case of the VINBOT, can provide an automated vineyard yield estimation.
This paper aims to present some validation results obtained in the frame of the EU VINBOT research project where data collected in a ground truth evaluation trial was compared with the estimations provided by the automated VINBOT system.
Material and methods Ground truth vineyard plots
For ground truth an experimental vineyard of the “Instituto Superior de Agronomia”, located in Lisbon (lat. 38.71 N; long. 9.18 W) and planted in 2006 with a North-South oriented rows was used. The grapevines of the white varieties ´Alvarinho’ and ‘Arinto’ were grafted to 1103 Paulsen rootstock and spaced 1.0 m within and 2.5 m between rows. Vines were trained on a vertical shoot positioning with two pairs of movable wires,
spur-GiESCO Mendoza 2017 - 18
pruned on a unilateral Royat Cordon system and trimmed at about 20 cm above the upper wires. For each varietal plot, six smart points (short row segments with 10 contiguous vines each) were established. At the end of the ripening period of the 2016 growing season the vines were manually assessed for canopy dimensions (height and width) and yield (bunch number and weight) and then scanned by the VINBOT sensor head. Data output by the rangefinder and the image analysis algorithms was used to compare with the ground truth data.
Vinbot platform
The VINBOT robot platform is based on a commercial off-the-shelf mobile robot Summit XL HL, that is able to carry up to 65 kg payload and consists of (Fig. 1):
-A robotic platform: durable, mobile, with ROS Indigo and Ubuntu 14.04; -RGBD Kinect v2 camera to take images of the vine;
-2D range finders to navigate the field and to obtain the shape of the canopies;
-A small computer for basic computational functions, connected to a communication module; -An optional RTK-DGPS high accuracy rover, optional base and associated communication devices; -A cloud-based web application to process images and create 3D maps;
-User friendly HMI to define navigation and data acquisition missions.
VINBOT robot proposes a novel hybrid reactive/waypoint based navigation architecture, tested successfully in vineyard navigation. Two navigation solutions can be used: i) reactive navigation using a laser range finder and RGBD device to perform reactive row following and obstacle avoidance and ii) traditional RTK-DGPS where the robot follows a set of pre-programmed waypoints.
Regarding machine vision procedures, the approach “Convolutional Neural Networks inside of Deep Learning Field”, based on a structure of stacked multi-layer neural networks (Krizhevsky and Sutskever, 2012), was used for image segmentation and grape recognition. Once the bunches were recognized, the total area occupied by the bunches in the image was computed in pixels, converted into actual cm2 and then converted into
kilograms of grapes, using empirical relationships between bunch projected area and weight obtained per variety.
Data analysis
The algorithms developed in the VINBOT were used to compute the data. Canopy features data were obtained from the rangefinder output. The bunch projected area extracted by the image analysis algorithms was computed in pixels and then corrected for hidden bunches by the vegetation using empirical relationships obtained in the frame of the VINBOT project (data not shown). The estimated total projected area of bunches was then converted into kg of grapes using empirical relationships obtained previously for each variety. Data estimated by the VINBOT algorithms was compared to ground truth data using the following deviance measures (Schaeffer, 1980): mean absolute error (MAE); percent mean absolute error (MA%E) and root mean square error (RMSE). The linear regression analysis of observed vs. predicted was also applied using the actual data as Y-variate (Mayer and Butler, 1993).
Results and discussion Canopy features
The comparison between actual and estimated canopy features is presented in the plots of Figure 2. Regarding
canopy height, visual observation suggests a satisfactory agreement between observed and estimated values
with ‘Alvarinho’ showing a better agreement than ‘Arinto’ (Fig. 2 A, C). The regression analysis (Fig. 2 B, D) shows that the relationship between observed and estimated values is weak, despite the significance of the R2.
The statistic measures of validation (Table 1) show that ‘Alvarinho’ plot presented the smaller MAE and a MA%E within the limits of acceptability suggested by Kleijnen (1987) (≤ 10%) while ‘Arinto’ one showed an overestimation with a MA%E above that upper limit. The validation results for the two other canopy features (exposed leaf area and canopy volume) showed similar relative differences among varieties to the ones reported
GiESCO Mendoza 2017 - 19
above for canopy height (Table 1). This behavior is explained by the fact that both variables are calculated as the product of canopy height x canopy width x canopy length (1 m). The highest error was found on the canopy volume of the ‘Arinto’ plot.
Yield
Actual yield and yield components presented a very high variability in all parameters for both varieties being the yield/m the variable with the highest CV (data not shown). ‘Alvarinho’ presented a higher bunch number (18 vs 6 bunches/m for ‘Alvarinho’ and ‘Arinto’ respectively) and a lower bunch weight (116 g vs 325 g) than ‘Arinto’. Indeed ‘Arinto’is a variety with low fruitfulness but very large bunches, features that allowed compensate for the lower bunch number, inducing a similar yield to ‘Alvarinho’.
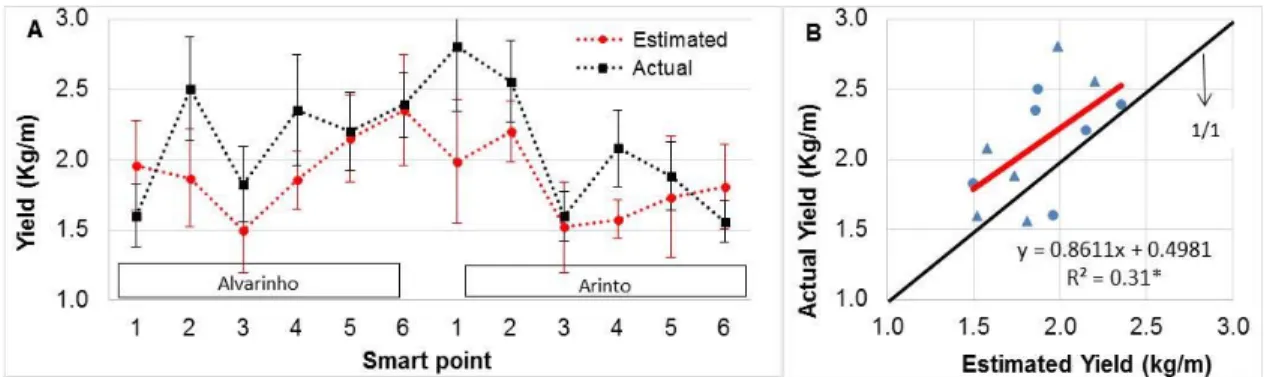
In order to reduce errors induced by possible desynchronization between ground truth data and corresponding VINBOT images, the comparison between actual and estimated yield was done using averaged data per smart point (10 m canopy length). Figure 3A shows that, despite a small underestimation of the actual yield for some smart points, in general, the estimated values presented a similar trend to the actual values. Regarding the relationship between actual and estimated values (Fig. 3B), despite the significant R2 showed by the regression
analysis, the equation of the fitted line indicate that the VINBOT algorithms underestimated the yield by an additive factor. The statistic measures of validation (Table 2) confirm this trend showing the highest MAE for the ‘Arinto’ plot and a high MA%E for both plots, all above the upper limit on acceptability suggested by Kleijnen (1987). This underestimation may be explained by the bunch occlusions (bunch-on-bunch and leaf induced occlusions). Such occlusions, which depend on bunch number per vine, bunch size and canopy density, constitutes a major problem for this approach, as noted by Nuske et al. (2014) who proposed some solutions based on modeling and calibration of occlusion ratio to overcome the problem. Research is ongoing to test those solutions and other alternatives for estimating and modeling the occlusion ratio for our conditions. The performance of the algorithms used for grape recognition has also contributed to this underestimation. Indeed the validation of the grape detection algorithms against thousands of images manually labeled as grapes and no-grapes showed an accuracy of 83% with 3% of false positives and 14% of false negatives. Furthermore, the empirical models used to correct the total bunch projected area (for bunch occlusion by the vegetation) and to convert it into kg of grapes, could have also amplified the errors, contributing to reduce the prediction ability.
Conclusion
Our results show an acceptable performance of the VINBOT platform for an automated estimation of canopy features, with a better accuracy within the ‘Alvarinho’ plot than in the ‘Arinto’ one. Regarding the yield estimation, it was observed a general underestimation of actual yield for both plots, results that can be attributed to a combined effect of bunch occlusions, grape detection algorithms accuracy and empirical relationships used in final yield calculations. Further research on computer vision algorithms, data processing, modeling and calibration is needed to improve the reliability and accuracy of the yield estimations by the VINBOT. Special attention should be paid to overcome the difficulties related to the hidden bunches by vegetation.
Acknowledgments
This research has received funding from the European Community’s Seventh Framework Program (SME 2013-2), grant agreement nº 605630, Project VINBOT.
References
CLINGELEFFER P., DUNN G., KRSTIC M., MARTIN S. 2001. Crop Development, Crop Estimation and Crop Control to Secure Quality and Production of Major Wine Grape Varieties: A National Approach. Final report to Grape and Wine Research and Development Corporation, CSIRO Plant Industry, Austrália.
DIAGO M., CORREA C., MILLAN B., BARREIRO P., VALERO C., TARDAGUILA J. 2012. Grapevine yield and leaf area estimation using supervised classification methodology on RGB images taken under field conditions. Sensors, 12, 16988-17006.
DIAGO M., TARDAGUILA J., ALEIXOS N., MILLAN B., PRATS-MONTALBAN, J.M., CUBERO S., BLASCO J. 2015. Assessment of cluster yield componentes by image analysis. J Sci Food Agric, 95, 1274–1282.
DUNN G.M. and MARTIN S.R., 2004. Yield prediction from digital image analysis: A technique with potential for vineyard assessments prior to harvest. Aust. J. Grape Wine Res, 10, 196-198.
EUROBOTICS AISBL, 2013. Robotics 2010. Strategic Research Agenda For Robotics in Europe 2014-2020.
GiESCO Mendoza 2017 - 20 HERRERO-HUERTA M., GONZÁLEZ-AGUILERA D., RODRIGUEZ-GONZALVEZ P., HERNÁNDEZ-LÓPEZ D. 2015. Vineyard yield estimation by automatic 3D bunch modelling in field conditions. Computers and Electronics in Agriculture, 110, 17–26.
IVORRA E., SANCHEZ A.J., CAMARASA J.G., DIAGO M.P., TARDAGUILA J. 2015. Assessment of grape cluster yield components based on 3D descriptors using stereo vision.Food Control, 50, 273-282.
KLEIJNEN J. P. C., 1987. Statistical tools for simulation modeling and analysis. McGraw-Hill, New York.
KRIZHEVSKY A., SUTSKEVER, I., GEOFFREY E.H. 2012. ImageNet Classification with Deep Convolutional Neural Networks. Advances in Neural Information Processing Systems, 25, 1097-1105.
LIU, S., MARDEN, S., WHITTY, M. 2013. Proceedings of Australasian Conference on Robotics and Automation, 2-4 Dec 2013, University of New South Wales, Sydney Australia.
MAYER D. G., BUTLER D. G., 1993: Statistical validation. Ecol. Model., 68, 21-32.
NUSKE S., WILSHUSEN K., ACHAR S., YODER L., NARASIMHAN S., SINGH S. 2014. Automated Visual Yield Estimation in vineyards. Journal of Field Robotics, 31(5), 837-860.
SCHAEFFER D. L., 1980. A model evaluation methodology applicable to environmental assessment models. Ecol. Model., 8, 275-295.
VISIONROBOTICS, 2017. Intelligent Autonomous Grapevine Pruner. https://www.visionrobotics.com/vr-grapevine-pruner. Accessed 12 June 2017.
VITIROVER, 2017. Découvrez le VitiRover. http://www.vitirover.com/fr/. Accessed 12 June 2017.
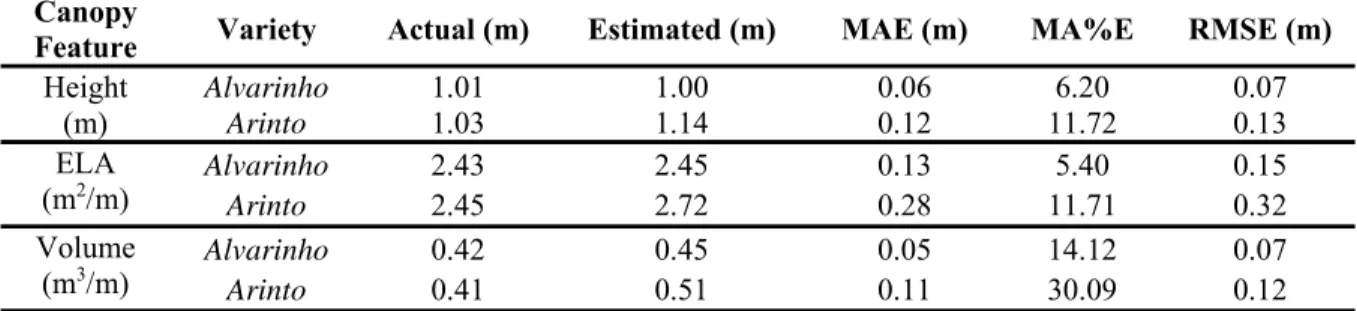
Table 1. Statistical data for the validation of canopy features. ELA – exposed leaf area; MAE - mean absolute
error; MA%E - mean absolute percent error; RMSE – root mean square error. n=60.
Canopy
Feature Variety Actual (m) Estimated (m) MAE (m) MA%E RMSE (m)
Height (m) Alvarinho 1.01 1.00 0.06 6.20 0.07 Arinto 1.03 1.14 0.12 11.72 0.13 ELA (m2/m) Alvarinho 2.43 2.45 0.13 5.40 0.15 Arinto 2.45 2.72 0.28 11.71 0.32 Volume (m3/m) Alvarinho 0.42 0.45 0.05 14.12 0.07 Arinto 0.41 0.51 0.11 30.09 0.12
Table 2. Statistical data for yield validation of the two varietal plots at ISA vineyard, 2016. MAE - mean
absolute error; MA%E - mean absolute percent error; RMSE – root mean square error. Data averaged per smart point (n= 6 smart points: groups of 10 contiguous vines per variety).
Plot Actual (kg/m) Estimated (kg/m) MAE (kg) MA%E RMSE (kg)
‘Alvarinho’ 2.15 1.95 0.32 15.2 0.39
GiESCO Mendoza 2017 - 21
Figure 1. View of the Vinbot robot prototype
Figure 2. Actual vs estimated values of canopy height assessed at harvest on the varieties ‘Alvarinho’ (A, B)
and ‘Arinto’ (C, D). n=60. The right plots show the relationship between actual and estimated values with the black line representing the 1/1 line. The * indicates a significant R2 (p< 0.05).
Figure 3. A) Actual vs estimated values of averaged (± standard error) yield per smart point (10 m canopy