i
Improvement of the Portuguese Breast Cancer
Screening through Process Modelling (BPM)
Inês Filipa Terras Marques
Dissertation presented as partial requirement for obtaining
the Master’s degree in Information Management
iii
NOVA Information Management School
Instituto Superior de Estatística e Gestão de Informação
Universidade Nova de Lisboa
IMPROVEMENT OF THE PORTUGUESE BREAST CANCER SCREENING
THROUGH PROCESS MODELLING (BPM)
by
Inês Filipa Terras Marques
Dissertation presented as partial requirement for obtaining the Master’s degree in Information Management, with a specialization in Knowledge Management and Business Intelligence
Advisor: Professor Vítor Manuel Pereira Duarte dos Santos Advisor: Professor Carolina Santos
iv
ACKNOWLEDGEMENTS
First, I would like to thank to my advisors, Professor Vítor Manuel Pereira Duarte dos Santos and Professor Carolina Santos for the support, availability and knowledge sharing. Without it this dissertation would not be possible.
I would also like to thank to Dr. Vítor Melquíades, Regional Director of the Breast Cancer Screening from the Portuguese League Against Cancer, for all his help and for providing the necessary information for the development of this research project and to all the experts interviewed, Rita Teles Branco, Natércia Almeida, Dr. Fernando Lage and Dr. Henrique Nabais.
Finally, I would like to thank to my family and friends for always believing in me and a special thanks to my parents, brother and boyfriend for the unconditional support.
v
ABSTRACT
Breast cancer is a malignant epithelial neoplasm with high incidence and mortality in women. Focusing the clinical performance on screening processes has proven to be the way to improve morbidity and mortality statistics of this recognized public health problem. Business process management (BPM) is a management field that improves and analyzes business processes according to organizations’ strategies. BPM may help manage patient and information flow, improving waiting time in healthcare delivery while integrating healthcare processes with IT. The early diagnosis of breast cancer is of great importance since it will enable more conservative treatments and a longer disease-free survival. Organized oncology screenings programs, with all elements properly prepared, revealed to be more efficient than the opportunistic screenings. The aim of this study is to identify and model BPM processes for the healthcare sector, namely, for the breast cancer screening in Portugal. To achieve this goal, the main processes were identified and new frameworks were proposed and validated through individual interviews with experts. In this study was concluded that BPM techniques can be applied to the healthcare. Through the application of these techniques it was possible to identify the main issues within the organized breast cancer screening and suggest changes to it. These changes focus on reducing the time of the process, improving its efficiency and offering greater support to the health user.
KEYWORDS
vi
INDEX
1. Introduction ... 1 2. Literature review ... 3 2.1. Breast Cancer ... 3 2.2. Screening ... 52.2.1. Breast Cancer Organized Screening ... 6
2.2.2. Challenges for Breast Cancer Organized Screening ... 7
2.3. Portuguese League Against Cancer ... 9
2.4. Business Process Management ... 10
2.4.1. AS-IS Model and TO-BE Model ... 11
2.4.2. Process Performance Measures ... 12
2.4.3. Transformation Techniques ... 12
2.4.4. Process Modelling Notation - BPMN 2.0 ... 13
2.5. Artificial Intelligence (AI) ... 16
2.5.1. Data Cleaning ... 16
2.5.2. AI in the Breast Cancer Screening ... 16
2.6. Past Research Using BPM in Healthcare ... 18
3. Methodology ... 23
3.1. Research Strategy... 23
3.1.1. Identification of processes ... 24
3.1.2. Recognition of Entities ... 24
3.2. Selection of the software to support the business process management ... 26
3.3. Selection of the transformation technique - Lean ... 26
3.4. Interviews as method for qualitative validation ... 28
4. Study ... 29
4.1. Macroprocess ... 29
4.2. Process “Health users’ invitation” - AS-IS Diagram ... 30
4.3. Process “Screening” - AS-IS Diagram ... 31
4.4. Process “Reading of the exam” - AS-IS Diagram ... 32
4.5. Process “Check-up Consultation” - AS-IS Diagram ... 33
4.6. Process “Sending Results” - AS-IS Diagram ... 34
5. Critical Analysis ... 35
6. To-Be Models ... 39
6.1. Process “Health users’ invitation” – To-Be Diagram ... 39
6.2. Process “Screening” - To-Be Diagram ... 40
vii
6.4. Process “Check-up Consultation” - TO-BE Diagram ... 42
6.5. Process “Sending Results” - TO-BE Diagram ... 43
7. Validation ... 44
8. Discussion... 50
9. Conclusion ... 52
9.1. Limitations ... 53
9.2. Recommendations for future works ... 53
Bibliography ... 54
viii
LIST OF FIGURES
Figure 2.1 – Estimated global number of new cases and deaths for breast cancer in women, 2012.
Retrieved from (IARC, 2016)... 3
Figure 2.2 – Cancer incidence and mortality rates (estimated age-standardized) worldwide, per 100 000 in men and women in 2012. Retrieved from (IARC, 2016) ... 4
Figure 2.3 – Regions covered by the nuclei of the south of the Portuguese League Against Cancer. Provided by the LPCC ... 9
Figure 2.4 – The DMEMO process lifecycle. Adapted from (Szelągowski, 2018) ... 11
Figure 2.5 – Symbols for start, intermediate and end events (from left to right) ... 14
Figure 2.6 – Symbols for tasks and sub-processes (from left to right) ... 14
Figure 2.7 – Symbols for the different types of Gateways ... 14
Figure 2.8 – Symbols for sequence flow, message flow and association (from left to right) ... 14
Figure 2.9 – Symbols for pools and lanes... 15
Figure 2.10 – Symbols for data objects, groups and annotations (from left to right) ... 15
Figure 3.1 – Methodology Scheme ... 23
Figure 4.1 – Macroprocess for the Breast Cancer Organized Screening ... 29
Figure 4.2 – Process “Health users’ invitation” – AS-IS Diagram ... 30
Figure 4.3 – Process “Screening” – AS-IS Diagram ... 31
Figure 4.4 – Process “Reading of the exam” – AS-IS Diagram ... 32
Figure 4.5 – Process “Check-up Consultation” – AS-IS Diagram ... 33
Figure 4.6 – Process “Sending Results” – AS-IS Diagram ... 34
Figure 6.1 – Process “Health users’ invitation” – TO-BE Diagram ... 39
Figure 6.2 – Process “Screening” – TO-BE Diagram ... 40
Figure 6.3 – Process “Reading of the exam” – TO-BE Diagram ... 41
Figure 6.4 – Process “Check-up Consultation” – TO-BE Diagram ... 42
ix
LIST OF TABLES
Table 2.1 – Comparison between Breast Cancer Opportunistic and Organized Screenings. (Anttila et al.,
2015; Holland, 2006; IARC, 2016; WHO, 2014) ... 6
Table 2.2 – Summary of related articles ... 22
Table 3.1 – Identified processes of the Breast Cancer Organized Screening ... 24
Table 3.2 – Identified actors of the Breast Cancer Organized Screening ... 25
Table 3.3 – Identified systems of the Breast Cancer Organized Screening ... 25
Table 3.4 – Identified documents of the Breast Cancer Organized Screening ... 26
x
LIST OF ABBREVIATIONS AND ACRONYMS
ABPMP Association of Business Process Management Professionals ACES Primary Health Care Units
AI Artificial Intelligence
BPM Business Process Management BPMN Business Process Model and Notation CAD Computer-Aided Detection
EHR Electronic Health Record
IARC International Agency for Research on Cancer IT Information Technology
k-NN k-nearest Neighbor
LPCC Portuguese League Against Cancer MRI Magnetic Resonance Imaging OMG Object Management Group
RGPD General Regulation on Data Protection SVM Support Vector Machine
xi
PUBLICATIONS RESULTING FROM THIS DISSERTATION
Terras Marques I., Santos C., Santos V. (2020) Process Modelling (BPM) in Healthcare – Breast Cancer Screening. In: Antona M., Stephanidis C. (eds) Universal Access in Human-Computer Interaction. Design Approaches and Supporting Technologies. HCII 2020. Lecture Notes in Computer Science, vol 12188. Springer, Cham. https://doi.org/10.1007/978-3-030-49282-3_7
Accepted for poster presentation in the “16th World Congress on Public Health 2020” and in the “I Conferência de Integração de Cuidados de Saúde | NOVAsaúde Integrated Care”.
1
1. INTRODUCTION
Breast cancer is a public health problem since it’s the most frequent cancer among women and one of the principal causes of cancer related death in women worldwide (IARC, 2016; Mathioudakis et al., 2019; Obaidullah, Ahmed, Gonçalves, & Rato, 2019). According to the International Agency for Research on Cancer (IARC), 2016, “before age of 75 years, 1 in 22 women will be diagnosed with breast cancer and 1 in 73 women will die from breast cancer, worldwide”. In Portugal, in 2012, more than 6000 new cases appear and around 1600 women, per year, died with this disease (Lacerda et al., 2019). Breast cancer is a malignant epithelial neoplasm, characterized by an uncontrolled growth of the abnormal breast cells with metastasis capacity (Cardoso, 2017). It is classified in different subtypes according to histological type, differentiation and the tumor-node-metastasis staging system (Cardoso, 2017). The early diagnosis of breast cancer is of great importance since the detection of small tumors, which are only detectable in ultrasound and mammography, or tumors in evolutionary phase non-invasive, will enable treatments less mutilating, with more conservative surgeries and a longer disease-free survival (Cardoso, 2017). Oncology screening allow earlier diagnosis of the disease, in subclinical stages, and aims the reduction of cancers’ mortality (Miranda, 2016). Any screening program is dependent of a sequence of interventions, beginning in the identification of the target population until the post treatment (Miranda, 2016).
Business process management (BPM) is a management field characterized for being a well-designed, implemented, executed, integrated, monitored and controlled approach, that improves and analyzes business processes according to organizations’ strategies (Buttigieg, Dey, & Gauci, 2016; Lopez-Sanchez, Campos, & Musavi, 2009). A business process is composed by structured and interconnected activities, which produce a service or product focused in the client’s needs (Lopez-Sanchez et al., 2009). BPM has six core elements that are needed for a proper implementation, namely: Strategic alignment, Governance, Methods, Information technology (IT), People and Culture (Buttigieg et al., 2016). Targeting optimal patient outcomes is the aim of health service delivery. Additionally, focusing the clinical performance on processes has been proving to be the way to improve morbidity and mortality disease statistics (Buttigieg et al., 2016).
BPM in healthcare may support the development of standardized processes, minimizing the variation in quality of healthcare delivery and errors, and selecting the right enablers in information management and technology to manage these processes (Buttigieg et al., 2016). Furthermore, BPM can also help manage patient and information flows, improving waiting time in healthcare delivery while integrating healthcare processes with IT (Buttigieg et al., 2016).
The application of BPM techniques has been increasing in public health, although there are still some failures due to improper adoption of BPM and because of content and structural issues present in the health care sector (Buttigieg et al., 2016). Due to the highly complex and multidisciplinary processes existing in healthcare systems, the application of BPM becomes a challenge (Buttigieg et al., 2016). BPM principles may be applied in hospitals but also in other settings like primary care and rehabilitation units (Buttigieg et al., 2016).
In order to properly implement BPM in organized breast cancer screening programs, two research questions should be answered: (1) What are the processes involved in the breast cancer screening in Portugal? (2) What are the constraints of the breast cancer screening programs?
2 The current widespread of technology and its importance in several different areas, including diagnosis and treatment of oncology diseases, makes it an important feature to improve the quality and the implementation of preventive and screening actions. Technology and healthcare professionals must be connected, allowing the development of multidisciplinary teams responsible for the patients tracking since the detection and preventive stage. Organized screening programs, with all elements properly prepared, revealed to be more efficient than the opportunistic screenings (non-organized and unmonitored) (Miranda, 2016). BPM gets its role on optimizing and managing all processes from the screening until the diagnosis and treatment.
The goal of this dissertation is the optimization, identification and modelling of BPM processes for the Portuguese breast cancer screening, by:
• Identification of the “AS-IS” model for the processes of the screening of breast cancer, according to a major player (Portuguese League Against Cancer);
• Description of each activity present in the process and the role of each stakeholder; • Identification of bottlenecks and problems;
• Process improvements proposal considering the available information and “AS-IS” model analysis.
3
2. LITERATURE REVIEW
2.1. B
REASTC
ANCERThe human body is composed of several millions of cells which coordinate between themselves to constitute tissues and organs (Devarriya, Gulati, Mansharamani, Sakalle, & Bhardwaj, 2019). Normal cells grow and divide for a period of time and then stop growing and dividing until its needed again to replace defective or dying cells (Bhardwaj & Tiwari, 2015; Devarriya et al., 2019). When this cell’ reproduction become out of control and the cells lose their ability to stop dividing and spreading, a mass called tumor is formed and the cancer appears (Bhardwaj & Tiwari, 2015; Devarriya et al., 2019; Mušić & Gabeljić, 2019). The tumor can be classified as benign or malign according to its features (Bhardwaj & Tiwari, 2015; Devarriya et al., 2019; Mušić & Gabeljić, 2019).
Breast cancer is a malignant cell growth in the breast tissue which has the capacity to spread to other areas of the body when left untreated (Bhardwaj & Tiwari, 2015; Devarriya et al., 2019). It is classified according to stages which describe the size of the tumor and if it has spread to lymph nodes or metastasized to distant organs. The staging system normally used for breast cancer is the tumor-node-metastasis (TNM) classification. In the TNM classification, stage I and II are for localized disease, stage III is for regional disease and stage IV is for distant disease. Accurate staging provides key prognostic information (IARC, 2016).
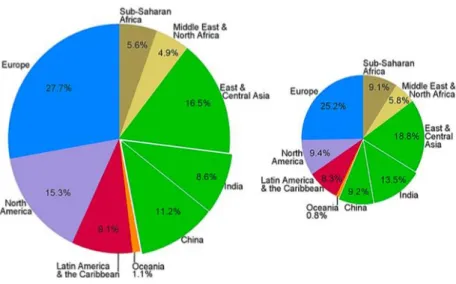
The estimated global incidence of breast cancer in 2012, was of 1.68 million new diagnosis of breast cancer (43.3 per 100 000) and the estimated mortality was of 0.52 million deaths (12.9 per 100 000), as seen in Figure 2.1 (IARC, 2016). Its incidence was three times that the cancer of colorectal (0.61 million new cases, 14.3 per 100 000), lung (0.58 million new cases, 13.6 per 100 000) and cervix (0.53 million new cases, 14.0 per 100 000), the next most frequent types of cancer in women (Figure 2.2). While its mortality was similar to that from lung cancer (0.49 million deaths, 11.1 per 100 000) and significantly greater than that from the colorectal (0.32 million deaths, 6.9 per 100 000) and cervix (0.27 million deaths, 6.8 per 100 000) (Figure 2.2) (IARC, 2016).
Figure 2.1 – Estimated global number of new cases and deaths for breast cancer in women, 2012. Retrieved from (IARC, 2016)
4 Figure 2.2 – Cancer incidence and mortality rates (estimated age-standardized) worldwide, per
100 000 in men and women in 2012. Retrieved from (IARC, 2016)
The risk of a woman develops breast cancer increase with the age, the majority of the cases appear in women older than 50 years, and the way to reduce its mortality is with an early detection and effective treatment (Bhardwaj & Tiwari, 2015; IARC, 2016). Breast cancer is one of the most treatable types of cancer when early detected (Obaidullah et al., 2019).
5
2.2. S
CREENINGPrevention of cancer can be reached through primary prevention, intended to prevent the occurrence of cancer, or through secondary prevention, which has the purpose of an earlier diagnosis of the cancer in order to reduce related mortality and distress (IARC, 2016). The principal elements of secondary prevention are screening and early clinical diagnosis and they are essential components of any cancer control program (IARC, 2016).
Screening programs promote the detection of cancer at earlier stages, enabling the prescription of timely and suitable treatment, making the cure and the reduction of mortality associated with the disease realistic possibilities (IARC, 2016). The implementation of these programs aims to impact on disease mortality rates, however, the effective outcomes highly depend on the participation of the population, which relies on a set of factors such as people’s knowledge and beliefs and on organizational aspects of the screening procedures and its availability (Deandrea et al., 2016). Thus, the acceptance and use of screening services differ between populations, making a given screening organized program not universally cost-effective (IARC, 2016).
The screening programs can be classified as organized or population-based, and opportunistic. Organized screening programs are settled at national or regional level, have a team responsible for organization and provision of healthcare, a structure for quality assurance and an explicit policy while the opportunistic screenings result from a recommendation from a routine medical consultation, for an unrelated problem, based on a possibly increased risk of developing breast cancer (due to family history or other risk factors) (IARC, 2016). Population-based screenings reach women who haven’t participated in opportunistic screening. These programs enable more equity in access, creating conditions for women to obtain adequate diagnosis and treatment, including low users of healthcare services and the ones from lower socioeconomic groups (IARC, 2016; WHO, 2014). With universal access to rapid and effective diagnosis and treatment, the potential impact of early detection of cancer boosts (Anttila et al., 2015).
Opportunistic screening is less susceptible to quality assurance compared to the organized programs considering its lack of administrative and organization infrastructure (IARC, 2016). As mentioned by IARC, 2016, the organized programs include “centralized screening invitations to a well-defined target population, systematic call and recall for screening, delivery of test results, investigations, treatment and follow-up care and a program database with linkages to other information systems” and an administrative structure responsible for service delivery like follow-up of lesions, quality assurance and evaluation (IARC, 2016).
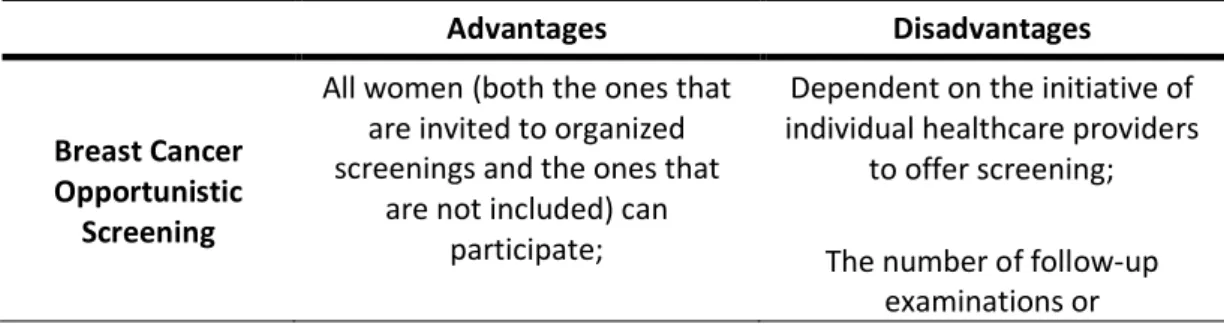
Table 2.1 presents both the advantages and disadvantages of opportunistic and population-based screening.
Advantages Disadvantages
Breast Cancer Opportunistic
Screening
All women (both the ones that are invited to organized screenings and the ones that
are not included) can participate;
Dependent on the initiative of individual healthcare providers
to offer screening; The number of follow-up
6 Enable the access to screenings
in areas where organized screenings don’t exist.
histopathological evaluations is probably higher; Overdiagnosis and
overtreatment;
Risk of causing more harm than good.
Breast Cancer Organized Screening
Attract women of lower socioeconomic status who would not usually undergo mammography screening; Equitable access to screening; Uses resources more efficiently;
Best balance between benefits and harms;
Organized mammography screening, biennially, is
cost-effective; Can shorten the interval between diagnosis and start of
treatment through prompt referral to hospital units.
Overdiagnosis (detection of breast cancer by screening that
otherwise would never have presented clinically during the
woman’s lifetime) and consequently overtreatment; Resource costs in finding more
illness and the subsequent management of what is
discovered;
Anxiety felt by all individuals tested between undergoing the
screening test and the final diagnosis.
Table 2.1 – Comparison between Breast Cancer Opportunistic and Organized Screenings. (Anttila et al., 2015; Holland, 2006; IARC, 2016; WHO, 2014)
2.2.1. Breast Cancer Organized Screening
Since the late 1980s, good evidence emerging from trials on the effectiveness of breast cancer screening has become available, so screening programs have been in place in Europe (Deandrea et al., 2016). In the subsequent years was described a gradual implementation of breast cancer screening programs, however, with some heterogeneity and different policies (Deandrea et al., 2016). With this, the council recommendation of December 2nd, 2003, at European Union level, stablished a list of requirements to implement organized, population-based breast cancer screening programs (Deandrea et al., 2016).
Currently, the breast cancer screening with mammography alone is the population-based method used in the majority of the European countries for the early detection of this cancer (Mathioudakis et al., 2019). Screening asymptomatic women includes the execution of mammography screening, at specified intervals, and referring those women with positive results for additional diagnostic investigations and possibly treatment (IARC, 2016). A decrease on the breast cancer mortality in women aged 50 to 74 years has been shown (Mathioudakis et al., 2019). Within all of the European
7 countries, only France added a clinical breast examination to the mammography (Deandrea et al., 2016). The screening programs are offered to normal-risk women beginning with ages comprised between 40 to 50 years old and ending with ages between 69 to 74 years old and usually in intervals of two years (IARC, 2016).
Mammography can be used to check for breast cancer in women without signs or symptoms of the disease and is characterized for being an imaging modality specifically for breast tissue, which uses low energy X-ray (Mušić & Gabeljić, 2019). From all the breast cancers detected by mammography screening, less than one third would also be detectable by clinical examination (IARC, 2016). Normally, in the screening programs, the mammography involves two views (X-ray images) of each breast and double reading (Mušić & Gabeljić, 2019). With this technique it is possible the early detection of malignant tumors before the tumor spreads (Mušić & Gabeljić, 2019).
However, mammography screening has also some limitations and undesirable effects associated. As for example, it is not effective in detecting lesions in women with radiologically dense breasts, the radiation exposure and the false-negative or false-positive mammography results (Mathioudakis et al., 2019; Mušić & Gabeljić, 2019; Sadeghi et al., 2019). The reported rate of false-negative results in mammography is of at least 10% and false-positive results can lead to anxiety and psychological distress (Mušić & Gabeljić, 2019). There isn’t yet a completely consensus on the harm-benefit balance of breast cancer screening thus, women need to receive balanced and adequate information to make informed decisions related to their participation in screening programs (Mathioudakis et al., 2019). It’s essential an efficient communication in order to help women make an informed decision concerning their participation in the screening (IARC, 2016).
Although clinical breast examination and breast self-examination don’t make part of the screening program, they can complement it. The first technique involves systematic palpation of both breasts and nipples and visual inspection by a trained health-care provider. While the second, is an examination done by the women herself of her breasts (IARC, 2016). These techniques are only useful for detecting suspicious breast lesions, once it doesn’t determine malignancy with assurance (Jaglan, Dass, & Duhan, 2019).
2.2.2. Challenges for Breast Cancer Organized Screening
Although mammography continues to be the gold standard of the screening methods (Sadeghi et al., 2019), it has some limitations as previously mentioned. As so, it’s essential to find a way to solve these limitations. Nowadays, research and discussions moved on to the use of digital breast tomosynthesis as routine for screening programs. But, until now no single screening program has changed to routine use of digital breast tomosynthesis (IARC, 2016).
Digital breast tomosynthesis derives from digital mammography and produces quasi three-dimensional images, reducing the effect of tissue superimposition, which allows better visualization and localization of potential lesions, improving mammography interpretation (IARC, 2016). It improves the rate of cancer detection and reduce the proportion of patients’ recall for additional imaging studies (Ikejimba et al., 2019). Although the radiation dose of digital mammography with tomosynthesis is around twice of the dose of mammography alone, it is considerably reduced by reconstruction of two-dimensional images from the three-two-dimensional images (IARC, 2016).
8 Other imaging techniques available are: breast ultrasonography, magnetic resonance imaging (MRI), electrical impedance technology for breast imaging, scintimammography, and positron emission mammography. In non-randomized studies, for ultrasonography and digital breast tomosynthesis, there were evidence of incremental cancer detection when used as complement screening to mammography (IARC, 2016). Other studies have shown that breast ultrasonography and breast MRI are the best alternatives for mammography and may improve the breast cancer prognosis (Jaglan et al., 2019).
Breast ultrasonography screening have frequently focused on populations with mammographic density since dense breast tissue is a risk factor for breast cancer and reduces the sensitivity of mammography, consequently it is associated with greater probability of an interval cancer in mammography screening. Ultrasonography-only detected cancers were usually early-stage cancers, comparable or even in earlier stages than cancers detected through mammography (IARC, 2016). Breast MRI have been proving to be a good alternative to mammography since it doesn’t involve radiation exposure however, its specificity is too low and the interpretation is complex and not standardized, being recommended only for screening of high-risk women (Jaglan et al., 2019). Molecular diagnostics are revolutionizing human oncology in order to enable early detection, target therapies or monitoring treatment (Wiley, Wise, & Breen, 2019). Liquid biopsies, through the identification of genetic signatures associated with cancers, allow the detection of tumors in preclinical stages (Gerratana et al., 2019; Wiley et al., 2019). This is a recent technique but efforts are being done to use them in early stage breast cancer, with respect to early disease detection and minimal residual disease, offering new opportunities for improving cancer screening (Gerratana et al., 2019; Wiley et al., 2019).
In order to early and accurately identify the breast cancer it’s important to ensure the extraction of information from previous diagnosis data (Bhardwaj & Tiwari, 2015; Devarriya et al., 2019). Since machine learning techniques enable computers to learn from past data and patterns its usage in medical diagnosis is gradually increasing (Bhardwaj & Tiwari, 2015). Computer-aided diagnosis systems are being proposed since it helps reducing the number of unnecessary breast biopsies (Mušić & Gabeljić, 2019). As concluded by Mušić et Gabeljić, 2019, the use of neural network to classify mammographic tumors is benefic and should be used by physicians to improve quality, accuracy and potentially the speed of digital mammography.
9
2.3. P
ORTUGUESEL
EAGUEA
GAINSTC
ANCERThe Portuguese league Against Cancer (LPCC) was founded in April 4th, 1941, proposed by Francisco Gentil. The league is based in two principles: the humanization and the solidarity (LPCC, 2019). It is a national entity of reference in the support for oncology patients and their family, in promoting health, in cancer prevention and in promoting research and training in oncology. It is composed by five regional nuclei: Azores, Centre, Madeira, North and South (LPCC, 2019).
The increasing focus of resources on patient’ care and on the early detection of the disease led to the creation of one of the most important initiatives of the league: National Breast Cancer Screening Program. Currently, the LPCC is responsible for the majority of the breast cancer population-based screenings in Portugal. The population program covers completely the region of the center (78 municipalities), the districts of Beja, Braga, Bragança, Évora, Portalegre, Santarém, Viana do Castelo and Vila Real, the majority of the municipalities of the district of Porto, the municipality of Azambuja (Lisbon) and the municipalities of Alcácer do Sal, Sines, Grândola and Santiago do Cacém (Setúbal) (LPCC, 2019).
In this research project the breast cancer screening process followed by the LPCC nuclei of the south will be used as the case study (Figure 2.3).
Figure 2.3 – Regions covered by the nuclei of the south of the Portuguese League Against Cancer. Provided by the LPCC
Two mobile units are used to perform the screening and every two years go to municipalities and fixed units. Inviting letters are sent to women with ages between 50 to 69 years old that are enrolled in the Health Units, in order to perform a mammogram (free exam). This exam is evaluated by two radiologists that in case of doubt call the woman to a clinic consultation and if this doubt persist she’s referred to hospital facilities where a final diagnostic will be done. If suspicions are confirmed the woman goes to treatment (LPCC, 2019).
10
2.4. B
USINESSP
ROCESSM
ANAGEMENTBusiness Process Management (BPM) has gain power and interest to organizations due to its capacity to help achieve operational excellence, increase productivity and save costs (Recker & Mendling, 2016). It is considered to be a management discipline which associates knowledge from information technology with management sciences and applies that to business processes (ABPMP, 2013; van der Aalst, 2013).
BPM is a term used since 2002, which represents a body of knowledge comprised by principles and best practices to guide an organization through focused management of the organization’s business processes, in order to continuously improve and achieve their objectives more efficiently (ABPMP, 2013; Combi, Oliboni, & Zerbato, 2019; Froger, Bénaben, Truptil, & Boissel-Dallier, 2019). Its basis is an explicit representation of the activities and execution constraints between them, involved in the business processes (Hajiheydari & Dabaghkashani, 2011).
A business process is defined as a complete and dynamically coordinated set of activities, related across time and space, that transform one or more inputs into a specific output with value to a customer, either a product or a service (ABPMP, 2013; Combi et al., 2019; Hajiheydari & Dabaghkashani, 2011). The way processes are designed and executed affect the quality of the service perceived by the customer as well as the efficiency with which services are delivered (Dumas, La Rosa, Mendling, & Reijers, 2018). BPM includes methods and tools to support tasks of modelling, managing and analyzing of these processes, helping optimize the means by which the organization delivers their output (ABPMP, 2013; Dani, Freitas, & Thom, 2019). The design, administration, configuration and enactment of business processes are also integrated as capabilities of BPM techniques (Hajiheydari & Dabaghkashani, 2011). Since business processes are becoming more complex, process modelling has becoming of greatest importance for organizations (van der Aalst, 2013).
As referred by Van der Aalst, 2013, BPM aims achieve operational business processes improvement without the use of new technology but it is also frequently associated with software to manage, control and support operational processes. BPM can be used in any organization, from for-profit to non-profit and government entities (ABPMP, 2013).
According to the ABPMP (2013), when an organization has mature BPM capabilities their processes are managed following a closed-loop cycle, which composes the Business Process Lifecycle (ABPMP, 2013). The number of phases present in this lifecycle and the labels used to describe them vary between authors, considering this, in this document the DMEMO cycle will be followed (Figure 2.4). The DMEMO cycle results from a sequence of five stages: Define, Model, Execute, Monitor and Optimize (Szelągowski, 2018).
11 Figure 2.4 – The DMEMO process lifecycle. Adapted from (Szelągowski, 2018)
When starting a BPM initiative, the first question that needs to be clarified should be: “Which business processes do we aim to improve?” (Dumas et al., 2018). Before applying BPM, the team should have an idea of what business processes may be causing problems (Dumas et al., 2018). Considering this, it’s important to start the BPM practices by describing the processes of the organization, building “AS-IS” models, and analyzing them according to the organization’s data and the knowledge of its employees, which corresponds to the definition stage (Szelągowski, 2018). A critical step in BPM is understand the value delivered by a process, by measuring it. To do that it’s important to determine the process performance measures that will be used to evaluate if a process is valuable or not (Dumas et al., 2018).
With the result of the previous analysis, composed by an understanding of the issues in the process and the potential solutions, an improved process model is prepared (the “TO-BE” model) which corresponds to the Model stage (Dumas et al., 2018; Szelągowski, 2018). The next phase is the Execution, where personnel’s training and changes to their work is done, as well as changes to the IT systems, including process performance automation. The goal of the Monitor phase is to perform and monitor business operations in agreement with organized and implemented process descriptions. When expectations are no longer accomplished, adjustments to the implemented business process are required which corresponds to the last stage, the Optimization (Dumas et al., 2018). At this phase, the process performance is evaluated and the process descriptions are improved with the purpose of raising efficiency and minimizing risks (Szelągowski, 2018).
2.4.1. AS-IS Model and TO-BE Model
In order to properly analyze and change a specific business process, it’s necessary to start by understanding its current state, creating one or several “AS-IS” models (ABPMP, 2013). This process model should reproduce what people in the organization understands about how work is done (Dumas et al., 2018). To capture all the needed information, many different methods can be used, as for example: direct observation, one-on-one interviews, written feedback, structured workshops and web conferencing. While using these techniques, some inconsistencies, unnecessary activities and opportunities for improvement can be noticed (ABPMP, 2013). So, with these problems identified, a redesigned version of the process can be proposed, the “TO-BE” model, which is the main output of the process improvement (model phase) (Dumas et al., 2018). In this stage, analysis and redesign are
12 associated because several redesign options can be considered and each one of them needs to be analyzed in order to choose the preferable one (Dumas et al., 2018).
2.4.2. Process Performance Measures
Process performance management should begin with the examination of the processes that will be monitored for performance. When properly identified, it’s important to understand processes effectiveness, if they deliver what is supposed to or not (ABPMP, 2013).
A process performance measure is defined by Dumas, 2018, as a quantity that can be clearly determined for a given business process. According to ABPMP (2013) and Dumas (2018) there are four fundamental measurements:
• Time – Associated with process duration. The cycle time measures the time taken from the start of a process until its completion, considering the output;
• Cost – Value associated with a process, which is typically a monetary value. There are different perspectives on cost, being possible to distinguish between fixed (almost not affected by the intensity of processing) and variable (positively correlated with some variable quantity) or it can be related to productivity, operational cost (directly related to the outputs of the business process);
• Capacity – Amount or volume of a realistic output related to a process;
• Quality – Normally expressed as a percentage of actual to optimal or maximum. It can be seen from two different angles: external quality (client’s satisfaction with the product or the process) and internal quality (process participants’ viewpoint).
Quality is the hardest measure to define in terms of oncology screenings, being evaluated on the basis of a set of performance indicators, like detection rates and the predictive values of the tests (Ponti et al., 2017). A screening program in order to be considered to have quality should be safe, efficient, effective and offer equity in access (National Screening Unit & Ministry of Health, 2005).
Finally, when redesigning a business process, the time required to handle a case and the cost required for executing the process should decrease, the quality of the service delivered should be improved, and the resilience of the business process to deal with variation should increase (Dumas et al., 2018).
2.4.3. Transformation Techniques
Besides BPM, many other disciplines deal with business processes, being focused in improving the operational performance of the organization (Dumas et al., 2018). Several management disciplines can be used to define improvement opportunities like:
• Lean - is an approach that has as one of the main principles the elimination of the waste or non-value-add work while focusing on continuous improvement to optimize the operations, providing higher quality, reduced cycle time and lower costs (ABPMP, 2013; Dumas et al., 2018). It focuses on the people of the organization through the creation of a culture that empowers staff at all levels to make innovative changes to improve productivity whilst reducing waste (Pearce & Pons, 2013). Nowadays, Lean is supported
13 by tools and statistical methods that are important for improvement projects. Normal results show reductions in time aligned with quality increase and the cost of quality decreases (ABPMP, 2013; Pearce & Pons, 2013). The application of lean is based on five steps (Amador, 2013): (1) define value from a customer’s perspective; (2) identify value stream; (3) make the value flow without interruptions by eliminating when possible waste between steps of the process; (4) implement customer “pulls” service and (5) pursue perfection continuously.
• Six Sigma - is a method that improves business performance by reducing variation in work or in quality and by minimizing defects (errors) (ABPMP, 2013; Dumas et al., 2018). It has become one of the most accepted enterprise improvement methodologies for organizations chasing to identify business problems and define improvement opportunities (ABPMP, 2013). In practice, Six Sigma is not necessarily applied alone but combined with other methods as for example with Lean, being referred as Lean/Six Sigma (ABPMP, 2013; Dumas et al., 2018).
2.4.4. Process Modelling Notation - BPMN 2.0
A notation is defined as a standardized set of symbols and rules that manage how something is represented. In business process modelling notation icons and connectors are included to assist in the representation of relationships between components of a business process. There are available several modelling and notational standards and techniques (ABPMP, 2013). This research study applies Business Process Model and Notation (BPMN) 2.0, which is considered the main standard and was created by the Business Process Management Initiative, now merged with the Object Management Group (OMG) (ABPMP, 2013; Sang & Zhou, 2015). BPMN is a technique, frequently used as notation in the process modelling tasks, that uses structured analysis to diagrammatically represent business processes and aims providing, to all business users, an easy-to-understand notation (Dani et al., 2019; Georgiou et al., 2019).
BPMN 2.0 is an extremely accurate notation that indicates the beginning, intermediate and end events; activities and message flows; intra-business communications and inter-business collaboration, activity and data flows (ABPMP, 2013). According to Dani et al. (2019), Combi et al. (2019) and White (2004), there are four basic categories of BPMN elements, each other with several core elements:
1. Flow objects:
• Events: representation of actions that occur during process execution and affect the sequencing or timing of process activities. Normally have a cause (trigger) or an impact (result) and are represented as circles with open centers. They can be of three types, concerning when they affect the process flow:
o Start: initiate a process instance;
o Intermediate: indicate where something happens somewhere between the start and end of a process;
14 Figure 2.5 – Symbols for start, intermediate and end events (from left to right)
• Activities: are represented by a rounded-corner rectangle and can be of two types: Task and Sub-process. It is called task when it’s seen as single unit of work, it cannot be broken into a finer level of abstraction. If a process is too complex, subsets of its elements can be grouped to form sub processes within the main process, represented by a small plus sign in the bottom center of the shape.
Figure 2.6 – Symbols for tasks and sub-processes (from left to right)
• Gateways: elements in the process, that can also be called as decision points, used to control the divergence and convergence of the sequence flow. They are represented by a diamond shape and can be of three types: AND, for concurrency (two or more activities that can be executed in parallel); OR, for inclusive choices (one or more options can be true at the same time) and XOR, for exclusive choice (outcomes are mutually exclusive).
Figure 2.7 – Symbols for the different types of Gateways 2. Connecting Objects:
• Sequence Flow: is used to link two elements and handle the order through which a process will be executed. It is represented by a solid line with a solid arrowhead. • Message flow: is used to demonstrate the flow of messages between two participants.
It is represented by a dashed line with an open arrowhead.
• Association: is used to associate data, text and other artefacts with flow objects. It is represented by a dotted line with a line arrowhead.
15 3. Swimlanes:
• Pools: join elements of an organization, represents a participant in a process
• Lanes: divide a pool into different organization’s resources, being used to organize and categorize activities. It’s a sub-partition within a pool.
Figure 2.9 – Symbols for pools and lanes 4. Artefacts:
• Data objects: present how data is required or created by activities
• Group: is used for documentation or analysis purposes, but does not affect the sequence flow. It is represented by a rounded corner rectangle drawn with a dashed line
• Annotation: is a mechanism to provide additional text information for the reader of a BPMN Diagram
Figure 2.10 – Symbols for data objects, groups and annotations (from left to right)
Amongst others, its advantages are widespread usage and understanding and being one of the most powerful and versatile notations for identifying process constraints (ABPMP, 2013). On the other hand, some identified disadvantages are: (1) requires training and experience to use full set of symbols correctly; (2) challenge to see relationships between multiple levels of a process; (3) doesn’t support security aspects as confidentiality (ABPMP, 2013; Sang & Zhou, 2015).
16
2.5. A
RTIFICIALI
NTELLIGENCE(AI)
2.5.1. Data Cleaning
In the healthcare sector as in several other areas, the databases contain raw data that is unpreprocessed, incomplete and noisy. In this way, the databases should undergo pre-processing, through data cleaning and data transformation (Larose & Larose, 2015).
Data cleaning also called data cleansing or scrubbing refers to all types of tasks and activities to detect and repair errors and inconsistencies in the data. While collecting and acquiring data some errors are often introduced, such as missing values, typos, mixed formats and others (Ilyas & Chu, 2019; Rahm & Do, 2000). It is composed by repeated cycles of four phases: screening, diagnosis, treatment and documentation. Screening is look systematically for suspect features in assessment questionnaires, databases or analysis datasets. The diagnosis is responsible for identify the nature of the defective data and the treatment involves deleting, editing or leaving the data as it is. These two phases require a complete understanding of all sources and types of possible errors during data collection and entry processes. The documentation is related to recording modifications enabling the track of errors detected, changes, additions and error checking which allows to return to the original value if necessary (ACAPS, 2016).
2.5.2. AI in the Breast Cancer Screening
It’s been for several decades that intelligent computer systems exist and impact society needs. Several different areas are interested in artificial intelligence (AI) research and development, from sectors such as technology, communication, to health and industry (Houssami, Kirkpatrick-Jones, Noguchi, & Lee, 2019).
In the healthcare sector, AI systems are being developed, explored and evaluated to help in clinical decision-making and in the detection and prognostic of diseases, as for example for oncology diseases (Houssami et al., 2019). Computer-aided detection (CAD) software was introduced in the 1990s for mammography, as an assistance for radiologists with the objective to improve human detection performance (McKinney et al., 2020; Rodríguez-Ruiz et al., 2019). However, this generation of software failed in improving readers’ performance in real-world settings (McKinney et al., 2020). Unlike them, AI is capable of advanced learning and has the potential to do stand-alone interpretations in the future (Houssami, Lee, Buist, & Tao, 2017). The substantial improvements in AI, through deep convolutional neural networks (usually named as deep learning algorithms), are making closer the performances of humans and computers in several medical imaging applications, such as breast cancer detection (Rodríguez-Ruiz et al., 2019).
The screening of breast cancer requires the interpretation of digital mammograms to find suspicious abnormalities, which is subjective, and its accuracy varies widely, leaving space for improvement even in the performance of the best clinicians (Houssami et al., 2017; McKinney et al., 2020). Although the evaluation of patient data and expert judgment are the most important factors in this type of diagnosis, there are other factors affecting it, such as the visual perception capacity of the radiologist, less experience of the radiologist, the presence of noise in images, poor contrast or inadequate clarity (Sadoughi et al., 2018).
17 The usage of AI systems to support breast cancer screening classification could help reducing the workload involved in the double-reading process, while maintaining the standard of care (McKinney et al., 2020). As mentioned in some studies, AI represents a feasible and timely technology opportunity for exploration in breast cancer screening practice (Houssami et al., 2019, 2017).
Sadoughi et al. (2018) introduce many AI techniques in imaging processing:
• Support vector machine (SVM) – This technique is inspired by the statistical learning theory and has been recently incorporated in the machine learning set. Here, the overfitting problem in the training data is reduced and it’s possible the identification of a sizeable training set with small subsets of training points.
• Cascade forward back-propagation network – In this technique each layer of neurons is linked to all previous neuron layers and it uses post propagation algorithm to update weights, like back- propagation neural network.
• Feed forward back-propagation network – This network includes input, output and hidden layers and the back-propagation learning algorithm is used for learning.
• k-nearest neighbor (k-NN) - This method selects a group of K records from a training record set that has the closest records to the test record. Deciding the class of the test record according to the highest number of records in the selected neighborhood. • Genetic algorithm as optimizer – Since this algorithm works on its own rules, it can be
used for irregular problems. It can rapidly scan a group of solutions and eliminate bad proposals and not affecting the final result.
• Naive Bayes classifier - It’s estimated by the covariance matrix and it is a simple probability classifier based on the theory of Bayes. It needs only a small amount of training data to estimate the required classification parameters.
• Deep learning technology – This method contains more image processing layers than the conventional image feature-based machine learning classifiers. Each layer is a typical neural network and uses the image itself as a single input.
18
2.6. P
ASTR
ESEARCHU
SINGBPM
INH
EALTHCAREBy searching for the words BPM, BPMN, Healthcare, Oncology Screening and Process Modelling in the platforms Scopus and Google Scholar, the authors retain important information from 7 articles, presented in the following table (Table 2.2). To the best knowledge of the author, there isn’t yet a study about the implementation of BPM techniques in the process of Breast Cancer Screening.
Title Year Author(s) Reference(s) Brief Description
Introduction to BPM approach in healthcare and case study
of end user interaction with EHR interface 2018 Gomes, J.; Portela, F. and Santos, M. (Gomes, Portela, & Santos, 2018)
• Any healthcare institution needs to have a detailed and itemized management of all processes present;
• Business process Management is already a solution for process management in healthcare organizations with the purpose of improve work speed and efficiency,
simplifying processes and reducing the use of resources;
• Healthcare organizations have very complex structures, requiring adequate process management;
• Healthcare organizations have problems in process management, namely: (1) Strategic level, (2) Tactical level and (3) Operational level;
• In healthcare level BPM works in parallel with hospital information systems; • The services of a health institution are not independent from each other; they are
interconnected and make the organization function as a whole;
• To correctly apply BPMN, its necessary to understand the steps required to execute a given process and its surroundings, in order to represent the processes detached
from their level of complexity;
• BPMN will have an impact in increasing the level of quality of the services, in reducing costs and in identifying losses or wastes;
• BPMN is intuitive, simplifying complex processes’ diagrams;
• Organizations benefit with the adoption of BPMN either in organizational and economic levels.
19 A BPMN-based automated approach for the analysis of healthcare processes 2016 Antonacci, G.; Calabrese, A.; D'Ambrogio, A.; Giglio, A.; Intrigila, B. and
Ghiron, N. Levialdi
(Antonacci et al., 2016)
• Healthcare organizations are increasingly pressed to improve the quality of care services in an unfavorable context (increasing complexity in patient treatment and
reduction of available resources);
• Efforts to standardized and improve healthcare quality and efficiency have been done but it still persists a variation in performance;
• Researchers and practitioners promote process redesign as a valuable way to reduce practice variation and improve the quality of care while considering efficiency issues; • According to BPM frameworks, the healthcare process lifecycle includes six phases: (1) definition, (2) specification, (3) analysis, (4) implementation, (5) execution and
monitoring and (6) diagnosis and improvement;
• Factors that limit the adoption of simulation-based analysis techniques in the healthcare domain: (1) healthcare processes are complex, distributed and multi-disciplinary, (2) medical knowledge is often tacit and rapidly evolving, (3) the adoption
of information technologies is still in its early stages and data when available is often disseminated in different information systems and (4) staff of healthcare
organizations often lacks skills of modelling and analysis;
• BPMN can satisfy the necessity of clinical pathway models for creating diagrams of these pathways and is able to manage the variability in a more effective way; • BPMN only works with functional characterization of processes without offering the
capacity of specifying non-functional properties as performance and reliability. Improving access to healthcare with on-line medical appointment system 2019 Leung, W. and Nøhr, C. (Leung & Nøhr, 2019)
• Business process reengineering can be a method to find possibilities to improve the design of medical appointments systems, from “as-is” to “to-be”;
• Since health care systems are composed by processes coordinated and logically sequenced, producing value to a client or costumer, they can benefit from using BPM
approaches;
• BPM gives importance on the use of information technology as a tool to improve business processes;
20 • BPMN supports technical users and business users to manage healthcare processes
by providing a notation that both understands;
• Devil's quadrangle can help healthcare industry to be conscious about problems in terms of time, quality, cost and flexibility as performance indicators;
• Process redesign combines incremental improvement and extension of the existing process;
• Healthcare institutions should evaluate the trade-off by using “as-is” and “to-be” process model. BPMN for healthcare processes 2011 Müller, R. and Rogge-Solti, A. (Müller & Rogge-Solti, 2011)
• BPM has become to be considered a valuable asset in the healthcare domain; • BPMN designed to be understandable for business professionals and IT-specialists.
Driving time-dependent paths in clinical BPMN processes 2017 Combi, C.; Sala, P. and Zerbato, F.
(Combi, Sala, & Zerbato, 2017)
• Time management is important at all stages of business process design, enactment and analysis;
• During process execution, different types of temporal conditions can limit how a process path is preferred;
• Clinical domain it’s appropriate for business process modelling, considering its intrinsic organizational and decisional complexity;
• BPMN constructs are enough to build process diagrams that succeed in specifying and enforcing temporal constraints;
• BPMN process presents the main steps for the detection and treatment of Catheter-Related Bloodstream Infections in intensive care units, simplified from IDSA guideline.
21 A real-world case scenario in business process modelling for home healthcare processes 2016 Ilahi, L.; Ghannouchi, S. and Martinho, R. (Ilahi, Ghannouchi, & Martinho, 2016)
• Technologies of BPM, principally the design (modelling) aspect, are recognized to normally offer collaboration support by information technologies;
• BPM is a valuable asset in the healthcare area because of the competitiveness, rapid advancement and the expansion of communication techniques and new technologies in all research domains, together with the effectiveness of BPM tools to automate and
better manage business processes of organizations;
• Technologies of BPM didn’t have a widespread adoption in the healthcare; • Process aware hospital information systems must be able to cope with exceptions,
uncertainty and evolving processes;
• Healthcare systems have particular modelling requirements: collaboration, understandability and flexibility.
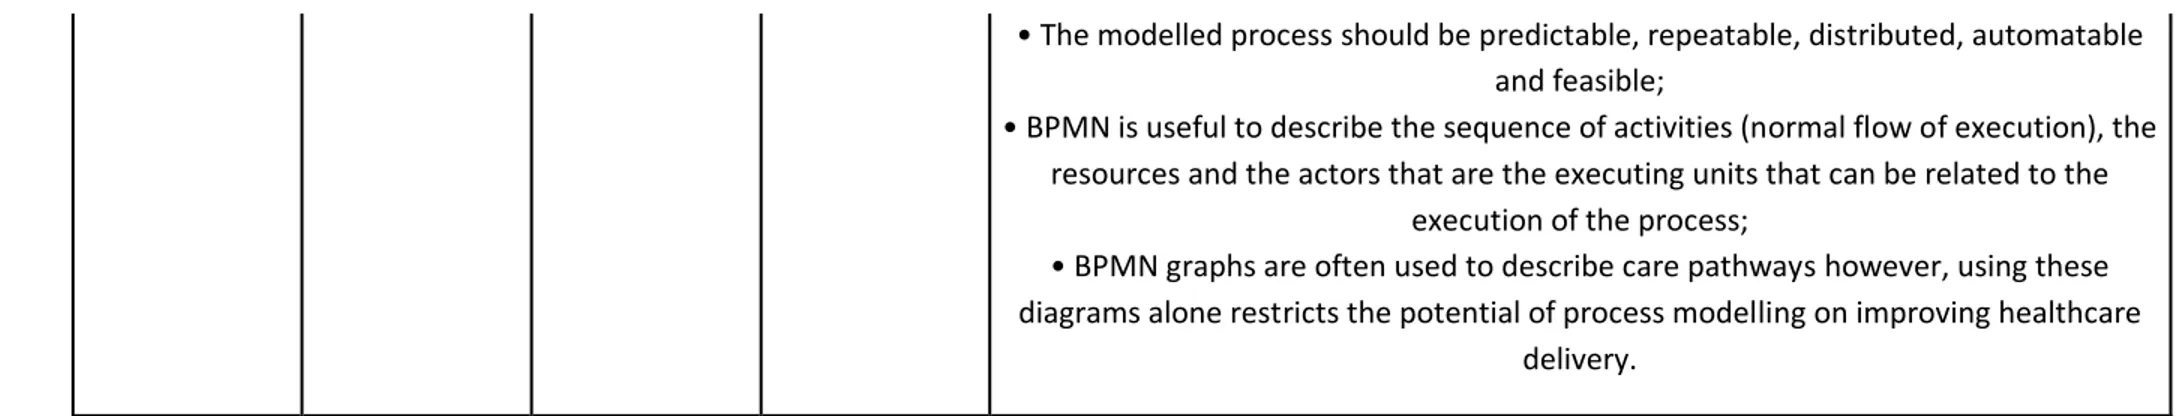
A design methodology for medical processes 2016 Ferrante, S.; Bonacina, S.; Pozzi, G.; Pinciroli, F. and Marceglia, S. (Ferrante, Bonacina, Pozzi, Pinciroli, & Marceglia, 2016)
• Healthcare processes are complex and need transparency of all the process elements in order to achieve their implementation;
• Healthcare process modelling as solution to reduce complexity and provide transparency;
• Process modelling can define cooperative work, helping surpass the information gap between different actors;
• Both clinical and organizational processes introduce dynamic activities, requiring adequate modelling methodologies;
• Medical decision making, the clinical problem solving, is the foundation of clinical processes, being present in all stages of care (prevention, diagnosis, treatment and
rehabilitation);
• Graphical modelling languages offer a shared and understandable way to represent processes, simplifying context analysis and converting experiences into models; • Modelling healthcare processes is more complex than modelling other processes since medical processes are described by uncertainties, unpredictability, evolution,
22 • The modelled process should be predictable, repeatable, distributed, automatable
and feasible;
• BPMN is useful to describe the sequence of activities (normal flow of execution), the resources and the actors that are the executing units that can be related to the
execution of the process;
• BPMN graphs are often used to describe care pathways however, using these diagrams alone restricts the potential of process modelling on improving healthcare
delivery. Table 2.2 – Summary of related articles
23
3. METHODOLOGY
3.1. R
ESEARCHS
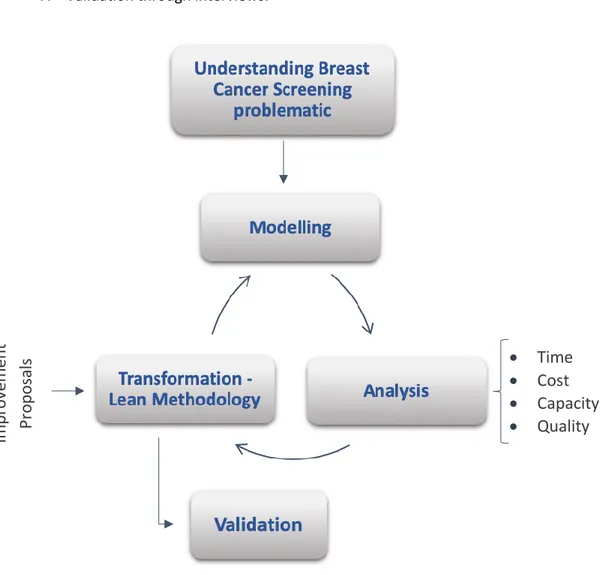
TRATEGYTo achieve the goals of this dissertation the following steps were considered (Figure 3.1): 1. Understanding the problematic of breast cancer screening;
2. Identification of the current processes for the screening of breast cancer; 3. Recognition of the Entities involved in the process;
4. Design of the “AS-IS” diagram (modelling); 5. Critical Analysis of the “AS-IS” diagram;
6. Improvement proposal through the design of the “TO-BE” diagrams; 7. Validation through interviews.
Figure 3.1 – Methodology Scheme
Through a literature review (chapter 2) the problematic of the breast cancer screening was presented, for fully understanding the process itself according to the state-of-the-art. To acquire this information, an online research through the platforms Scopus and Google Scholar was performed, which resulted in the acquisition of recent and relevant information about the topic. For the recognition of the
•
Time
•
Cost
•
Capacity
•
Quality
Im
p
ro
vem
ent
P
ro
p
o
sals
24 processes and all the entities involved, the nuclei of the south of the Portuguese League Against Cancer was used as case study and the information retrieved will be presented in the chapters 3.1.1 and 3.1.2, respectively. This enabled to modelling the current processes as “AS-IS” diagrams (chapter 4). In order to analyze the “AS-IS” diagrams and propose some improvements to the process, a reunion between the author, co-supervisors and the Regional Director of the Breast Cancer Screening from the LPCC was done. To support this, the four fundamental measurements (time, cost, capacity and quality) were used and the Lean methodology was followed (chapter 5). From here resulted the construction of the “TO-BE” diagrams for each process (chapter 6). This project ends with the validation through interviews to experts in the field (chapter 7).
3.1.1. Identification of processes
In this phase, the existing processes for the screening of breast cancer made by the LPCC were studied. To completely understand the processes and sub-processes, an interview to the Regional Director of the Breast Cancer Screening from the LPCC was required.
These processes are documented in word or PowerPoint documents and was necessary to review the existing documents and record the undocumented processes in a more comprehensible, less complex and up-to-date language, using BPMN 2.0.
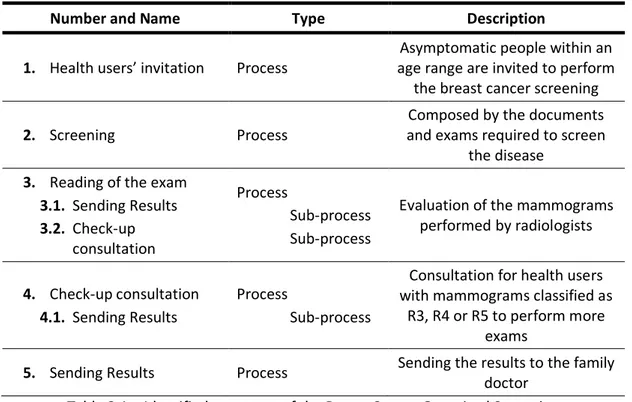
The Table 3.1 has a concise explanation of the major processes identified within the breast cancer organized screening, which together form its macroprocess.
Number and Name Type Description
1. Health users’ invitation Process
Asymptomatic people within an age range are invited to perform
the breast cancer screening
2. Screening Process
Composed by the documents and exams required to screen
the disease 3. Reading of the exam
3.1. Sending Results 3.2. Check-up consultation Process Sub-process Sub-process
Evaluation of the mammograms performed by radiologists
4. Check-up consultation 4.1. Sending Results
Process
Sub-process
Consultation for health users with mammograms classified as
R3, R4 or R5 to perform more exams
5. Sending Results Process Sending the results to the family doctor
Table 3.1 – Identified processes of the Breast Cancer Organized Screening
3.1.2. Recognition of Entities
Within a business process, there are several organizational entities that may interact with each other. To analyze and transform a process, it’s necessary to understand the entities involved and their relationship.
25 The entities can be actors, systems or documents. The actors are the people that perform the activities in the process. The systems are the software used by the actors to perform their functions and to communicate with various stakeholders. The documents correspond to the methods used by the actors to share information between themselves, it can be digital or non-digital documents.
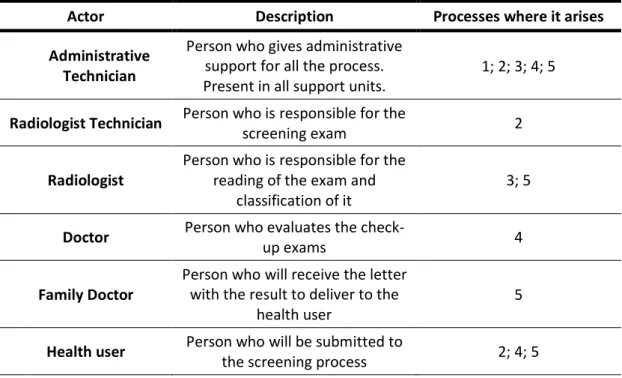
In the Table 3.2 the actors are presented, as well as a brief description of their roles and the screening processes in which they are involved.
Actor Description Processes where it arises
Administrative Technician
Person who gives administrative support for all the process. Present in all support units.
1; 2; 3; 4; 5
Radiologist Technician Person who is responsible for the
screening exam 2
Radiologist
Person who is responsible for the reading of the exam and
classification of it
3; 5
Doctor Person who evaluates the
check-up exams 4
Family Doctor
Person who will receive the letter with the result to deliver to the
health user
5
Health user Person who will be submitted to
the screening process 2; 4; 5
Table 3.2 – Identified actors of the Breast Cancer Organized Screening
In the Table 3.3 the systems are presented, together with a brief description of their role and the screening processes in which they are involved.
System Description Processes where it arises
SIRCM
Informatic system that enables monitoring every activity in the
screening program
1
Post mail
System used to send the invitation letters (both for screening and for check-up
consultation)
1; 2
Telephone
System used to re-invite eligible women for screening which
didn't attend on the first appointment and to schedule the
check-up consultation
1; 2
Microsoft Excel
Database of health users’ information (family doctor, social
security number, previous screenings)
1
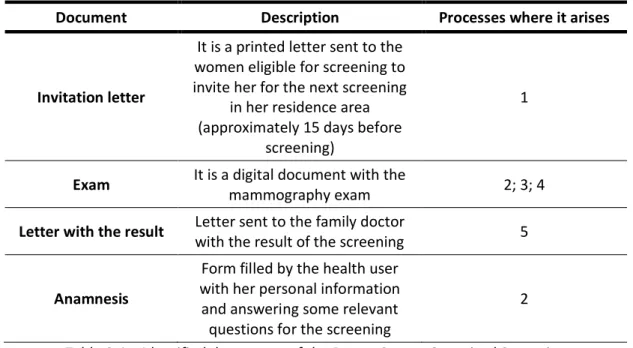
26 In the Table 3.4 all the documentation relevant for the processes already mapped, are identified, described and linked. The invitation letter and the anamnesis (both written in Portuguese) can be found in the annex I and II, respectively.
Document Description Processes where it arises
Invitation letter
It is a printed letter sent to the women eligible for screening to invite her for the next screening
in her residence area (approximately 15 days before
screening)
1
Exam It is a digital document with the
mammography exam 2; 3; 4
Letter with the result Letter sent to the family doctor
with the result of the screening 5
Anamnesis
Form filled by the health user with her personal information and answering some relevant questions for the screening
2
Table 3.4 – Identified documents of the Breast Cancer Organized Screening
3.2. S
ELECTION OF THE SOFTWARE TO SUPPORT THE BUSINESS PROCESS MANAGEMENTModelling helps to understand the business process and share this understanding with the people involved in it, while identifying and preventing issues (errors). In the market there are several software’s available to support business process management. In this work, Bizagi was the selected software to develop the diagrams.
Bizagi provides leading process and workflow automation solutions to customers in industries worldwide. It supports the business process lifecycle through modelling, execution, management and continuous improvement, with minimum amount of programming (Nafie, 2016). Bizagi has 3 products: Bizagi Modeler, Bizagi studio and Bizagi Automation.
Bizagi Modeler is a free of charge desktop application which uses BPMN as modelling notation and allow business experts to design, document and evolve their process models (Gjoni, 2015). High-quality documentation can be published in formats as Word, PDF, Web (HTML) and Wiki, and it’s feasible to import or export to interoperable formats such as Visio, XPDL or BPMN (Bizagi, 2019).
While working with this software, it’s possible to create many diagrams and group them into models that can be stored as local files, .bpm file extension, or directly in the cloud (Bizagi, 2019).
3.3. S
ELECTION OF THE TRANSFORMATION TECHNIQUE-
L
EANIn this project, the Lean approach was used as transformation technique since several studies evidenced that its principles and practices are being successfully used in healthcare processes (Amador, 2013; Shah, Sullivan, Gonyo, Wadhwa, & DuBois, 2013). It can be applied to improve staff productivity, standardize workflows and decrease patient waiting times while improving patient and staff satisfaction (Shah et al., 2013).
27 As mentioned before, the goal of this technique is the maximization of valued activities and minimization of waste. This waste can be classified as different categories (Shah et al., 2013; Teich & Faddoul, 2013):
1. Motion – movement of patients or staff members that is unnecessary
2. Transportation - movement of lab tests, supplies or equipment that is unnecessary 3. Inventory – inappropriate amount of supplies available, both too much or too little 4. Waiting – related to the time that the patient or staff waits until the next step in the
process occurs
5. Defects – errors or flaws in the process which can be related to poor labelling of tests, incomplete information in patients’ records and others
6. Over processing – redundancies that can be observed in the process caused by unclear definition of what needs to be done and by whom
7. Overproduction – excess work that doesn’t add value to the process. Producing something in excess, faster or earlier than required
8. Under-utilizing staff – the under-use besides time-dependent it also involves deeper levels such as not sharing knowledge or not taking advantage of someone’s skills
Teich and Faddoul (2013) suggest that lean implementation in healthcare should assign the patient to the center of the initiative, while time and comfort should be considered as key performance measures.