Sustainable development goals for reducing the impact of sea level rise on mangrove forests
12
0
0
Texto
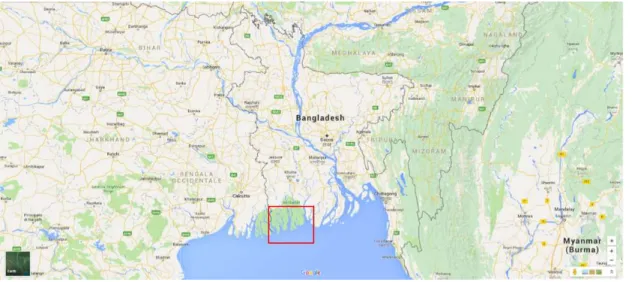
(2) 1948. INDIAN J. MAR. SCI., VOL. 47, NO. 10, OCTOBER 2018. Materials and Methods Sea level rise and Mangroves in Sundarbans Mangrove forests are one of the major victims of sea level rise. Mangrove forests ((figure1) are developing between MWL (Mean Water Level) and HWL (High Water Level). Geological records reveal that mangrove habitats shift or stay according to the speed of SLR21. When the speed of SLR is greater than the limit of a peat accumulation speed, mangrove forests will submerge in the sea and will die. The peat accumulation is a combined process of physical and biological ones. Unlike most dryland,, coastal wetlands can keep pace with a slow rate of sea level rise. This has enabled the area of wetlands to increase over the last several thousand years22. However, most authors have concluded that wetlands could not keep pace with a significant acceleration in sea level rise, and thus, that the area of wetlands converted to open water will be much greater than the area of dry land converted to wetlands23. Moreover, in areas where dikes es protect farmland or structures, all the wetlands could be lost24. The Sundarbans forest of Bangladesh, which is the largest mangrove of the world, occupies a land area of 6016 sq.km, of which rivers, streams, and channels occupy 1,874 sq.km25. It is located at the southern extremity the Ganges river delta bordering on the Bay of Bengall made up of about 70% land and 30% water. The Sundarbans alone constitute 40% of the forest lands under the jurisdiction of the Forest Department and 24% of the total forest area of Bangladesh 26. It is intersected from north to south by large rivers or. estuaries, stuaries, which are connected by numerous interlacing channels and a large number of flat, marshy islands27. The floristic composition of the Sundarbans is rich compared to many other mangroves of the world. There are 66 species of mangroves was identified in the Bangladesh Sundarbans which are belong to 37 families28. The natural vegetation of the Sundarbans is composed mainly of halophytic tree species. The trees of the Sundarbans exhibit hydrophytic and halophytic adaptations, which facilitate survival in waterlogged and saline conditions. Three ecological zones within the Sundarbans, differentiated according to salinity and species composition, are the freshwater zone, the moderately saltwater zone, and the saltwater zone29. In general, the forests in the northern and eastern parts of the Sundarbans are better supplied with freshwater30. The soil of Sundarbans is moderately saline to saline in the east and highly saline in the west. Soil salinity of Sundarbans is low in comparison com with other mangrove areas of the world where soil salinity exceeds that of sea-water water31. As the salinity of Sundarbans increases from east to west, the density of vegetation growth and canopy closure decreases from east to west32. Height and growth growt of different species in Sundarbans are related to the salinity33. A significant decrease in regeneration and growth is noticed with an increase in the level of salinity34. It indicates that salinity plays a vital role in the distribution of species in the Sundarbans as germination is linked to salinity. In order to study the impact of salinity on the distribution of species in Sundarbans, updated and intricate information of the salinity and the forest inventory is essential35.. Fig. 1 — The Sundarbans forest of Bangladesh shown inside the red box.
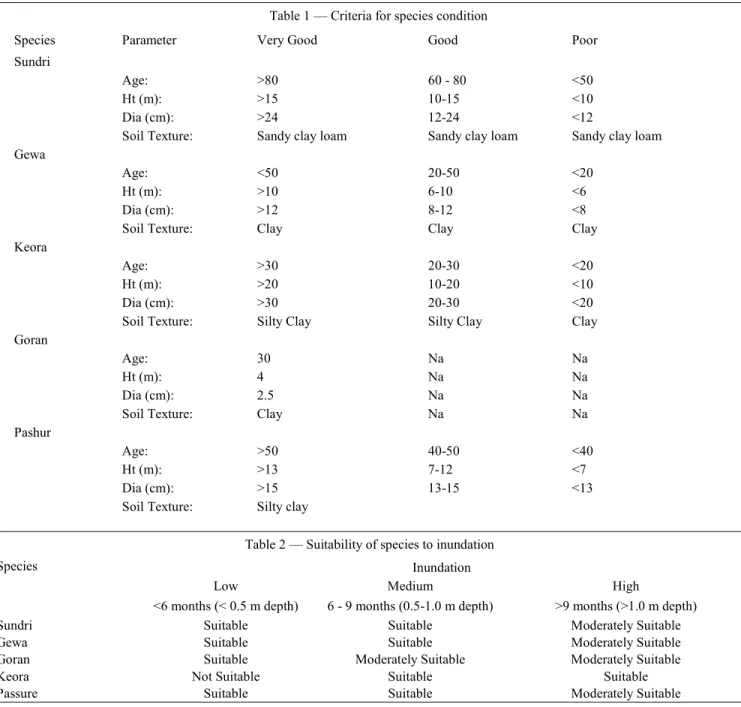
(3) FAKHRUDDIN et al.: SUSTAINABLE DEVELOPMENT FOR MANGROVE FORESTS. Researchers have studied the status of the mangroves in the world using Geoinformation science and RS in the past two decades36.Similarly, several studies have focused on using RS in identifying the salinity of a region37. However, there is a gap in identifying the impact of salinity in Sundarbans which can be addressed using GIS and RS. UNSDG, Climate change, and Mangrove forests Several published researches have shown that restoring Mangrove forests can help in achieving UNSDG38. Mangrove restoration directly helps us to achieve goal number 13 and 1539. However, restoring Mangroves and protecting the Mangroves will reduce poverty, and hunger which are goal 1 and 2 respectively. Similarly, it also ensures economic growth (SDG-8) in the communities which are dependent on Mangrove forests. Restoration helps the environment and the reduces the impact of the climate change in multifold such as: 1) Strom barriers to minimize the effects of climate related hazards along the coast 2) Mangrove forests are efficient carbon sinks which can effectively reduce pollution. 3) Stabilize intertidal sediments; reducing coastal erosion to reduce the impact of sea level rise 4) Sustainable livelihood ensures lesser impact to the environment and thereby reducing further damage. The afore mentioned facts prove the necessity to study the impact of salinity in the Mangrove forests in Sundarbans and for its restoration. Researchers have published several papers based on their study in Sundarbans forests7-12. Exploitation of mangrove forests, increased anthropogenic activities, increased sea level rise, and increased chemical discharges are major problems that been noticed by the researchers15-20 and by the Bangladesh Forest Research Institute (BFRI), the Institute of Forestry & Environmental Sciences of Chittagong University (IFSCU) and the Center for Environmental and Geographic Information Services (CEGIS) showed considering physical parameters and boundaries conditions to understand the impact of SLR in species distribution in mangroves forest in Sundarbans40. This has been the base of the present research where a previous analysis of the forest distribution has been done through satellite images and, in a second moment, the MIKE21 and MIKE11 software have been applied for defining the base condition and consequences for different sea level rise scenarios.. 1949. Soil Suitability Forest suitability of the Sundarbans was evaluated through examining the suitability of some key species of this unique mangrove ecosystem in the context of sea level rise. The key species considered in this study are Sundri, Gewa, Goran, Keora and Passure, which are ecologically and economically important. Since there will be a lot of changes in physical, chemical and biological parameters of this ecosystem due to sea level rise, the suitable condition for the key species are evaluated with some parameters: inundation due to water level rise, physical parameters, salinity and chemical parameters are taken for analysis of forest suitability. RS data was used in the present study to map the current and past forest coverage: a time-series of Landsat and ASTER images. Three sets of images were used: two sets of Landsat TM images of February 1992 and April 1996 and one set of ASTER VNIR image acquired in November of 2001/2003 covering the entire Sundarbans area were processed to derive the time-series. Intensive field investigation/ data collection has been conducted to develop the relation between the forest vegetation suitability and physical parameters (inundation and salinity). A limited amount of field data was collected from the Sundarbans. Field investigation was conducted to identify the major mangrove species such as Sundri, Gewa, Goran and their mixture and some species such as Keora and others. Different locations were visited (DangamariJongra, Bogi, Supati, Katka, Nilkamal, Dobaki, Notabanki, Kobadak, Kalbogi, Tiyarchar, etc.) to identify these species and their mixtures. Species Condition Before discussing the parameters, some criteria have been set to recognize whether a species is in good or poor condition (Table 1), according to the studies on the Sundarbans mangroves species previously mentioned41-44 Salinity According to ODA (Overseas Development Administration) and other recent studies45-47 three salinity ranges can be used to define favourable growing places for these mangrove species: Low (<15 ppt), Medium (15-25 ppt) and High (>25 ppt). The suitability of each species was therefore noted as suitable, moderately suitable or not suitable in terms of salinity..
(4) 1950. INDIAN J. MAR. SCI., VOL. 47, NO. 10, OCTOBER 2018. Inundation level Since the mangroves grow in tidal zones, inundation of land is an important factor for the growth of a species. Suitability of different species is defined in terms of three inundation duration classes45: <6 months, 6-9 months and >9 months (Table 2). Sea Level Rise A combination of two-dimensional and onedimensional models of the Bay of Bengal and Southwest area of Bangladesh using MIKE21 and MIKE11 software, developed by DHI, has been applied for defining the base condition and scenarios.. The existing calibrated and validated models were used for this study with the latest available data to simulate the hydrodynamic conditions for different sea level rise scenarios. The two-dimensional model of the Bay of Bengal describes the flow, water level and sediment transport processes in the Bay. The result of the two-dimensional Bay of Bengal model has been used as the downstream boundary condition for the one-dimensional Southwest regional model. In the model set up, a complex network of about 250 number of tidal and non-tidal river branches have been included. Catchments of Southwest regions are also included in the model. Schematization of the. Table 1 — Criteria for species condition Species. Parameter. Very Good. Good. Poor. Age: Ht (m): Dia (cm): Soil Texture:. >80 >15 >24 Sandy clay loam. 60 - 80 10-15 12-24 Sandy clay loam. <50 <10 <12 Sandy clay loam. Age: Ht (m): Dia (cm): Soil Texture:. <50 >10 >12 Clay. 20-50 6-10 8-12 Clay. <20 <6 <8 Clay. Age: Ht (m): Dia (cm): Soil Texture:. >30 >20 >30 Silty Clay. 20-30 10-20 20-30 Silty Clay. <20 <10 <20 Clay. Age: Ht (m): Dia (cm): Soil Texture:. 30 4 2.5 Clay. Na Na Na Na. Na Na Na Na. Age: Ht (m): Dia (cm): Soil Texture:. >50 >13 >15 Silty clay. 40-50 7-12 13-15. <40 <7 <13. Sundri. Gewa. Keora. Goran. Pashur. Table 2 — Suitability of species to inundation Species. Sundri Gewa Goran Keora Passure. Low <6 months (< 0.5 m depth) Suitable Suitable Suitable Not Suitable Suitable. Inundation Medium 6 - 9 months (0.5-1.0 m depth) Suitable Suitable Moderately Suitable Suitable Suitable. High >9 months (>1.0 m depth) Moderately Suitable Moderately Suitable Moderately Suitable Suitable Moderately Suitable.
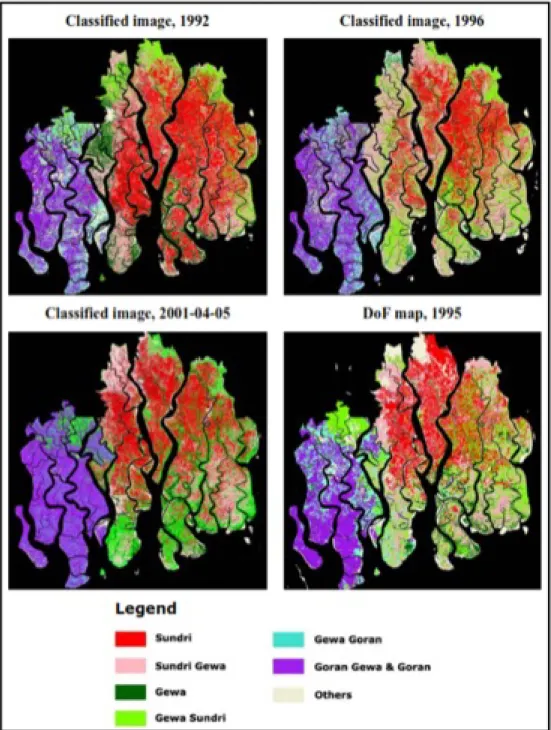
(5) FAKHRUDDIN et al.: SUSTAINABLE DEVELOPMENT FOR MANGROVE FORESTS. river system are done by using Dx = 2000 to 10000 m depending upon the length of the river reach and availability of the cross-section data46,47, where Dx is the distance between two h (a stage height computation point) or Q points (river flow calculation point) Boundary conditions The downstream boundary carries sea level rise impact into the upstream rivers/khals (tidal channels). The upstream boundary has been taken from observed time series data. The downstream boundary has been taken from 2D Bay of Bengal model. The south boundary of the 2D Model is located in the deep sea and has been generated from the predicted tide at Baruva in India and Shearle Point in Myanmar. Water levels, discharge, and velocity Water level, discharge, and velocity at each node of the modeled rivers are computed from Mike 11 runs for all scenarios and options. The water level has been used for flood depth and extent map preparation using GIS. Discharge and velocity data has been used to compute sediment transport for tidal and river floodplain zones. Salinity Salinity model developed by the Institute of Water Modelling (IWM) has generated the salinity data using hydrodynamic model results, Bay of Bengal results and some other parameters as input. The surface water salinity values were generated at model grid points along the rivers for the scenario and adaptation option runs. Using the available observed data from SRDI (Soil Resource Development Institute), relationship equations were developed to generate the ground water salinity and soil salinity from surface water salinity that was output of salinity model. Results The objective of this component was to classify and monitor the changes in the distribution of the mangrove species of the Sundarbans using a timeseries of Landsat and ASTER images. The output of this change detection is expected to provide an insight into the changing soil salinity conditions of the Sundarbans which to some extent influences the distribution of mangrove species in this forest. After the data collection on fieldwork, a series of maps has been produced showing the likely change in. 1951. vegetation habitat and distribution under different sea level rise scenarios. The images (figure 2) show that the Sundri is distributed mostly in the central, north and northeastern part of Sundarbans, whereas a mixture of Gewa&Sundri and Gewa is dominant mostly in the south and south-eastern part. On the other hand, Goran & Goran Gewa is dominated in the western part of Sundarbans. The Landsat TM 1992 images were classified using the same reflectance pattern of 1996 images. ASTER 2001-04-05 images were classified by relational spectral signatures of the Landsat TM 1996. A comparison of the time-series of classified images revealed a pattern of changing the distribution of the mangrove species. It was seen that in the western part of the Sundarbans the Goran-Gewa distribution became more dominant over time replacing the other species. Figure 3 is a snapshot from one of such areas (highlighted in yellow in figure 2). In a similar manner, the central and eastern parts showed the growing replacement of the Sundri species first by Goran and then by Gewa between 1992 and 2001. Both these patterns matched with the changing salinity regime in this region where salinity is slowly increasing from the western part towards the northeast. This favors the more salt-tolerant species such as Goran and Gewa over the Sundri. The suitability study of Sundri, based on salinity and inundation, in both back swamp and canal bank, shows that low saline and lower inundated areas are most suitable for their growth and survival. In back swamp areas, where drainage density is low, the growth of Sundri is good under low salinity-low inundation, low salinity-medium inundation, and medium salinity-low inundation. It implies that salinity less than 25 ppt and inundation less than 9 months (alternatively, inundation depth less than 1.0 m) is favorable for the growth of Sundri. In other cases, basically in higher salinity and inundation, Sundri’s growth is poor. Sundri cannot grow on canal banks due to very high salinity and frequent inundation. Similar to Sundri, Gewa trees predominantly grow in back swamp areas rather than canal bank areas. Analyzing the relation with inundation and salinity, it is observed that Gewa is most resistant in back swamp area whether the area has low or high drainage density. Except for high salinity-high inundation, all other cases of salinity-inundation matrix favors thegood growth of Gewa..
(6) 1952. INDIAN J. MAR. SCI., VOL. 47, NO. 10, OCTOBER 2018. Fig. 2 — The classified Landsat TM image of the year 1992 and 1996 and ASTER image of years2001-04-05 for major mangrove species. Department of Forest map 1995 is also shown with thesame color scheme. The most suitable places for the growth of Goran are back swamp areas where salinity is higher but inundation is lower. That is why Goran does not grow in canal bank areas. Both in high and low drainage density areas of back swamp, the growth of Goran are the same. Its growth is very good in high salinity and low inundation. Its growth is also good in medium salinity-low inundation, medium salinity-medium. inundation, and high salinity-medium inundation. In all other cases, Goran has the poor growing capacity. Sedimentation Sedimentation in coastal rivers and tidal floodplains is of major concern, which is expected to change with sea-level rise. The effect of sea-level rise on sedimentation in rivers was assessed considering.
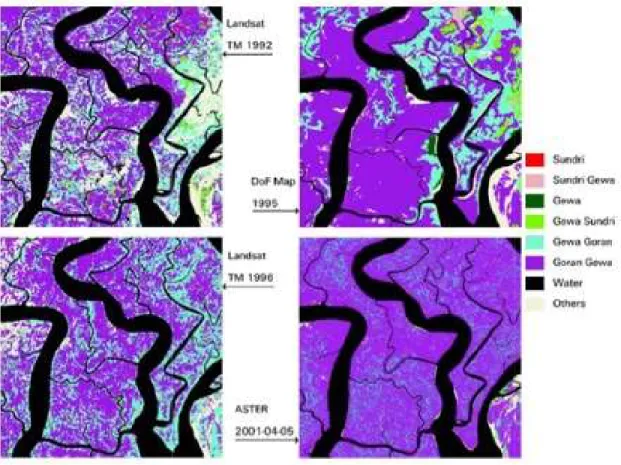
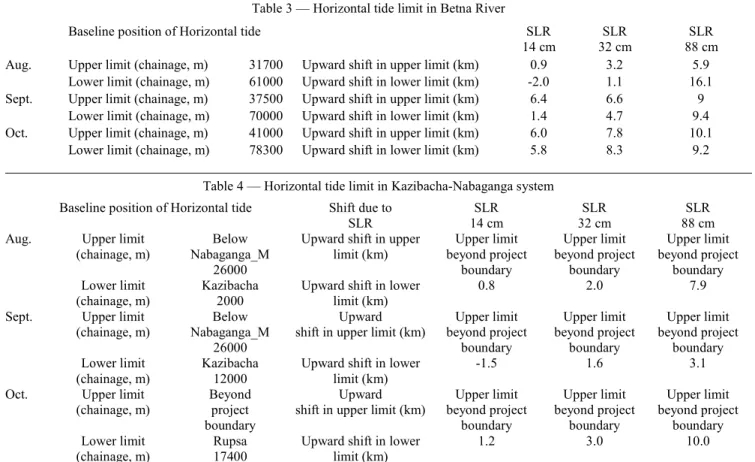
(7) FAKHRUDDIN et al.: .: SUSTAINABLE DEVELOPMENT FOR MANGROVE FORESTS. 1953. Fig. 3 — Changing pattern in distribution of Goran and Gewa from 1992 to 2004-05 05. the changes in tidal hydraulic condition. Velocity data generated by the hydrodynamic amic model for the base year condition and future sea-level level rise scenarios were used in a simple analytical framework to compute the present condition of sedimentation in rivers for the base year and then extended to predict the same for different sea-level rise scenarios. Flood tide velocity decreases from the sea end to upstream. At some inland location, the flood tide velocity becomes zero, which represents the ‘inland limit of horizontal tide’. It is this location where the sedimentation will be maximum as the flood tide velocity at this location is zero48-50. With an iincrease in sea-level level rise, the horizontal flood tide is expected to propagate further inland thus shifting the zone of movement upwards. In the analysis, the results of the hydrodynamic model runs for the three months from August to October for the base year ar 2000 and the three future sea-level level rise scenarios, viz. 14 cm in 2030, 32 cm in 2050 and 88 cm in 2100, were used to locate maximum sedimentation zone in the coastal river network. Figure 4a and 4b show the locations in the river network where the null points were found from August to September for the base year 2000.. Fig. 4 — (a) Locations of horizontal tide limits (b) zone of movement of horizontal tide limit. The major areas where sedimentation appears to be of concern are the Betna River and the KazibachaKazibacha Nabaganga system. Further results are shown in Table 3 and 4. As seen in Table 3, the location lo of maximum sedimentation zone in Betna river shifts upward by about 9-11 11 km for a sea level rise of 88 cm. This is quite significant and warrants appropriate attention from the river operational and maintenance point of view. The same is true for thee Kazibacha-Nabaganga Kazibacha.
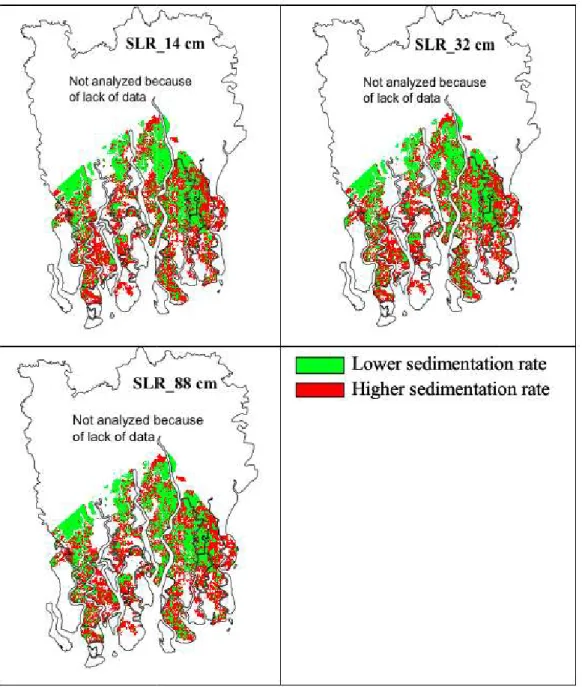
(8) 1954. INDIAN J. MAR. SCI., VOL. 47, NO. 10, OCTOBER 2018. Table 3 — Horizontal tide limit in Betna River Baseline position of Horizontal tide Aug. Sept. Oct.. Upper limit (chainage, m) Lower limit (chainage, m) Upper limit (chainage, m) Lower limit (chainage, m) Upper limit (chainage, m) Lower limit (chainage, m). 31700 61000 37500 70000 41000 78300. Upward shift in upper limit (km) Upward shift in lower limit (km) Upward shift in upper limit (km) Upward shift in lower limit (km) Upward shift in upper limit (km) Upward shift in lower limit (km). SLR 14 cm 0.9 -2.0 6.4 1.4 6.0 5.8. SLR 32 cm 3.2 1.1 6.6 4.7 7.8 8.3. SLR 88 cm 5.9 16.1 9 9.4 10.1 9.2. Table 4 — Horizontal tide limit in Kazibacha-Nabaganga system Baseline position of Horizontal tide Aug.. Sept.. Oct.. Upper limit (chainage, m) Lower limit (chainage, m) Upper limit (chainage, m) Lower limit (chainage, m) Upper limit (chainage, m) Lower limit (chainage, m). Below Nabaganga_M 26000 Kazibacha 2000 Below Nabaganga_M 26000 Kazibacha 12000 Beyond project boundary Rupsa 17400. Shift due to SLR Upward shift in upper limit (km) Upward shift in lower limit (km) Upward shift in upper limit (km) Upward shift in lower limit (km) Upward shift in upper limit (km) Upward shift in lower limit (km). system where the upward shifting of the lower limit of the maximum sedimentation zone was of the same order for the months of August and September. Considering all the uncertainties and complexities of the physical processes involved and insufficient observed data, an attempt was made to find an indicative answer to the problem of coastal floodplain sedimentation with increasing sea-level. Sediment supply to the tidal river system was considered to be coming from the sea end, as proposed by the FAP 4 study51-53, i.e., the fine sediments and silts originate from the Meghna discharge during the wet season and are carried westwards by near shore currents created by the northeast monsoon in the period from July to November. The basis of the analysis was a sediment mass balance approach that considers that it is a part of the sediment volume entering the system from the sea end that will be distributed over the tidal floodplains. Distribution of suspended sediment concentration along the rivers was estimated from field measurements at 15 locations within the project area in October 2001 (on a fixed day for each measurement) by IWM (2003ab). This is a data limitation since measurement was not done covering a. SLR 14 cm Upper limit beyond project boundary 0.8. SLR 32 cm Upper limit beyond project boundary 2.0. SLR 88 cm Upper limit beyond project boundary 7.9. Upper limit beyond project boundary -1.5. Upper limit beyond project boundary 1.6. Upper limit beyond project boundary 3.1. Upper limit beyond project boundary 1.2. Upper limit beyond project boundary 3.0. Upper limit beyond project boundary 10.0. spring-neap cycle. Inundation depth maps generated as a part of the project were used to calculate inundation volumes in all cells (50 m x 50 m). Sedimentation in individual cells was then calculated in proportion to inundation volume and suspended sediment concentration in that cell. It was assumed that suspended sediment concentration in rivers will remain the same in future. In each cell, the factor by which sedimentation rate increases or decreases due to sea-level rise compared to the base line condition (the year 2000) was then calculated. For all three sea-level rise scenarios (figure5), sedimentation rate increases in larger areas compared to areas where the rate goes down, as illustrated in Table 5. The decrease in sedimentation per year in some areas as shown in the table does not mean that there will not be any sedimentation. Sediments will keep accumulating with increasing sea level, but at a lower rate in those areas. Drainage and flooding There are 35 polders inside the study area covering an area of 4,760 km2. These polders are protected by about 2,060km either by embankments or natural elevated areas against flood and tidal surges..
(9) 1955. FAKHRUDDIN et al.: .: SUSTAINABLE DEVELOPMENT FOR MANGROVE FORESTS. Fig. 5 — Changes in ssedimentation rate due to SLR 14cm, 32 cm, and 88 cm. Hundreds of sluice/regulators have been constructed on the embankments mainly for draining rainwater and to obstruct the sea water from entering. The flooding and drainage situation for the base cond condition has been estimated based on the flood in 2000 using the Mike11 model results. The flooding area of three districts has been categorized in-depth depth classes as dry, 0-30cm, 30-90 cm, 90-180 180 cm, 180 180-300 cm and greater than 300 cm. Two scenarios, Sea Level Rise of 32 cm and 88 cm, are accounted to assess the impact of flooding and drainage.. Table 5 — Percentage change in sedimentation from base Scenario SLR 14 cm SLR 32 cm SLR 88 cm. Areas with increase in sedimentation. Areas with decrease in sedimentation. 62% 59% 55%. 38% 41% 45%. Hydrodynamic model results considering 32 cm sea level rise show that embankments of 4 polders will be submerged by over 10 cm water depth, and this number will increase to 13 polders with an 88 cm sea level rise. The polders that suffer.
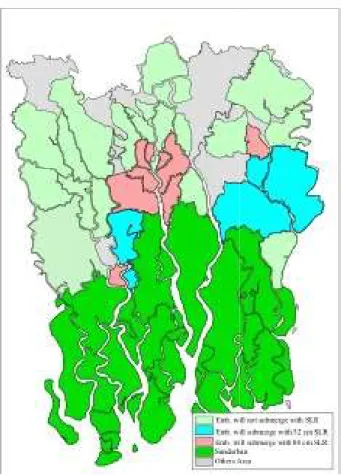
(10) 1956. INDIAN J. MAR. SCI., VOL. 47, NO. 10, OCTOBER 2018. Fig. 7 — Land distribution under different scenarios. Fig. 8 — (a) Salinity in base year (b) Salinity with SLR 32cm (c) Salinity with SLR 88cm. Fig. 6 — Polders affected by submergence. this submergence are shown in Figure 6 and 7 shows the difference in the size of flooded areas with SLR. Thee drainage of protected areas (polders) will be slowed down and as a consequence, the flooding will be elongated; this will have an adverse effect on cropping area and positive effect on the shrimp area since shrimps have saline tolerance limits54. Salinity The salinity of rivers in different locations was computed using the Hydrodynamic and Salinity model of IWM. The river salinity has been translated onto the flood plain using spatial analysis tool of GIS technologies. The base condition of salinity and the impact of a 32cm and 88cm SLR on salinity in the area are shown in Figure 8a, b, c. The low saline area (0 (0-1ppt) has decreased from 10.8% to 9.2% and 4.0% with SLR 32 cm and 88 cm respectively, spectively, whereas high saline area, i.e. 20-25 25 ppt has been increased from 12.6% to 15.7% and 17.9% with SLR 32 cm and 88 cm respectively.. Conclusion Mangrove forests play an important role in stabilizing coastlines and reducing the erosion of fertile soil. Sundarbans is the world’s largest mangrove forest and is situated on the coast of Bay of Bengal, extending from India into Bangladesh. Studies have shown that Sundarbans assists the local community in maintaining their livelihoods and acts as a barrier against floods and storms. Our results found that the Sundarbans mangrove mang forest is under threat due to Sea Level Rise (SLR). United Nations (UN) climate research has revealed that SLR in Bangladesh is expected to increase up to 1.5m by 2050. According to the UN Sustainability Development Goals (SDG) 13 and 15, sea-level sea rise due to climate change is a major concern and it should be combated since it affects mangrove forests and biodiversity. So, the proper sustainable management on mangrove forest is needed. This paper analyses techniques in remote sensing (RS) and spatial data in studying the effects of SLR in the Sundarbans mangrove forest. Its importance in restoring and protecting mangroves is reflected most clearly in SDG. Three parameters, including distribution of species, increases in sedimentation, salinity, and flooded oded areas were analysed using RS. Data acquired.
(11) FAKHRUDDIN et al.: SUSTAINABLE DEVELOPMENT FOR MANGROVE FORESTS. from Landsat TM and field investigations were used to map the forest distribution and MIKE21 and MIKE11 software used to simulate sea level rise scenarios. The analysis showed an increase in the prevalence of Goran (Ceriops) replacing other mangrove species. An increase in sedimentation within the Sundarbans is likely to increase with SLR, particularly in river floodplains and increase flood frequency. This will also have salinity intrusion impacts. This study concluded that integrated modelling, using remote sensing techniques and spatial datasets, could have a positive role in combating climate change impacts (SDG 13) and halting biodiversity loss (SDG 15). References 1. Agrawala S, Ota T, Ahmed AU, Smith J, Van Aalst M, Development and climate change in Bangladesh: focus on coastal flooding and the Sundarbans, OECOD Fr, (2003). 2 Al-Farouq, A, Huq S, Adaptation to climate change in the coastal resources sector of Bangladesh: Some issues and problems, Adapting to climate change. Springer New York, (1996), 335-342. 3 Alongi DM, The impact of climate change on mangrove forests, CurrClim Change Rep, (2015), 30–39. 4 Armentano, Thomas V, Park RA, Cloonan CL, Impacts on coastal wetlands throughout the United States, Greenhouse Effect Sea Level Rise and Coastal Wetlands, JG Titus ed, Washington, DC, US Environmental Protection Agency (1988), 87-128. 5 Banerjee K, Gatti RC, Mitra A, Climate change-induced salinity variation impacts on a stenoecious mangrove species in the Indian Sundarbans, Ambio, 46, (2017), 492–499. 6 BCAS-RA, Approtech, Vulnerability of Bangladesh to Climate Change and Sea Level Rise: Concepts and Tools for Calculating Risks in Integrated Coastal Zone Management, Bangladesh Centre for Advanced Studies (BCAS), Resource Analysis (RA) and Approtech Ltd,Dhaka, Bangladesh, (1994). 7 Bhuiyan, MdJabed Abdul Naser, Dushmanta Dutta, Analysis of flood vulnerability and assessment of the impacts in coastal zones of Bangladesh due to potential sea-level rise, Natural hazards, 61.2, (2012), 729-743. 8 Blankespoor B, Dasgupta S, Lange G-M, Mangroves as a protection from storm surges in a changing climate, Ambio. 46, (2017), 478–491. 9 CEGIS Final Report: Impact of Sea Level Rise on Land Use, Ministry of Ebvironment and Forest, Sustainable Environment Management Programme, Component 1.4.3, Dhaka (2005), 96. 10 Chaffey DR, Miller FR, Sandom JH, A forest inventory of the Sundarbans, Bangladesh. Main Report, Overseas Development Administration. England, 196. 11 Padmanaban R, Kumar R, Mapping and Analysis of Marine Pollution in Tuticorin Coastal Area Using Remote Sensing and GIS. Int. J. Adv. Remote Sens. GIS, 1, (2014), 34–48. 12 Chantarasri, Songklod, Integrated resource development of the Sundarbans Reserved Forest, Fisheries Resources Management for the Sundarbans Reserved Forest, UNDP/FAO, Khulna, Bangladesh (1994).. 1957. 13 Chow J, Mangrove Management for Climate Change Adaptation and Sustainable Development in Coastal Zones. J Sustain For (2017). 14 Copeland, BJ, Effects of decreased river flow on estuarine ecology, Journal (Water Pollution Control Federation, 1966,1831-1839. 15 Padmanaban R, Thomas V, Inventory of Liquefaction Area and Risk Assessment Region Using Remote Sensing. Int. J. Adv. Remote Sens. GIS, 2, (2013), 198–204. 16 Çulluma MA, Estimation of the effect of soil salinity on crop yield using remote sensing and geographic information system. Turk J Agric For. 27, (2013), 23–28. 17 Dasgupta S, Huq M, Mustafa MG, Sobhan I, Wheeler D, The impact of climate change and aquatic salinization on fish species and poor communities in the Bangladesh Sundarbans, World Bank Policy Res Work Pap, (2016)7593. 18 Ellison AM, Mukherjee BB, Karim, Testing patterns of zonation in mangroves: scale dependence and environmental correlates in the Sundarbans of Bangladesh. J Ecol, 88, (2000), 813–824. 19 Essink, Gualbert HP Oude, Salt water intrusion in a threedimensional groundwater system in the Netherlands: a numerical study, Transport in porous media, 43.1, (2001),137-158. 20 Farifteh J, Farshad A, George RJ, Assessing salt-affected soils using remote sensing, solute modelling, and geophysics. Geoderma, (2006), 130, 191–206. 21 Gommes R, du Guerny J, Nachtergaele F, Brinkman R, Potential Impacts of Sea-Level Rise on Populations and Agriculture, Food and Agriculture Organization of the United Nations, SD (Sustainable Development) Dimensions/ Special, (2000). 22 Giri C, Ochieng E, Tieszen LL, Zhu Z, Singh A, Loveland T, Masek J, Duke N, Status and distribution of mangrove forests of the world using earth observation satellite data, Glob EcolBiogeogr, 20, (2011),154–159. 23 Giri C, Pengra B, Zhu Z, Singh A, Tieszen LL, Monitoring mangrove forest dynamics of the Sundarbans in Bangladesh and India using multi-temporal satellite data from 1973 to 2000, Estuar Coast Shelf Sci, 73, (2007), 91–100. 24 Giri C, Zhu Z, Tieszen LL, Singh A, Gillette S, Kelmelis JA, Mangrove forest distributions and dynamics (1975–2005) of the tsunami-affected region of Asia. J Biogeogr 35, (2008), 519–528. 25 Gopal, Brij, Malavika Chauhan, Biodiversity and its conservation in the Sundarban Mangrove Ecosystem, Aquatic Sciences, 68.3, (2006),338-354. 26 Hoq ME, Wahab MA, Islam MN, Hydrographic status of Sundarbans mangrove, Bangladesh with special reference to post-larvae and juveniles fish and shrimp abundance. WetlEcolManag,14:79, (2014),93. 27 Halcrow and Others, Final Report of Southwest Area Water Resources Management Project, FAP-4, FPCO (presently WARPO), Dhaka (1993). 28 R.K. Pachauri and L.A. Meyer, IPCC: Climate Change 2014: Synthesis Report. Contribution of Working Groups I, II and III to the Fifth Assessment Report of the Intergovernmental Panel on Climate Change IPCC, Geneva, Switzerland, (2014), 151. 29 Ippen AT,Estuary and coastline hydrodynamics, (1966)..
(12) 1958. INDIAN J. MAR. SCI., VOL. 47, NO. 10, OCTOBER 2018. 30 Islam MR, Nandy P, Site suitability of different mangrove species and planting techniques for baen (Avicennia officinalis) in the coastal areas of Bangladesh." Mangrove Research and Development, Bangladesh Forest Research Institute, Chittagong (2001),39-48. 31 Islam SN, Gnauck A, Effects of salinity intrusion in mangrove wetlands ecosystems in the Sundarbans: an alternative approach for sustainable management, Wetlands: Monitoring Modelling and Management. Leiden: Taylor & Francis, 315-322, (2007). 32 Padmanaban R, Sudalaimuthu K, Marine Fishery Information System and Aquaculture Site Selection Using Remote Sensing and GIS, Int. J. Adv. Remote Sens. GIS, 1,(2012), 20–33. 33 IWM Sundarban Biodiversity Conservation Project: Surface Water Modeling, Final Report, Volume 1, (2003a). 34 IWM Sundarban Biodiversity Conservation Project: Surface Water Modelling, Final Report, Volume 4, (2003b). 35 Joshi H, Ghose M, Forest structure and species distribution along soil salinity and pH gradient in mangrove swamps of the Sundarbans, Tropical Ecology, 44.2,(2003),195-204. 36 Padmanaban R, Modelling the Transformation of Land use and Monitoring and Mapping of Environmental Impact with the help of Remote Sensing and GIS. Int. J. Adv. Altern. Energy Environ. Ecol, 1, (2012), 36–38. 37 Karim MF, Mimura N, Impacts of climate change and sea-level rise on cyclonic storm surge floods in Bangladesh. Global Environmental Change, 18.3,(2008), 490-500. 38 Karlen DL, Hurley EG, Andrews SS, Cambardella CA, Meek DW, Duffy MD, Mallarino AP, Crop rotation effects on soil quality at three northern corn/soybean belt locations. Agronomy journal, 98(3), (2006), 484-495. 39 Kearney MS, Stevenson JC, Sea Level Rise and Marsh Vertical Accretion Rates in Chesapeake Bay in Coastal Zone '85. New York: American Society of Civil Engineers (1985). 40 Liu S, Li X, Niu L, The degradation of soil fertility in pure larch plantations in the north eastern part of China, Ecological Engineering 10.1, (1998), 75-86. 41 Kilroy G, A review of the biophysical impacts of climate change in three hotspot regions in Africa and Asia, Reg Environ Change, 15, (2015), 771–782. 42 Metternicht GI, Zinck JA, Remote sensing of soil salinity: potentials and constraints, Remote Sens Environ, 85, (2003a), 1–20. 43 Metternicht GI, Zinck J, Remote sensing of soil salinity: potentials and constraints, Remote Sens Environ. 85, (2003b), 1–20. 44 Metternicht G, Assessing temporal and spatial changes of salinity using fuzzy logic, Remote Sensing, (2001), 45 Miyagi T ed, Mangrove habitat dynamics and sea-level change, Tohoku University, (1998). 46 MoEF, Integrated Forest Management Plan of Sundarbans, MoEF, Dhaka (1998). 47 Nandy P, Das S, Ghose M, Spooner-Hart R, Effects of salinity on photosynthesis, leaf anatomy, ion accumulation and photosynthetic nitrogen use efficiency in five Indian mangroves. Wetlands Ecology and Management, 15(4), (2007), 347-357. 48 Nicholls RJ, Leatherman SP, The potential impact of accelerated sea-level rise on developing countries. Journal of Coastal Research 14 (special issue) (1995).. 49 Overseas Development Administration (ODA), A forest inventory of the Sundarbans, Bangladesh (Forest types, 1: 50,000). Land Resources Development Centre, England, (1985). 50 Park RA, Armentano TV, Cloonan CL, Predicting the Effect of Sea Level Rise on Coastal Wetlands, Effects of Changes in Stratospheric Ozone and Global Climate Washington, D.C. Environmental Protection Agency and United Nations Environment Programme (1986). 51 Paul SK, Routray JK, Household response to cyclone and induced surge in coastal Bangladesh: coping strategies and explanatory variables, Natural Hazards 57.2, (2011), 477-499. 52 Rahman MM, Khan MNI, Hoque AF, Ahmed I. Carbon stock in the Sundarbans mangrove forest: spatial variations in vegetation types and salinity zones. Wetlands Ecology and Management, 23(2), (2015), 269-283. 53 Raha A, Das S, Banerjee K, Mitra A, Climate change impacts on Indian Sunderbans: a time series analysis, BiodiversConserv, 21, (2018), 1289–1307. 54 Ray R, Paul AK, Basu B, OIF Based Indeces Oriented Ecological Classification Using LANDSAT TM Digital Data–A Case Study on Beluchary and Dhulibasan Island Groups, Sunderban, West Bengal, India, Int J Remote Sens Appl, (2008), 4:56–60. 55 Padmanaban R, Integrating of Urban Growth Modelling and Utility Management System using Spatio Temporal Data Mining. Int. J. Adv. Earth Sci. Eng, (1), (2012),13–15. 56 Siddique NA, Mangrove Forestry in Bangladesh. Institute of Forestry and Environmental Sciences, University of Chittagong (2001). 57 Singh OP, Khan TMA, Rahman MS, The vulnerability assessment of the SAARC coastal region due to sea level rise: Bangladesh case, SMRC publication, Dhaka, Bangladesh, (2000), 108. 58 Ferdinent J, Padmanaban R, Development of a Methodology to Estimate Biomass from Tree Height Using Airborne Digital Image. Int. J. Adv. Remote Sens. GIS,(2), (2013), 49–58. 59 Titus JG, Planning for Sea Level Rise Before and After a Coastal Disaster, Barth and Titus (eds) (1984). 60 Titus JG, Greenhouse Effect, Sea Level Rise, and Coastal Zone Management, Coastal Management, Washington, D.C. Environmental Protection Agency14:3, (1986). 61 Monishiya, Padmanaban, Mapping and change detection analysis of marine resources in Tuicorin and Vembar group of Islands using remote sensing. Int. J. Adv. For. Sci. Manag, 1, (2012),1–16. 62 Titus JG, Greenhouse Effect, Sea Level Rise, and Coastal Wetlands, Washington, D.C. Environmental Protection Agency (1988). 63 Wahid SMd, Babel MS, Bhuiyan AR, Hydrologic monitoring and analysis in the Sundarbans mangrove ecosystem, Bangladesh, Journal of Hydrology, 332.3, (2007), 381-395. 64 The World Bank. http://www.worldbank.org/en/news/pressrelease/2013/06/19/warming-climate-to-hit-bangladesh-hardwith-sea-level-rise-more-floods-and-cyclones-world-bankreport-says, (2013). 65 Venkatesan G, Padmanaban R, Possibility Studies and Parameter Finding for Interlinking of Thamirabarani and Vaigai Rivers in Tamil Nadu, India. Int. J. Adv. Earth Sci. Eng,1 (2012), 16–26..
(13)
Imagem
+4
Documentos relacionados
Inicialmente foi realizado um levantamento bibliográfico com autores específicos como referências básicas na cartografia enquanto ciência (Jolly, 1990; Loch, 2006), Tonini et
As diferenças e assimetrias relacionadas com o género tornaram o presente tema um pertinente objetivo de estudo nas Ciências Sociais a partir do instante em que
ACCOUNTABILITY COMO INSTRUMENTO ATENUANTE DO CONFLITO DE AGÊNCIA EM INSTITUIÇÕES SEM FINS LUCRATIVOS
Vê-se que, nesta perspectiva, a accountability revela-se intimamente relacionada com o conflito de agência, ou melhor, age como instrumento redutor das assimetrias
The sea level time series analyzed in this study showed that the maximum amplitude of the high spring tide was 0.53m, and that the subtidal rise caused by the wind reached up
The objective of this work is to evaluate the extent of the impact of relative sea-level (RSL) rise during the early and middle Holocene and its subsequent fall during the
O objetivo desse artigo é calcular séries históricas de alíquotas tributárias macroeconômicas efetivas médias relacionadas ao consumo, à renda do trabalho e à renda do
dramatique de l’époque. la Mise en scène de Kéraban-le-têtu, Annexe 33, p.. 164 l’appropriation de la description et de la narration, à travers les didascalies qui
No seguimento de uma proposta de projeto para a conclusão de mestrado em Marketing e Promoção Turística pela Escola Superior de Turismo e Tecnologias do Mar, considerou-se a ideia
