Introduction
Fruits and vegetables have been used for centuries and our ancestors used them not only as food but also because of their medicinal properties (Caniço et al, 2005). In Portugal, fresh fruits and vegetables are used in conventional kitchen in many ways such as pies, soups, desserts and many others conven-ience foods (Guiné and Barroca, 2012). Among these products it is important to mention the Cucurbits family, which amongst others, includes pumpkin, melon, cucumber, watermelon and zucchini,. Pumpkin is commonly classifi ed as a vegetable (Guiné et al, 2011) and is originated from Latin America. It is more than 10 thousand years old and it was used by many civilizations such as the Aztecs, Incas and Mayans, and only later it was brought to Europe. Due to cross-pollination there are many kinds of pumpkins which can vary in terms of shape, colour and texture (Caniço et al, 2005), the main species being: Cucurbita maxima, Cucurbita moschata, Cucurbita pepo and Cucurbita mixta. Pumpkins are considered food products and their characteristics have changed during time. These products are very sensitive to microbial spoilage, and therefore it is nec-essary to dry or freeze them so that their shelf life could be expanded (Doymaz, 2007).
Drying is one of the most antique processes to preserve foods and it is consisted of removal of water from the food product up to a level at which microbial spoilage and deterio-ration reactions are highly minimized (Krokida et al, 2003). This is one of the storage processes which have the ability to extend the shelf life of foods, still trying to maintain part of their nutritional properties. The most common method used for the drying of foods is the convective air drying (Guiné and Barroca, 2012) and during this process foods may loose some nutrients, depending on drying conditions such as temperature or drying time.
Another preservation method is freeze drying, which im-plies freezing prior to sublimation of water. This method is of-ten used and very important to maintain and preserve the food product quality during storage and transportation, and increase its availability over the year. However, it also has disadvan-tages based on the fact that fruits and vegetables undergo some Corresponding author: [email protected]
SCIENTIFIC NOTE
Infl uence of Drying Treatment
on Physical Properties of Pumpkin
Francisca Henriques
1, Raquel P. F. Guiné
1*, Maria João Barroca
21CI&DETS, Polytechnic Institute of Viseu, ESAV, Quinta da Alagoa, Estrada de Nelas, Ranhados, 3500-606 Viseu, Portugal 2CERNAS-ESAV-IPC / Dep. of Chemical and Biological Engineering, ISEC-IPC,
Rua Pedro Nunes, Quinta da Nora, 3030-199 Coimbra, Portugal
Summary
The aim of this work was to evaluate the properties of pumpkin (Cucurbita maxima L.) exposed to convective air drying and freeze-drying. The samples were analyzed in terms of physical properties (colour and texture). The trials in the convective chamber were done at 40 ºC and 60 ºC, in the drying tunnel at 60 ºC and in the freeze dryer at -50 ºC. It was concluded that the freeze drying and the air drying at 40 ºC produced smaller changes in the colour while the drying in the tunnel originated more intense colour changes. With respect to texture, it was possible to deduce that the pulp in the fresh product at 2 cm off from the skin is harder than the pulp at 4 cm off from the skin. As to the effect of drying in the texture of the pumpkin, it was observed that all dryings affected texture considerably when compared to the fresh product. In fact, hardness varied from 75 % in the drying in chamber at 40 ºC to 90 % in the tunnel drying, when compared to the fresh product. As to springiness, it was changed more in the drying at 40 ºC, while cohesiveness showed the higher change in the freeze drying treatment.
Key words: Pumpkin, Drying, Freeze Drying, Colour, Texture.
reactions that cause changes in fl avour, colour, texture and nu-tritional value. Still, freeze dried foods also suffer a loss of tis-sue fi rmness (Hui, 2006). A great number of factors may affect the quality of vegetables at freezing, such as characteristics of the raw material (Genin and Rene, 1996), pre-treatments ap-plied before freezing or the freezing process itself (Sahari et al, 2004).
Colour and texture are amongst the most important at-tributes that infl uence the acceptability of foods product. In principal, the colour of a processed product should be as simi-lar as possible to that of the fresh product. Carotenoids are a group of compounds responsible for intensity of fruit and veg-etable colours such as orange, red and yellow. In the case of degradation, there is also the deterioration of colour, fl avour and nutritional value (Gonçalves et al, 2007). Another impor-tant attribute of food quality is texture, which can be defi ned as a manifestation of sensory and functional structure, mechani-cal properties and surface of foods detected through the senses (Hui, 2006; Gonçalves et al, 2007). By controlling the texture characteristics during drying, it is necessary to pay attention to changes in the product and the drying conditions. Instrumental Texture Profi le Analyses (TPA) allows measuring of the me-chanical properties of foods in an objective way, and obtained profi le can be used to estimate the textural attributes: hardness, adhesiveness, and chewiness (related to the elastic nature) and cohesiveness and springiness (related to the plastic nature) (Rahman and Al-Farsi, 2009).
The present work aims to compare the colour and texture of pumpkin in fresh and after drying, specifi cally freeze-dry-ing, convective air drying in tunnel and convective air drying in a chamber at different temperatures.
Materials and Methods
The pumpkin used in this work is Cucurbita maxima Duchesne ex Lam., var. Menina. The pumpkin was peeled and washed, and the skin and seeds were removed. The samples for drying were cut with the help of a circular tool into slices with approximately 4cm diameter and 1 cm thick.
For the convective drying, a chamber WTB (BINDER, Germany) with ventilation was used for the drying at operating temperatures of 40 ºC and 60 ºC, and with an air speed of 0.2 m/s. The drying tunnel used herein was a Tray Drier UOP-8 (Armfi eld, UK), and the experiment was done with a tempera-ture of approximately 60 ºC and an air velocity of 0.8 m/s. For these three trials the drying time was approximately 9, 6 and 4 hours, respectively. For the freeze drying a Freeze Dryer TDF 5505 (Uniequip, Germany) was used, and the samples were frozen in a conventional freezer and then left in the freeze drier for 96 hours at a temperature of about -50 ºC and a pressure of 0.7 Pa.
The CIELAB colour space system was used to measure colour in terms of the Cartesian colour coordinates: L*, a* and b*. L* stands for luminosity, and ranges between 0 and 100 (from black to white, respectively). The coordinates of oppos-ing colour are a*, that assumes negative values for green and positive for red; and b*, which is negative for blue and posi-tive for yellow (Kim and Lee, 2009). The colour of the fresh and dried samples was assessed using a handheld tristimulus colorimeter Chroma Meter CR-400 (Konica Minolta, Japan) calibrated with a white standard tile (CIE L* = 94.6, a* = −0.1 and b* = −0.6).
There are other more meaningful polar parameters which more closely match the human visual experience of colours than do the Cartesian parameters. These cylindrical coordinates are: chroma and hue angle, as given by Equations 1 and 2:
The Chroma represents the perceived strength of a surface colour and can be defi ned as the “colorfulness” of an object relative to the brightness of a white object similarly illumi-nated. The Hue is defi ned as the attribute of a visual sensation according to which an area appears to be similar to one of the perceived colours (red, yellow, green and blue) or a combina-tion of two of them.
The total colour change (ΔE*) was the parameter con-sidered for the overall colour difference evaluation, between a dried sample and the fresh fruit (designated with an index 0) in Equation 3:
The colour of the fresh samples was analyzed at two dif-ferent locations, 2 cm and 4 cm off from the skin, having been made 20 measurements for samples at each position, in total 40 measurements. For dried pumpkin 40 samples were analyzed for each drying treatment.
Texture Profi le Analysis (TPA) is a common test and it uses the principles of compression and it is an test that at-tempts to imitate the action of the jaw by compressing the sam-ple twice in a reciprocating motion, being for this reason often called the “Two Bite Test”. The force-time curve obtained al-lows the estimation of a number of textural parameters that are known to correlate well with sensory evaluation parameters. The texture of the fresh and dried samples was assessed us-ing a texture analyser TA.XT Plus (Stable Microsystems, UK) and the pulp of the pumpkin was analyzed. The TPAs were ob-tained by compression of the sample in two consecutive cycles between parallel plates using a probe of 75 mm diameter with
a 5 second interval between cycles. The load cell used was 5 kg and the test speed was 0.5 mm/s. The textural properties: Hard-ness, SpringiHard-ness, AdhesiveHard-ness, Cohesiveness and Chewiness were calculated after standard Equations:
Hardness (N) = F1 (4)
Springiness (%) = ∆T2/∆T1 × 100 (5)
Adhesiveness (N.s) = A3 (6)
Cohesiveness = A2/ A1 (7)
Chewiness (N) = F1 × ∆T2/∆T1 × A2/ A1 (8) where F1 is the force at the highest peak, A1 and A2 are the areas of the two positive peaks corresponding to the two com-pressions, A3 is the area of the negative peak, ΔT1 and ∆T2 are the time intervals between the start and the maximum point for each compression (Caine, 2003, Guiné and Barroca, 2012).
For texture analysis, the samples - small cylinders, and also in this case the fresh samples were analyzed at 2 cm and 4 cm off from the skin with 20 samples for each analysis, 40 samples in total. For the dried pumpkins 40 samples were ana-lyzed for each drying.
Statistical analysis
In order to compare results obtained for the properties in the different trials, statistical analyses were performed using the software STATISTICA, V6.1 from Satsoft. For this, the Tukey “Honestly Signifi cantly Different” (HSD) test was used with p < 0.05.
The Tukey HSD test proposed by the statistician John Tuk-ey is based on so called the “studentized range distribution.” It is a statistical test which can be empoloyed to fi nd out which means are signifi cantly different from each other, and consists in a single-step multiple comparison procedure, coupled to an Analysis of variance (ANOVA). The test identifi es where the difference between two means is greater than the standard error would be expected to allow. To test all pairwise comparisons among means using the Tukey HSD for equal sample sizes, it is calculated for each pair of means using the formula:
where (Mi - Mj) is the difference between the ith and jth means, MSE is the Mean Square Error, and nh is the harmonic mean of the sample sizes of groups i and j.
Results and Discussion
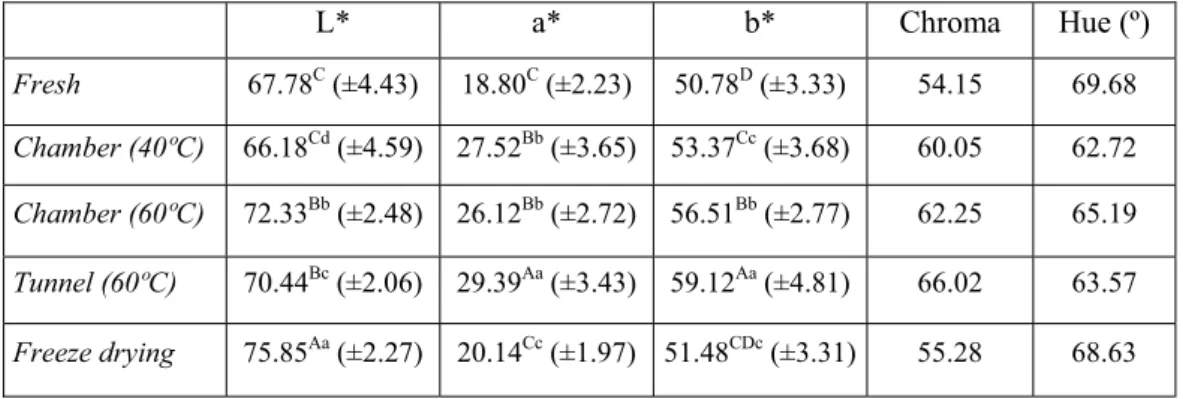
The average values calculated for the colour parameters for pumpkin in fresh, after drying in the chamber, in the tunnel and in the freeze drier are presented in Table 1, showing the Cartesian coordinates (L*a*b*) and the cylindrical coordinates (hue and chroma). As stated before, the L* stands for bright-ness, the a* for green-red balance, the b* for blue-yellow bal-ance, the hue represents a particular gradation of colour and the chroma is measure for the colour purity. The values found for the Cartesian coordinates for the fresh pumpkin were 67.78, 18.80 and 50.78 for L*, a* and b*, respectively, and for the cylindrical coordinates were 54.15 and 69.68 correspondingly for the chroma and the hue. Similar values were reported by Guiné and Barroca (2012) also for pumpkin (Cucurbita maxi-ma): 68.97 for the L*, 18.21 for the a*, 49.82 for the b*, 53.04 for the chroma and 69.92 for the hue angle.
(1) (b*) (a*) * Chroma = 2+ 2 (2) * a * b arctan * Hue ¸ ¹ · ¨ © § = (3) b*) -* (b a*) -* (a L*) -* (L * E 2 0 2 0 2 0 + + = Δ (9) h j i n MSE M -M t=
The air drying in the chamber at 40 ºC allowed obtaining a product more similar to the fresh sample when the lightness was considered, since L* varied only from 67.78 to 66.18. To verify if this decrease was meaningful, a statistical analysis was performed using the Tukey HSD test at a level of signifi cance of 5 %, and the results indicate that, in fact, these values are not statistically different. When comparing the values obtained for the opposing colour parameters between the fresh sample and the pumpkin dried at 40 ºC, the a* increased from 18.80 to 27.52, showing that the red colour was intensifi ed with dry-ing. As for the b*, it increased slightly, from 50.78 to 53.37, being the dried samples more yellow. These observations are corroborated by the increase in the value of the chroma, from 54.15 to 60.05. Furthermore, the statistical results revealed that these changes were statistically signifi cant. The drying at 60 ºC in the chamber turned the fi nal product much lighter, much more red and more yellow with the L*, a* and b* values of 72.33, 26.12 and 56.51, respectively. In literature values of the L*, a* and b* for pumpkin also dried in a chamber, although at different temperatures (30 ºC and 70 ºC) were reported by Guiné and Barroca (2012), being L* = 65.32, a* = 24.29, b* = 52.41 and L* = 63.39, a* = 28.01, b* = 57.27, respectively, for both temperatures used here. Based on the data obtained in the present work it was concluded that the results were following the same trend as those reported for other drying temperatures. As to the product dried in the tunnel, pumpkin became slightly lighter, much more red and more yellow (L* = 70.44, a* = 29.39 and b* = 59.12). In this case the chroma increased 22 % (from 54.15 to 66.02) thus resulting in an intensifi cation of the colour, while the hue changed from 69.68 to 63.57, thus cor-responding to a tonality change. The freeze drying induced the highest change in lightness, although the other two opposing colour parameters practically did not change in relation to the fresh product (L* = 75.85, a* = 20.14 and b* = 51.48). Also in this case the values were similar to those reported for freeze drying of pumpkin (L* = 77.70, a* = 15.25, b* = 41.44) (Guiné and Barroca, 2012), and it was concluded that the lightest dried pumpkin was obtained by the freeze drying method.
Furthermore, from the statistical analysis made to the mean values of the Cartesian colour coordinates in table 1, it was possible to conclude that, when comparing all the sam-ples, the fresh product and the different dried ones, L* was not different in fresh and in the chamber drying at 40 ºC, and the same occurred between the two convective dryings done at 60ºC. As to the colour parameter a*, the values obtained for the two dryings in the chamber at 40 ºC and at 60 ºC were not sta-tistically different. Finally, for the b*, the freeze dried pump-kin was not statistically different from the fresh sample and it was not different from the sample yielded after the drying at
40 ºC. A different approach was followed and another statisti-cal analysis was made aiming at comparing only the differ-ent dryings among each other, this time not including the fresh product, so as to perceive better possible differences among the tested treatments. In fact, in this last drying procedure the results were different, as expected, and for example, the L* is statistically different for all drying treatments, whereas in the previous analysis the L* was not statistically different. In fact, the comparison of the samples obtained after different drying procedures with the fresh product is quite different from the comparison of only the dried samples, because it was expected that the fresh product would be quite different from the dried ones.
The quantifi cation of the total colour difference (ΔE*), as calculated by Equation 3, allows a simple way of identify-ing the possible changes occurridentify-ing when comparidentify-ing one set of coordinates with the reference set, which in the present case was the fresh state. Figure 1 shows the values of colour differ-ence for the pumpkin samples after various dryings, and from the graph it can be observed that the lowest changes occurred in the freeze drying, followed by the drying in the chamber at the lowest temperature. Therefore, it appears that the most appropriate method for the drying of the pumpkin cylinders would be either the freeze drying or the drying in the chamber at 40 ºC, whereas the drying in the tunnel induced the high-est colour change. The difference observed in the two treat-ments done at 60 ºC could be due to the operating conditions in each case, since in the drying chamber the air velocity was only 0.2 m/s while in the tunnel the air velocity was 0.8 m/s. In fact, although the temperature was equal, the air renovation was higher in the last case, and oxidation would be expected to occur due to contact of the sample with the air oxygen, thus originating more intense colour changes.
Table 1. Colour parameters (mean and standard deviation)(1) for fresh and dried pumpkin.
(1)Means in the same column with different letters are statistically different (P < 0.05) by the Tukey HSD test with uppercase indicating comparison considering all samples (fresh and dried) and low-ercase indicating comparison considering just the dried samples (excluding fresh).
L* a* b* Chroma Hue (º) Fresh 67.78C (±4.43) 18.80C (±2.23) 50.78D (±3.33) 54.15 69.68 Chamber (40ºC) 66.18Cd (±4.59) 27.52Bb (±3.65) 53.37Cc (±3.68) 60.05 62.72 Chamber (60ºC) 72.33Bb (±2.48) 26.12Bb (±2.72) 56.51Bb (±2.77) 62.25 65.19 Tunnel (60ºC) 70.44Bc (±2.06) 29.39Aa (±3.43) 59.12Aa (±4.81) 66.02 63.57 Freeze drying 75.85Aa (±2.27) 20.14Cc (±1.97) 51.48CDc (±3.31) 55.28 68.63
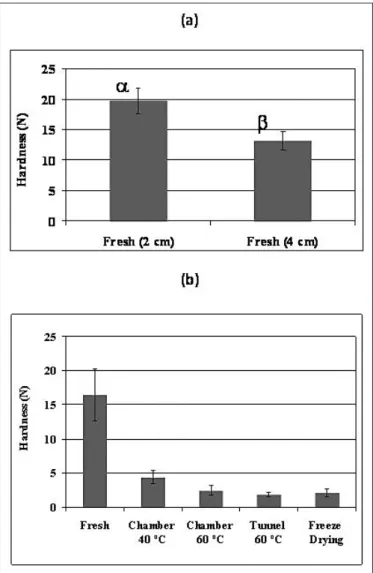
Figure 2 (a) presents the average values of hardness, calculated by Equation 4, for the pulp of fresh pumpkin at 2 cm and 4 cm off from the skin, and Figure 2 (b) shows the variation of the pulp’s hardness of the fresh and the dried sam-ples. The hardness represents the force required to deform the sample in mastication, and it is exerted by compressing the food between the teeth or between the tong and the mouth. The graph in Figure 2 (a) shows that the hardness of the pulp at 2 cm off from skin is higher than that measured at 4 cm off from skin, around 20 N and 13 N, respectively. This indicates that, as expected, the tissues of the pulp become softer as the distance from the skin increases. This trend was previously re-ported by Guiné and Barroca (2012) for samples measured at 1, 2 and 4 cm off from the skin, and by using two directions (axial and radial). In their work values of around 32 N at 1 cm of the skin, about 20 N at 3 cm of the skin and of 12 N at 4 cm of the skin were reported, and they are in accordance with those found in this work. From the results obtained in terms of variation in the hardness of the pulp from the fresh state to the various dried ones, presented in the graph in Figure 2(b), it was possible to verify that all drying treatments tested herein induced a very pronounced decrease in hardness. The drying in
the chamber at 40 ºC produced the least intense change in hard-ness, diminishing from around 16 N to 4 N, although it was a very important decrease, representing 75 % in relation to the value for the fresh pumpkin sample. The drying in the chamber at 60 ºC also produced a very intense reduction in the hardness to around 3 N, while for the other two methods (tunnel drying and freeze drying) the reduction was even higher to about 2 N. In literature results for the hardness of pulp of dried pumpkin are described for the drying in a chamber, being about 7 N, 2 N and 0.3 N, for the temperatures of 30 ºC, 50 ºC and 70 ºC, respectively, and also for the freeze drying, being around 1.5 N (Guiné and Barroca, 2012). These results indicate a clear diminishing of the hardness as the temperature increases, and the same trend was observed in the present study by compar-ing the two drycompar-ings in the chamber at different temperatures (40 ºC and 60 ºC). This reveals that the tissues become softer with drying, due to the intense evaporation of water, and there-fore loss of integrity of the sample. Besides, results reported in literature by Gonçalves et al. (2007) indicate that hardness of pumpkin decreased during blanching as process time and temperature were increased.
In Figure 3 (a) the mean values of springiness are pre-sented. The values were calculated by using the Equation 5, and results for the pulp of fresh pumpkin at 2 cm and 4 cm off from the skin were obtained, while the graph in Figure 3 (b) represents the mean values of the springiness for the pulp of fresh and dried pumpkin samples. The springiness meas-ures the degree of recovering shape after removal of the force that deformed the sample, and therefore is related to elasticity of the product. The results obtained for the springiness of the fresh pumpkin in the two positions analysed are very similar (around 70 % at 2 cm and 75 % at 4 cm off from the skin), as confi rmed by the statistical analysis, too, which revealed that they are not statistically different. In literature values for the springiness of pumpkin pulp were obtained after measure-ments made in axial direction, and according to distance from the skin were 72 %, 67 % and 68 %, respectively, for 1, 3 and 4 cm distance (Guiné and Barroca, 2012). The value obtained for 4 cm off from the skin of the pumpkin pulp in this work is higher (75 %) than the value reported in literature for the same position (68 %). From the results obtained in terms of fresh and dried pumpkin (Figure 3 (b)) it was possible to see that the value obtained for the drying in the chamber at 60 ºC was the one that was more similar to the fresh state (around 70 %), not being statistically different. Furthermore, it was observed that for the same drying method (chamber) the increase in tempera-ture from 40 ºC to 60 ºC induced an increase in the springi-ness from about 60 % to about 70 %. This can be due to the alterations in structure of the sample that can result from the degradation of polymeric carbohydrates. In literature (Guiné and Barroca, 2012) it was pointed out that the springiness of pumpkin pulp dried in convective chamber also increased with temperature increasing from 30 ºC to 70 ºC, being 48 % at 30 ºC, 64 % at 50 ºC and 65 % at 70 ºC. Regarding the drying in the tunnel at 60 ºC and the freeze drying, it was observed that after these two treatments the values for springiness were not statistically different. Furthermore, the value found for freeze drying in the present work, 65 %, is in accordance with that reported by Guiné and Barroca (2012).
The adhesiveness was calculated by using the Equation 6 and it represents the force required to remove the material that adheres to a surface like the tong, the teeth or the palate, being a measure of the material stickiness. The values found for the adhesiveness in all cases, either for the fresh pumpkin Figure 2. (a) Hardness of pumpkin in the fresh form (2 cm and 4 cm
off from the skin) and (b) Hardness of pumpkin after different drying treatments. Bars with different letters are statistically different (P < 0.05) by the Tukey HSD test with Greek letters applying to compari-son between different locations; uppercase indicating comparicompari-son considering fresh and dried states and lowercase indicating compari-son considering just the dried states (excluding fresh).
samples taken 2 and 4 cm off from the skin or for the samples obtained after different dried procedures, were approximately equal to zero (about -0.1 N.s), thus allowing us to conclude that this products does not show measurable adhesiveness. For this reason the corresponding graphs are not presented, taking in consideration the magnitude of the values at stake.
The cohesiveness accounts for the strength of the internal bonds and measures the degree of deformation before rupture when biting the food with the molars. From Figure 4 (a) it is possible to see that cohesiveness, calculated by using the Equa-tion 7, was slightly lower at 4 cm off from the skin (0,6) in relation to the value at 2 cm off from the skin (0,7). These values are a little higher than those reported in literature for cohesiveness of the pumpkin samples taken at 1, 3 and 4 cm off from the skin (Guiné and Barroca, 2012), which were around 0.5 in all cases. From the results shown in Figure 4 (b) it can be seen that cohesiveness did not change much with the dif-ferent drying treatments used, since the values were really not signifi cantly different, with one exception - the freeze dried pumpkin samples, which showed a reduction in the cohesive-ness. This reduction was expected, taking into account that this
drying method implies the loss of the water by sublimation, thus not originating the same kind of shrinking that was ob-served in all the other drying treatments, where the changes in volume are considerable as the water evaporates. As a conse-quence, the freeze dried pumpkin samples developed a highly porous structure, more fragile and therefore less cohesive then the other samples.
The chewiness is the work necessary to masticate the sample to a consistency suitable for swallowing, and was calculated by the Equation 8, which shows how strongly this property depended on the hardness of the samples. Figure 5 (a) reveals that the chewiness of the pumpkin pulp was much higher when the measurements were done by using samples taken at 2 cm off from the skin, which is in accordance with what was previously observed for the hardness in the Figure 5 (a). The chewiness was found to be 10 N and 6 N, respectively, for the samples taken at 2 cm and 4 cm off from the skin, being clearly higher than those reported in literature - 6 N for 3 cm Figure 3. (a) Springiness of pumpkin samples in the fresh form (2 cm
and 4 cm off from the skin) and (b) Springiness of pumpkin samples after different drying treatments. Bars with different letters are statis-tically different (P < 0.05) by the Tukey HSD test with Greek letters applying to comparison between different locations; uppercase indi-cating comparison considering fresh and dried states and lowercase indicating comparison considering just the dried states (excluding fresh).
Figure 4. (a) Cohesiveness of pumpkin samples in the fresh form (2
cm and 4 cm off from the skin) and (b) Cohesiveness of pumpkin sam-ples after different drying treatments. Bars with different letters are statistically different (P < 0.05) by the Tukey HSD test with Greek letters applying to comparison between different locations; uppercase indicating comparison considering fresh and dried states and lower-case indicating comparison considering just the dried states (exclud-ing fresh).
and about 4 N for 4 cm off from the skin (Guiné and Barroca, 2012). Again, the results shown in the graph of Figure 5 (b) for the different samples indicate that the hardness is of great im-portance for the determination of the effort necessary to apply and chew this food, since the trend described here is identical to that previously seen in Figure 2 (b).
Conclusions
The present work evaluates the effect of different drying treatments on colour and texture of pumpkin samples, which were dried using three different methods: convective air drying in chamber, convective air drying in tunnel and freeze-drying, and different operating conditions, namely temperature, in the case of the drying in the chamber.
The results obtained enable to conclude that the freeze drying was the treatment that originated the highest change
in lightness, although the other two opposing colour param-eters practically did not change in relation to the fresh sample. Therefore, in terms of total colour difference, the freeze dry-ing was the treatment that induced the smaller changes in the colour. The drying in the chamber at 40 ºC was the following in terms of less colour change, and the dryings at 60 ºC were those where the changes in colour were more intense.
With respect to the texture, it was observed that when in-creasing the distance from the skin the pulp of the fresh pump-kin become less hard and less cohesive, while the springiness stays unchanged. When comparing the effect of the drying on the texture it was concluded that the all drying procedures af-fected the texture to a high extent, while changes in the hard-ness were varying from 75 % in the drying in chamber at 40 ºC to 90 % in the tunnel drying. The springiness were affected more in the drying at 40 ºC, while the cohesiveness showed the higher change in the freeze drying treatment.
Literature
Caine W. R., Aalhus J. L., Best D.R., Dugan M. E. R., Jeremiah L. E. (2003) Relationship of texture profi le analysis and Warner-Bratzler shear force with sensory characteristics of beef rib steaks. Meat Science, 64, 333-339.
Caniço F., Ramalho M., Lima G., Quedas F. (2005) Estudo da evolução da textura e cor da Curcubita spp. na pós-colheita e ao longo do tempo. 7º Encontro da Química dos Alimentos, Portugal, Viseu, p. 2.
Doymaz I. (2007) The kinetics of forced convective air-drying of pumpkin slices. Journal of Food Engineering, 79, 243-248.
Genin N., Rene F. (1996) Infl uence of freezing rate and the ripeness state of fresh courgette on the quality of freeze-dried products and freeze-drying time. Journal of Food Engi-neering, 29, 201-209.
Gonçalves E. M., Pinheiro J., Abreu M., Brandão T. R. S., Silva C. L. M. (2007) Modelling the kinetics of peroxidase in-activation, colour and texture changes of pumpkin (Cucurbita maxima L.) during blanching. Journal of Food Engineering, 81, 693-701.
Guiné R. P. F., Barroca M. J. (2012) Effect of drying treat-ments on texture and color of vegetables (pumpkin and green pepper). Food and Bioproducts Processing, 90, 58-63.
Guiné R. P. F., Pinho S., Barroca M. J. (2011) Study of the convective drying of pumpkin (Cucurbita maxima). Food and Bioproducts Processing, 89, 422-428.
Hui Y. H. (2006) Handbook of Food Science, Technology and Engineering. Taylor & Francis Group, USA.
Kim B., Lee Y. (2009) Infl uence of the shade designation on the color difference between the same shade-designated res-in composites by the brand. Dental Materials, 25, 1148-1154.
Krokida M. K., Karathanos V. T., Maroulis Z. B., Ma-rinos-Kouris D. (2003) Drying kinetics of some vegetables. Journal of Food Engineering, 59, 391-403.
Rahman M. S., Al-Farsi A. (2009) Instrumental texture profi le analysis (TPA) of date fl esh as a function of moisture content. Journal of Food Engineering, 66, 505-511.
Sahari M. A., Boostani F. M., Hamidi E. Z. (2004) Effect of low temperature on the ascorbic acid content and quality characteristics of frozen strawberry. Food Chemistry, 86, 357-363.
Figure 5. (a) Chewiness of pumpkin samples in the fresh form (2 cm
and 4 cm off from the skin) and (b) Chewiness of pumpkin samples after different drying treatments. Bars with different letters are statis-tically different (P < 0.05) by the Tukey HSD test with Greek letters applying to comparison between different locations; uppercase indi-cating comparison considering fresh and dried states and lowercase indicating comparison considering just the dried states (excluding fresh).