Estimation in vivo of the body and carcass chemical composition
of growing lambs by real-time ultrasonography
1S. R. Silva
2, M. J. Gomes, A. Dias-da-Silva, L. F. Gil, and J. M. T. Azevedo
CECAV-Universidade de Tra´s-os-Montes e Alto Douro, Department of Animal Science, 5000-911 Vila Real, Portugal
ABSTRACT: The relationship between ultrasound measurements and empty body and carcass chemical composition was investigated. A 500-V real-time ultra-sound with a 7.5-MHz probe combined with image anal-ysis was used to make in vivo measurements to predict the empty body and carcass chemical composition of 31 female lambs of two genotypes, ranging in BW from 18.2 to 48.9 kg. Eleven ultrasound measurements of s.c. fat, muscle, and tissue depth were taken at four different sites (over the 13th thoracic vertebra, between the 3rd and 4th lumbar vertebrae, at the 3rd sternebra of the sternum, and over the 11th rib, 16 cm from the dorsal midline). The single best predictor of empty body fat quantity and energy value was the s.c. fat depth
over the 13th thoracic vertebra (r2= 0.904 and 0.912;
P< 0.01, respectively). Body weight was used with
ul-trasound measurements in multiple regression
equa-Key Words: Body Composition, Lambs, Real-Time Ultrasound
2005 American Society of Animal Science. All rights reserved. J. Anim. Sci. 2005. 83:350–357
Introduction
Accurate measurements of changes in body composi-tion and the energy content of live animals are key to understanding the response to the intake of nutrients. Classically, measurements have been done by direct or indirect calorimetry, comparative slaughter, or dilution techniques (McDonald et al., 2002). However, the devel-opment of reliable, noninvasive, and easily performed techniques in live animals, measuring traits with strong correlations to body composition are alternatives that should be encouraged. These techniques may also be used for other purposes, such as breeding, estimation of carcass composition before slaughter, reproductive
1This work received financial support from the FCT-Project
SAPI-ENS-POCTI/1999/CVT/36259, which we gratefully acknowledge.
2Correspondence: Apt 1013 (fax: 351 259350482; e-mail: ssilva@
utad.pt).
Received April 6, 2004. Accepted October 28, 2004.
350
tions to establish the best independent variables combi-nation for predicting chemical composition. Results showed that BW and two of the three ultrasound mea-surements (s.c. fat depth over the 13th thoracic verte-bra, between the 3rd and 4th lumbar vertebrae, and tissue depth over the 11th rib, 16 cm from the dorsal
midline), explained 94.7 to 98.7% (P< 0.01) of the
quan-tity of water and fat and the energy value variation in the empty body and carcass. Body weight per se was the best predictor of the quantity of protein, accounting
for 97.5 and 96.8% (P< 0.01) of the variation observed
in the empty body and carcass, respectively. The results of this study suggest that BW and some ultrasound measurements combined with image analysis, particu-larly subcutaneous fat depth over the 13th thoracic ver-tebra, allow accurate prediction of empty body and car-cass chemical composition in lambs.
physiology, and to support on-farm nutritional deci-sions (Wilson, 1992; Moeller, 2002).
Computer tomography and magnetic resonance im-aging are techniques that can successfully achieve these objectives. However, the initial price, operating costs, and lack of mobility of the equipment severely limit their utilization in animal science (Lawrence and Fowler, 2002).
Ultrasound techniques are alternatives that have been used in recent decades, mainly on live animals, for classification of carcasses, particularly in the swine industry (Moeller, 2002). Only a few studies dealing with ultrasound prediction of chemical composition and energy value of carcasses (Leymaster et al., 1985; Ram-sey et al., 1991) or empty body (Wright and Russel, 1984) have been performed. Recent advances in technol-ogy have made it possible to use real-time ultrasonogra-phy (RTU) for these purposes. This technology, associ-ated with image analysis, offers the possibility of achieving a degree of precision similar to that achieved with computer tomography or magnetic resonance im-aging in predicting body composition (Szabo et al., 1999).
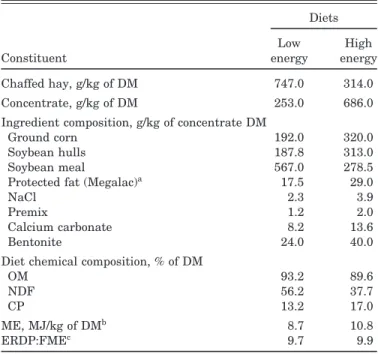
Table 1. Chemical composition and estimated energy and protein values of the experimental diets
Diets Low High
Constituent energy energy
Chaffed hay, g/kg of DM 747.0 314.0 Concentrate, g/kg of DM 253.0 686.0 Ingredient composition, g/kg of concentrate DM
Ground corn 192.0 320.0
Soybean hulls 187.8 313.0
Soybean meal 567.0 278.5
Protected fat (Megalac)a 17.5 29.0
NaCl 2.3 3.9
Premix 1.2 2.0
Calcium carbonate 8.2 13.6
Bentonite 24.0 40.0
Diet chemical composition, % of DM
OM 93.2 89.6
NDF 56.2 37.7
CP 13.2 17.0
ME, MJ/kg of DMb 8.7 10.8
ERDP:FMEc 9.7 9.9
aVolac, Int., Ltd., Hertfordshire, U.K.
bCalculated as ME = apparent DE (measured in digestion trials)
× 0.82 (Blaxter et al., 1966).
cRatio of effective rumen degradable protein (ERDP), calculated
from effective CP content of ingredients and N degradation parame-ters according to AFRC (1993) to fermentable ME (FME), calculated as FME = ME− MEfat(AFRC, 1993).
To assess the possibility of predicting whole body and carcass chemical composition of growing sheep using RTU, data were recorded from an experiment designed to evaluate the efficiency of energy utilization of two diets offered to two different genotypes of lambs.
Materials and Methods
Source of Data
Data were obtained from an experiment performed by Gomes (2001). Briefly, a growth trial was carried out using 25 female lambs from each of the breeds: the Iˆle de France and the native Portuguese breed, Churra da Terra Quente. Five lambs of each breed were slaugh-tered at the start of the experiment (initial slaughter group) when their BW was approximately 45% of their mature BW (45 and 76 kg for Churra da Terra Quente and Iˆle de France, respectively). The remaining lambs of each breed were assigned randomly to one of two dietary treatments: low- and high-energy diets that were initially formulated to provide 9 and 11.5 MJ of ME/kg of DM, respectively. Diets were balanced for effective rumen degradable protein (10 g/MJ of fer-mentable ME), according to the recommendations of AFRC (1993) for growth lambs. The actual composition, chemical analysis, and estimated energy and protein value of the diets are presented in Table 1.
Five lambs of each breed and dietary treatments were slaughtered when they reached 65% of their mature
BW. One Iˆle de France lamb fed the high-energy diet in a parallel digestion trial was also slaughtered. There-fore, a total of 31 animals were slaughtered (10 animals from the initial slaughter group plus 21 animals slaugh-tered at 65% of mature BW). Before ultrasound mea-surements and subsequent slaughter, the animals were shorn, deprived of food for 24 h, and weighed.
Ultrasound Measurements
Just before slaughter, animals were scanned with an Aloka SSD 500-V real-time scanner (Tokyo, Japan) using a 7.5-MHz linear probe (UST-5512U-7.5). The wool at each measurement point was clipped close to the skin and a gel was used as a coupling medium. The probes were placed perpendicular to the backbone over the 13th thoracic vertebra and between the 3rd and 4th lumbar vertebrae. The s.c. fat depth was measured over these points, with skin at the 13th thoracic vertebra and between the 3rd and 4th lumbar vertebrae or without (SC13 and SC34, respectively). Muscle depth and total tissue depth were also measured at these anatomical points. The muscle depth value was recorded as the greatest depth of the longissimus thoracis et lumborum muscle, and total tissue depth was considered as the depth from skin to the deepest border of the LM (TD13 and TD34). The s.c. fat depth and the tissue depth were measured at the 3rd sternebra of the sternum. The total tissue depth was also obtained over the 11th rib, 16 cm from the dorsal midline (TDtho).
Image Analysis
When a satisfactory image of the sites of measure-ment was obtained, it was captured on a video printer, digitized, and the measurements made by image analy-sis with National Institute of Health 1.57 software (http://rsb.info.nih.gov/nih-image/). All the scanning and interpretation was done by the same technician, who had considerable experience in ultrasound technol-ogy and interpretation of images and solid knowledge on the anatomy of species under study.
Slaughter Procedure and Sample Collection
After being stunned with a captive bolt gun, the ani-mals were slaughtered by severing the carotid arteries. The blood was collected in a tray, and the esophagus was tied off. The fore and hind limbs (feet) were then separated at the radio-carpal and tarso-metatarsal ar-ticulations, respectively. The pelt, head, and all internal organs were removed and individually weighed. The alimentary tract was weighed full, and then emptied and reweighed. All noncarcass body components (subse-quently referred to as offal) were then combined and
stored in plastic bags at−20°C until grinding. The
car-cass was stored at 4°C for 24 h, reweighed, and then
split down the vertebral column with a band saw, after which each side was weighed. The left half of the carcass
Frozen carcasses and offal were cut into small pieces with an electric band saw and immediately ground in a mill (Retsch SM 200, Haan, Germany) with a sieve plate having holes 8 mm in diameter. The mixture was then ground through another sieve plate with 4-mm holes. Milled carcasses were homogenized in an indus-trial mixer (Stef; Rimini, Italy). Two random samples of approximately 300 g were obtained, placed in a sealed
plastic box, and stored at −20°C for later chemical
analysis.
Chemical Analyses
Samples were analyzed in duplicate for moisture,
ash, and CP (N× 6.25) according to AOAC (1990). Lipid
analysis was performed by ether extraction in a Tecator Soxtec HT 1043 (Ho¨gana¨s, Sweden) according to the procedure described by Tecator (ASTN, 1998). The en-ergy value was determined by adiabatic bomb calorime-try (model 1241, Parr Instrument Co., Moline, IL).
Calculations
Weight loss during carcass storage was assumed to be a water loss. Carcass and offal composition (kg) was calculated from the respective weights and chemical composition assuming that the left and right halves of the carcasses had similar compositions. Weights of the empty body chemical components were calculated as the sum of carcass and offal components.
Statistical Analyses
Data from all 31 female lambs (16 Iˆle de France and 15 Churra da Terra Quente) were used as one large group for statistical analysis. To assess the accuracy of empty body and carcass chemical composition esti-mated by RTU, coefficients of determination and resid-ual standard deviation were calculated for single re-gression equations using the JMP-SAS statistical pack-age (Version 5.01; SAS Inst., Inc., Cary, NC). Multiple regression analyses were performed (SAS Version 8.2) to determine which combinations of in vivo ultrasound measurements and BW best predicted empty body and carcass chemical composition and energy value. The best-fitting regression equations were evaluated by the coefficients of determination, residual standard devia-tion, and Mallow’s statistic, which is used as a measure of bias (MacNeil, 1983).
Results and Discussion
Ultrasound Measurements and Chemical
Composition Data
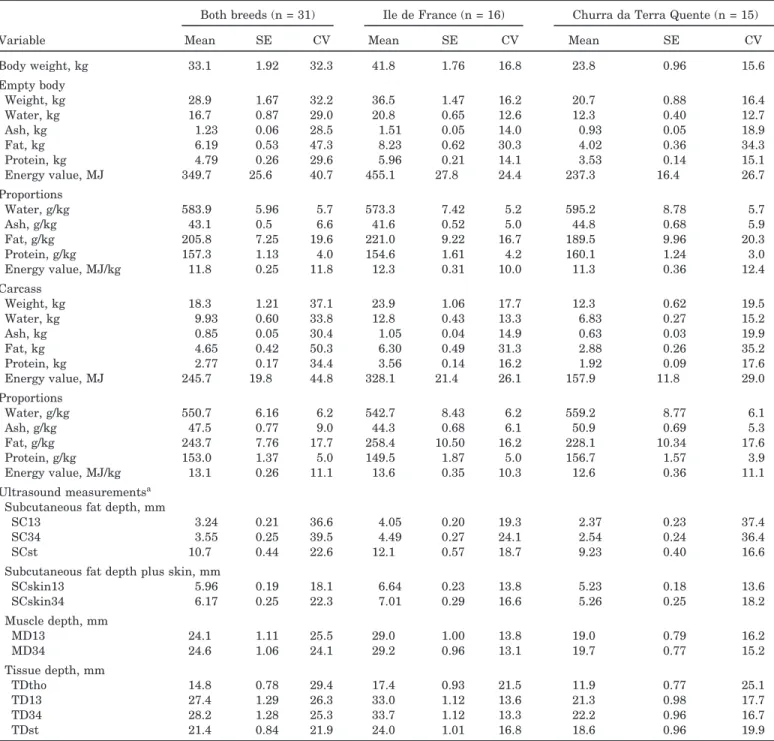
Table 2 shows that the lambs presented a large range of variation in BW and chemical composition. The range of variation in empty BW was 15.6 to 25.6 and 27.0 to 42.7 kg for Churra da Terra Quente and Iˆle de France, respectively (data not shown). The corresponding
val-ues for the carcasses were 8.5 to 15.7 and 17.2 to 28.8 kg, respectively (data not shown).
The variation of the gross chemical constituents ex-pressed as absolute amounts was high, particularly for fat. The energy value also varied greatly. This was ex-pected because variation in chemical composition be-tween the two genotypes at the same degree of maturity was also observed (Gomes, 2001). As animals reach maturity, the rate of fat retention increases, whereas that of protein decreases, and fat makes up most of the energy value. As expected, the CV of chemical constit-uents and energy value when expressed as proportions of BW were much lower because the conversion of these components to their proportions removes most of the variation caused by differences in weight (Dinkel et al., 1965).
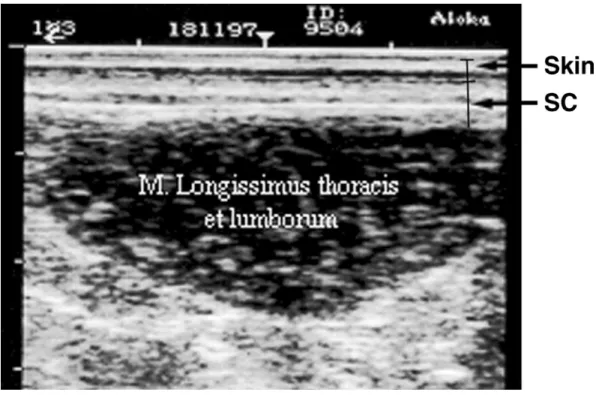
The data of ultrasound measurements are also pre-sented in Table 2. The variation is also large, particu-larly for SC13 and SC34 and TDtho. Although the abso-lute values of s.c. fat measurements were low, the ultra-sound equipment used was able to accurately measure these traits and therefore separate differences among animals. The image analysis, the skill and experience of the operator, and the 7.5-MHz probe used were able to give good images, as is shown in Figure 1. Previous work has shown that improvement in the predicting ability of RTU can be achieved by using high-frequency probes, better image analysis, or different sites for mea-surements (McLaren et al., 1991; Young and Deaker, 1994; Williams, 2002).
Estimates of Chemical Composition and Energy Value
of Empty Body and Carcass from Ultrasound
Measurements by Simple Regression
The ratios between individual energy values of the empty body or carcass measured by bomb calorimetry and individual energy values calculated from composi-tional data were very close to the unity; they ranged from 0.997 to 1.01 (Gomes, 2001; data not shown). In making these calculations, the energy value of body protein and fat were assumed to be 23.6 and 39.3 MJ/ kg, respectively, and 23.1 MJ/kg for OM free of fat.
The parameters of single linear relationships be-tween fat, muscle, and total tissue depth measured in live animals as described above, and the gross chemical constituents and energy value of the empty body and carcass, are presented in Tables 3 and 4. With one exception (TDtho, water in the empty body) all of the coefficients of determination were improved when pre-dicting the absolute amounts of chemical constituents or energy value than when these variables were pre-dicted as proportions of empty body (range of increase
in r2 = 0.024 to 0.472) or carcass (range of increase
in r2 = 0.057 to 0.497). As previously mentioned and
discussed by Dinkel et al. (1965), statistically, absolute values were favored. Also, in the context of studies planned to measure responses in body chemical compo-sition to nutrient intake, as was the case in the work
Table 2. Summary of data used to develop regression equations
Both breeds (n = 31) Ile de France (n = 16) Churra da Terra Quente (n = 15)
Variable Mean SE CV Mean SE CV Mean SE CV
Body weight, kg 33.1 1.92 32.3 41.8 1.76 16.8 23.8 0.96 15.6 Empty body Weight, kg 28.9 1.67 32.2 36.5 1.47 16.2 20.7 0.88 16.4 Water, kg 16.7 0.87 29.0 20.8 0.65 12.6 12.3 0.40 12.7 Ash, kg 1.23 0.06 28.5 1.51 0.05 14.0 0.93 0.05 18.9 Fat, kg 6.19 0.53 47.3 8.23 0.62 30.3 4.02 0.36 34.3 Protein, kg 4.79 0.26 29.6 5.96 0.21 14.1 3.53 0.14 15.1 Energy value, MJ 349.7 25.6 40.7 455.1 27.8 24.4 237.3 16.4 26.7 Proportions Water, g/kg 583.9 5.96 5.7 573.3 7.42 5.2 595.2 8.78 5.7 Ash, g/kg 43.1 0.5 6.6 41.6 0.52 5.0 44.8 0.68 5.9 Fat, g/kg 205.8 7.25 19.6 221.0 9.22 16.7 189.5 9.96 20.3 Protein, g/kg 157.3 1.13 4.0 154.6 1.61 4.2 160.1 1.24 3.0 Energy value, MJ/kg 11.8 0.25 11.8 12.3 0.31 10.0 11.3 0.36 12.4 Carcass Weight, kg 18.3 1.21 37.1 23.9 1.06 17.7 12.3 0.62 19.5 Water, kg 9.93 0.60 33.8 12.8 0.43 13.3 6.83 0.27 15.2 Ash, kg 0.85 0.05 30.4 1.05 0.04 14.9 0.63 0.03 19.9 Fat, kg 4.65 0.42 50.3 6.30 0.49 31.3 2.88 0.26 35.2 Protein, kg 2.77 0.17 34.4 3.56 0.14 16.2 1.92 0.09 17.6 Energy value, MJ 245.7 19.8 44.8 328.1 21.4 26.1 157.9 11.8 29.0 Proportions Water, g/kg 550.7 6.16 6.2 542.7 8.43 6.2 559.2 8.77 6.1 Ash, g/kg 47.5 0.77 9.0 44.3 0.68 6.1 50.9 0.69 5.3 Fat, g/kg 243.7 7.76 17.7 258.4 10.50 16.2 228.1 10.34 17.6 Protein, g/kg 153.0 1.37 5.0 149.5 1.87 5.0 156.7 1.57 3.9 Energy value, MJ/kg 13.1 0.26 11.1 13.6 0.35 10.3 12.6 0.36 11.1 Ultrasound measurementsa
Subcutaneous fat depth, mm
SC13 3.24 0.21 36.6 4.05 0.20 19.3 2.37 0.23 37.4
SC34 3.55 0.25 39.5 4.49 0.27 24.1 2.54 0.24 36.4
SCst 10.7 0.44 22.6 12.1 0.57 18.7 9.23 0.40 16.6
Subcutaneous fat depth plus skin, mm
SCskin13 5.96 0.19 18.1 6.64 0.23 13.8 5.23 0.18 13.6 SCskin34 6.17 0.25 22.3 7.01 0.29 16.6 5.26 0.25 18.2 Muscle depth, mm MD13 24.1 1.11 25.5 29.0 1.00 13.8 19.0 0.79 16.2 MD34 24.6 1.06 24.1 29.2 0.96 13.1 19.7 0.77 15.2 Tissue depth, mm TDtho 14.8 0.78 29.4 17.4 0.93 21.5 11.9 0.77 25.1 TD13 27.4 1.29 26.3 33.0 1.12 13.6 21.3 0.98 17.7 TD34 28.2 1.28 25.3 33.7 1.12 13.3 22.2 0.96 16.7 TDst 21.4 0.84 21.9 24.0 1.01 16.8 18.6 0.96 19.9
aUltrasound measurements: SC13 = s.c. fat depth over the 13th thoracic vertebra; SC34 = s.c. fat depth between the 3rd and 4th lumbar
vertebrae; SCst = s.c. fat depth at the 3rd sternebra of the breast bone; SCskin13 = s.c. fat depth over the 13th thoracic vertebra plus skin; SCskin34 = s.c. fat depth between the 3rd and 4th lumbar vertebrae plus skin; MD13 = muscle depth over the 13th thoracic vertebra; MD34 = muscle depth between the 3rd and 4th lumbar vertebrae; TD13 = total tissue depth over the 13th thoracic vertebra; TD34 = total tissue depth between the 3rd and 4th lumbar vertebrae; TDst = total tissue depth at the 3rd sternebra of the breast bone; and TDtho = tissue depth over the 11th rib 16 cm from the dorsal midline.
of Gomes (2001), total quantities also are more mean-ingful.
Using SC13 as single independent variable explained 90% or more of the total quantity of chemical fat or the energy value of the empty body or carcass (Tables 3 and 4). This suggests that, at least for the range of BW covered by the study, SC13 mirrored changes in noncarcass fat, particularly the internal fat deposits. In the case of the quantity of protein, TD13 accounted
for the greatest proportion of the variance (r2= 0.847
and 0.844 for the empty body and carcass, respectively). However, the SC13 measurement allowed us to predict the amount of protein both in the empty body and
car-cass (r2= 0.822 and 0.831, respectively). Other authors
have found in growing lambs that this measurement has potential as an estimator of carcass protein (Ram-sey et al., 1991), the predictions often being better than those obtained from muscle depth (Chadwick et al.,
Figure 1. Ultrasonogram between the 3rd and 4th lumbar vertebrae showing skin, subcutaneous fat (SC), and longissimus thoracis et lumborum muscle.
1993). Whether the same is true when an animal reaches physiological maturity and fat deposition con-tinues, while muscle mass accretion slows down, re-mains to be proved.
Ultrasound measurements at the 13th thoracic verte-bra level have been used both in cattle and sheep be-cause this position can be clearly identified and such measurements are valuable for evaluating carcass quality (McEwan et al., 1989; Young and Deaker, 1994; Suguisawa, 2002) or predicting the quantity of chemical fat in the empty body of sows (King et al., 1986; Dour-mad et al., 1997). However, the correlations between ultrasound measurements at the 13th thoracic vertebra and carcass fat have quite often been poorer than those obtained in our study. In an earlier report, Leymaster et al. (1985), using a Scanogram with a 2-MHz probe, found that the correlation between predicted and ob-served chemical composition of sheep was less than 0.6 using the independent variable above mentioned. McEwan et al. (1989), using a 3-MHz probe, and Young and Deaker (1994), using a 5-MHz probe and the same equipment (Aloka 210DX), reported coefficients of de-termination of 0.64 and 0.58, respectively, for the rela-tionship between ultrasound measurements at the 13th thoracic vertebra and carcass fat. The better results we achieved can be explained by the utilization of a high-frequency probe (7.5 MHz) and by the improved image resolution (0.2 mm), which is capable of detecting differ-ences in s.c. fat depth between animals that characteris-tically have low values for this trait, as is the case with sheep. As reported by Young et al. (1992), s.c. fat depth has improved repeatability when an image analysis
sys-tem is used rather than measurements made directly from ultrasound monitors, which is explained by the small size of the monitors and the low resolution of the
measurements (±1 mm) compared with those of the
image analysis system (±0.1 mm).
On the whole, the prediction of body chemical compo-sition obtained in this study from single traits mea-sured in live animals is better than others previously reported in sheep and discussed earlier in this article. Although it is well known that differences in an opera-tor’s expertise may contribute greatly to the variation of measurements in cattle, sheep, and pigs (McLaren et al., 1991), advances in the ultrasound technology used here have contributed to the improvements ob-served in this study.
Estimates of Chemical Composition and Energy
Value of Empty Body and Carcass from Ultrasound
Measurements and Body Weight
by Multiple Regression
Because the principal determinant of the composition of gains made by growing animals, and hence of the chemical composition and the energy value of the whole body or carcass, is their BW (Reid, 1968), this indepen-dent variable was tested both alone and with ultra-sound measurements in multiple regression equations to assess the extent of improvement that could be achieved in prediction accuracy. Table 5 shows the best equations obtained.
Apart from the prediction of the amount and propor-tion of protein in the empty body and carcass, the
simul-Table 3. Coefficients of determination and residual standard deviations of the prediction equations for water, fat, protein, and energy value of empty body composition from ultrasound measurements Ultrasound measurements a Variable SC13 b SC34 b SCst b SCskin13 b SCskin34 b MD13 b MD34 b TDtho b TD13 b TD34 b TDst b Water, g/kg 0.687 (18 .9) 0.566 (22 .3) 0.463 (24 .7) 0.490 (24 .1) 0.650 (20 .0) 0.416 (25 .8) 0.384 (26 .5) 0.602 (21 .3) 0.474 (24 .5) 0.441 (25 .3) 0.448 (25 .1) Water, kg 0.777 (2 .31) 0.725 (2 .57) 0.554 (3 .28) 0.681 (2 .77) 0.674 (2 .80) 0.798 (2 .21) 0.782 (2 .29) 0.602 (3 .09) 0.828 (2 .04) 0.817 (2 .10) 0.605 (3 .08) Fat, g/kg 0.715 (21 .92) 0.587 (26 .40) 0.516 (28 .58) 0.549 (27 .58) 0.713 (22 .00) 0.457 (30 .26) 0.420 (31 .27) 0.626 (25 .12) 0.515 (28 .60) 0.477 (29 .71) 0.478 (29 .68) Fat, kg 0.904 (0 .92) 0.809 (1 .30) 0.652 (1 .76) 0.779 (1 .40) 0.860 (1 .11) 0.776 (1 .41) 0.751 (1 .49) 0.774 (1 .42) 0.829 (1 .23) 0.808 (1 .31) 0.648 (1 .77) Protein, g/kg 0.509 (4 .46) 0.434 (4 .79) 0.481 (4 .59) 0.453 (4 .71) 0.646 (3 .79) 0.380 (5 .01) 0.325 (5 .23) 0.422 (4 .84) 0.416 (4 .90) 0.365 (5 .08) 0.397 (4 .95) Protein, kg 0.822 (0 .61) 0.765 (0 .70) 0.568 (0 .95) 0.703 (0 .79) 0.702 (0 .79) 0.811 (0 .63) 0.795 (0 .65) 0.652 (0 .85) 0.847 (0 .56) 0.837 (0 .58) 0.628 (0 .88) Energy value, MJ/kg 0.699 (0 .78) 0.582 (0 .92) 0.485 (1 .02) 0.508 (0 .99) 0.687 (0 .79) 0.438 (1 .06) 0.402 (1 .10) 0.620 (0 .87) 0.496 (1 .01) 0.459 (1 .04) 0.468 (1 .03) Energy value, MJ 0.912 (42 .9) 0.827 (60 .2) 0.648 (86 .0) 0.779 (68 .1) 0.848 (56 .4) 0.809 (63 .4) 0.784 (67 .3) 0.770 (69 .5) 0.859 (54 .3) 0.840 (58 .0) 0.667 (83 .6) aValues given in brackets are residual standard deviations. bUltrasound measurements: SC13 = s.c. fat depth over the 13th thoracic vertebra; SC34 = s.c. fat depth between the 3rd and 4th lumbar vertebrae; SCst = s. c. fat depth at the 3rd sternebra of the breast bone; SCskin13 = s.c. fat depth over the 13th thoracic vertebra plus skin; SCskin34 = s.c. fat depth between the 3rd and 4th lumbar vertebra e plus skin; MD13 = muscle depth over the 13th thoracic vertebra; MD34 = muscle depth between the 3rd and 4th lumbar vertebrae; TD13 = total tissue depth over the 13th thoracic vertebra ; TD34 = total tissue depth between the 3rd and 4th lumbar vertebrae; TDst = total tissue depth at the 3rd sternebra of the breast bone; and TDtho = tissue depth over the 11th rib 16 cm from the dorsal midline. Table 4. Coefficients of determination and residual standard deviations of the prediction equations for water, fat, protein, and energy value of carcass composition from ultrasound measurements Ultrasound measurements a Variable SC13 b SC34 b SCst b SCskin13 b SCskin34 b MD13 b MD34 b TDtho b TD13 b TD34 b TDst b Water, g/kg 0.601 (22 .0) 0.503 (24 .6) 0.425 (26 .5) 0.423 (26 .5) 0.589 (22 .4) 0.322 (28 .7) 0.292 (29 .4) 0.547 (23 .5) 0.377 (27 .5) 0.347 (28 .2) 0.384 (27 .4) Water, kg 0.789 (1 .57) 0.730 (1 .78) 0.564 (2 .26) 0.680 (1 .93) 0.674 (1 .95) 0.812 (1 .48) 0.789 (1 .57) 0.604 (2 .15) 0.842 (1 .36) 0.824 (1 .43) 0.610 (2 .13) Fat, g/kg 0.665 (25 .4) 0.549 (29 .5) 0.504 (31 .0) 0.498 (31 .2) 0.670 (25 .2) 0.407 (33 .8) 0.367 (35 .0) 0.597 (27 .9) 0.463 (32 .2) 0.423 (33 .4) 0.443 (32 .8) Fat, kg 0.900 (0 .76) 0.811 (1 .03) 0.663 (1 .38) 0.767 (1 .15) 0.850 (0 .92) 0.778 (1 .12) 0.747 (1 .19) 0.771 (1 .14) 0.830 (0 .98) 0.805 (1 .05) 0.643 (1 .42) Protein, g/kg 0.456 (5 .74) 0.384 (6 .11) 0.447 (5 .79) 0.372 (6 .17) 0.526 (5 .36) 0.388 (6 .09) 0.327 (6 .39) 0.389 (6 .08) 0.415 (5 .95) 0.357 (6 .24) 0.368 (6 .18) Protein, kg 0.831 (0 .40) 0.772 (0 .46) 0.574 (0 .63) 0.711 (0 .52) 0.710 (0 .52) 0.807 (0 .43) 0.786 (0 .45) 0.657 (0 .57) 0.844 (0 .38) 0.830 (0 .40) 0.625 (0 .59) Energy value, MJ/kg 0.639 (0 .89) 0.544 (1 .00) 0.465 (1 .08) 0.450 (1 .10) 0.639 (0 .89) 0.378 (1 .17) 0.341 (1 .20) 0.589 (0 .95) 0.433 (1 .11) 0.398 (1 .15) 0.430 (1 .12) Energy value, MJ 0.907 (34 .2) 0.829 (46 .2) 0.654 (65 .8) 0.768 (53 .9) 0.841 (44 .7) 0.806 (49 .3) 0.776 (52 .9) 0.767 (54 .0) 0.856 (42 .5) 0.833 (45 .7) 0.661 (65 .2) aValues given in brackets are residual standard deviation. bUltrasound measurements: SC13 = s.c. fat depth over the 13th thoracic vertebra; SC34 = s.c. fat depth between the 3rd and 4th lumbar vertebrae; SCst = s. c. fat depth at the 3rd sternebra of the breast bone; SCskin13 = s.c. fat depth over the 13th thoracic vertebra plus skin; SCskin34 = s.c. fat depth between the 3rd and 4th lumbar vertebra e plus skin; MD13 = muscle depth over the 13th thoracic vertebra; MD34 = muscle depth between the 3rd and 4th lumbar vertebrae; TD13 = total tissue depth over the 13th thoracic vertebra ; TD34 = total tissue depth between the 3rd and 4th lumbar vertebrae; TDst = total tissue depth at the 3rd sternebra of the breast bone; and TDtho = tissue depth over the 11th rib 16 cm from the dorsal midline.
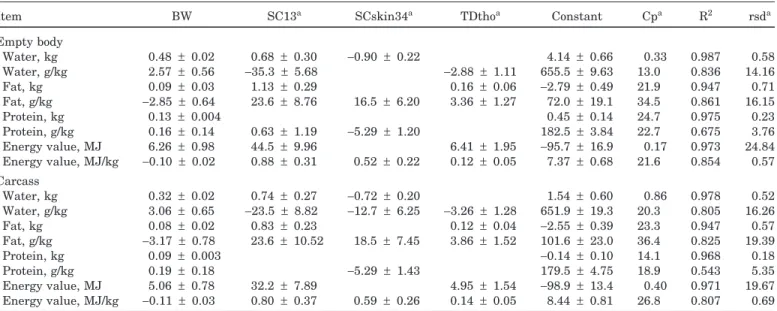
Table 5. Coefficients (±SE) for equations accounting for the highest significant improvement of fit in predicting weights
of water, fat, protein, and their proportions and energy value of empty body and carcass
Item BW SC13a SCskin34a TDthoa Constant Cpa R2 rsda
Empty body Water, kg 0.48 ± 0.02 0.68 ± 0.30 −0.90 ± 0.22 4.14 ± 0.66 0.33 0.987 0.58 Water, g/kg 2.57 ± 0.56 −35.3 ± 5.68 −2.88 ± 1.11 655.5 ± 9.63 13.0 0.836 14.16 Fat, kg 0.09 ± 0.03 1.13 ± 0.29 0.16 ± 0.06 −2.79 ± 0.49 21.9 0.947 0.71 Fat, g/kg −2.85 ± 0.64 23.6 ± 8.76 16.5 ± 6.20 3.36 ± 1.27 72.0 ± 19.1 34.5 0.861 16.15 Protein, kg 0.13 ± 0.004 0.45 ± 0.14 24.7 0.975 0.23 Protein, g/kg 0.16 ± 0.14 0.63 ± 1.19 −5.29 ± 1.20 182.5 ± 3.84 22.7 0.675 3.76 Energy value, MJ 6.26 ± 0.98 44.5 ± 9.96 6.41 ± 1.95 −95.7 ± 16.9 0.17 0.973 24.84 Energy value, MJ/kg −0.10 ± 0.02 0.88 ± 0.31 0.52 ± 0.22 0.12 ± 0.05 7.37 ± 0.68 21.6 0.854 0.57 Carcass Water, kg 0.32 ± 0.02 0.74 ± 0.27 −0.72 ± 0.20 1.54 ± 0.60 0.86 0.978 0.52 Water, g/kg 3.06 ± 0.65 −23.5 ± 8.82 −12.7 ± 6.25 −3.26 ± 1.28 651.9 ± 19.3 20.3 0.805 16.26 Fat, kg 0.08 ± 0.02 0.83 ± 0.23 0.12 ± 0.04 −2.55 ± 0.39 23.3 0.947 0.57 Fat, g/kg −3.17 ± 0.78 23.6 ± 10.52 18.5 ± 7.45 3.86 ± 1.52 101.6 ± 23.0 36.4 0.825 19.39 Protein, kg 0.09 ± 0.003 −0.14 ± 0.10 14.1 0.968 0.18 Protein, g/kg 0.19 ± 0.18 −5.29 ± 1.43 179.5 ± 4.75 18.9 0.543 5.35 Energy value, MJ 5.06 ± 0.78 32.2 ± 7.89 4.95 ± 1.54 −98.9 ± 13.4 0.40 0.971 19.67 Energy value, MJ/kg −0.11 ± 0.03 0.80 ± 0.37 0.59 ± 0.26 0.14 ± 0.05 8.44 ± 0.81 26.8 0.807 0.69
aSC13 = s.c. fat depth over the 13th thoracic vertebra; SCskin34 = s.c. fat depth between the 3rd and 4th lumbar vertebrae plus skin;
TDtho = tissue depth over the 11th rib, 16 cm from the dorsal midline; Cp = Mallow’s statistic; rsd = residual standard deviation.
taneous utilization of some ultrasound measurements in vivo and BW as independent variables considerably improved the accuracy of predictions. This was particu-larly noticeable when chemical components or energy value were expressed as proportions, although the coef-ficients of determination of the equations predicting the absolute amounts always remained higher and ac-counted for 95% or more of the variation observed. Wishmeyer et al. (1996) also found that BW improved the prediction of chemical composition of live lambs compared with body geometric measures or electromag-netic scan readings.
As expected from the single linear equations pre-viously obtained, SC13 was the most reliable indepen-dent variable from ultrasound measurements; it was included in all but four (quantity and proportion of protein in the empty body and carcass) of the multiple regression equations. Of the 11 original ultrasound measurements, eight of them (SC34, s.c. fat depth at the 3rd stenebra, s.c. fat depth measured with skin at the 13th thoracic vertabra, muscle depth at the longissi-mus thoracis et lumborum longissi-muscle, TD13, TD34, and tissue depth at the 3rd stenebra) could be eliminated because they did not add to the accuracy of predictions of chemical components or energy value. This decreased number of ultrasound measurements in equations is desirable as it makes the models more practical and ap-plicable.
The consequences of fewer ultrasound measurements were investigated. For the quantity of water in the empty body and carcass, the percentage of variance explained fell to 0.3 and 0.6%, respectively, when SCskin34 was removed. Also, for the quantity of fat in the empty body and carcass, TDtho could be eliminated with a negligible reduction of 0.7 and 0.6%, respectively,
in the R2value.
Live weight per se was the best predictor of the abso-lute quantity of protein, accounting for 97.5 and 96.8% of the variation observed in the empty body and in the carcass, respectively. Taking into account that for the same BW, within a species, sex, and genotype, the vari-ation in the quantity of water and protein is lower or much lower than that of fat, this should be considered as an expected finding. The same did not occur when
BW was used to predict fat quantity (r2 = 0.771 and
0.774 for the empty body and carcass, respectively; data not shown). De Campaneere et al. (2000) found that BW was the best estimator of the total amount of protein (r = 0.99; CV = 2.9%) in Belgian Blue bulls rather than creatinine, either in blood or in urine.
Implications
The results of this study strongly suggest that body chemical composition and the retained energy of grow-ing lambs can be predicted by body weight and real-time ultrasonography measurements associated with image analysis. Of the ultrasound measurements, the subcutaneous fat depth at the level of the 13th thoracic vertebra was the most powerful estimator. The use of this noninvasive technique provides a valuable tool both for research into nutrition and breeding and for commercial production. In addition, this equipment is portable, robust, relatively inexpensive, and easy to op-erate. It can be expected that advances in the technol-ogy, such as more refined probes, improved resolution, and color imaging capabilities, will expand both re-search and commercial applications. Further investiga-tion is needed to examine the applicainvestiga-tion of the tech-nique to measure changes in body composition and the energy content of lactating animals or of animals faced with seasonal variations in feed availability.
Literature Cited
AFRC. 1993. Energy and protein requirements of ruminants. An Advisory Manual Prepared by the Agricultural and Food Re-search Council’s Technical Committee on Responses to Nutri-ents. CAB Int., Wallingford, U.K.
AOAC. 1990. Official Methods of Analysis. 14th ed., Assoc. Off. Anal. Chem., Washington, DC.
ASTN. 1988. Total fat extraction in certain food products according to AOAC. Application Short Note. Tecator, Ho¨gana¨s, Sweden. Blaxter, K. L., J. L. Clapperton, and A. K. Martin. 1966. The heat
of combustion of urine of lambs and cattle in relation to its chemical composition and to diet. Br. J. Nutr. 20:449–460. Chadwick, J. P., C. M. Yates, and M. G. Owen. 1993. Comparison of
four ultrasonic techniques for in vivo estimation of sheep carcass composition. Page 29 in Proc. Winter Mtg. of the Br. Soc. Anim. Prod., Scarborough, U.K.
De Campaneere, S., L. Fiems, J. Vanacker, and C. Boucque´. 2000. Evaluation of urinary creatinine excretion to estimate in vivo body composition of Belgian Blue double-muscle bulls. Ann. Zoo-tech. 49:335–342.
Dinkel, C. A., L. L. Wilson, H. J. Tuma, and J. A. Minyard. 1965. Ratios and percents as measures of carcass traits. J. Anim. Sci. 24:425–429.
Dourmad, J. Y., Y. E´ tienne, J. Noblet, and D. Canseur. 1997. Pre´dition de la Composition chimique des truies reproductrices a` partir du poids vif et de l’e´pissure de lard dorsal. J. Rech. Porc. Fr. 29:255–262.
Gomes, M. J. M. 2001. Efficiency of utilisation of fibrous-feeds offered to the native sheep breed Churra da Terra Quente—Supplemen-tation and genotype as sources of variation. Ph.D. Thesis. Univ. of Tra´s-os-Montes e Alto-Douro, Vila Real, Portugal. (In Por-tuguese)
King, R. H., E. Speirs, and P. Eckerman. 1986. A note on the estima-tion of the chemical body composiestima-tion of sows. Anim. Prod. 43:167–170.
Lawrence, T. L. J., and V. R. Fowler. 2002. Growth of Farm Animals. 2nd ed. Pages 277–319 in Measuring Growth. CAB Int., Wall-ingford, U.K.
Leymaster, K. A., H. J. Mersmann, and T. G. Jenkins. 1985. Predic-tion of the chemical composiPredic-tion of sheep by use of ultrasound. J. Anim. Sci. 61:165–172.
MacNeil, M. D. 1983. Choice of a prediction equation and the use of the selected equation in subsequent experimentation. J. Anim. Sci. 57:1328–1336.
McDonald, P., R. A. Edwards, J. F. D. Greenhalgh, and C. A. Morgan. 2002. Animal Nutrition. 6th ed. Prentice Hall, London, U.K. McEwan, J. C., J. N. Clarke, M. A. Knowler, and M. Wheeler. 1989.
Ultrasonic fat depths in Romney lambs and hoggets from lines selected for different production traits. Proc. N.Z. Soc. Anim. Prod. 49:113–119.
McLaren, D. G., J. Novakofski, D. F. Parrett, L. L. Lo, S. D. Singh, K. R. Neumann, and F. M. McKeith. 1991. A study of operator effects on ultrasonic measurements of fat and longissimus mus-cle area in cattle, sheep and pigs. J. Anim. Sci. 69:54–66. Moeller, S. J. 2002. Evolution and use of ultrasonic technology in the
swine industry. J. Anim. Sci. 80(Suppl. 2):E19–E27.
Ramsey, C. B., A. H. Kirton, B. Hogg, and J. L. Dobbie. 1991. Ultrason-ics, needle and carcass measurements for predicting chemical composition of lamb carcasses. J. Anim. Sci. 69:3655–3664. Reid, J. T. 1968. Body composition in animals and man. Publication
No. 1598. NRC, Washington, DC.
Suguisawa, L. 2002. Ultrasonography as a predicting tool for carcass traits and composition of steers. M.S. Thesis. Escola Superior de Agricultura Luiz de Queiroz, Piracicaba, Brasil.
Szabo, C., L. Babinszky, M. W. A. Verstegen, O. Vangen, A. J. M. Jansman, and E. Kanis. 1999. The application of digital imaging techniques in the in vivo estimation of body composition of pigs: a review. Livest. Prod. Sci. 60:1–11.
Williams, A. R. 2002. Ultrasound applications in beef cattle carcass research and management. J. Anim. Sci. 80(Suppl. 2):E183– E188.
Wilson, D. E., 1992. Application of ultrasound for genetic improve-ment. J. Anim. Sci. 70:973–983.
Wishmeyer, D. L., G. D. Snowder, D. H. Clark, and N. E. Cockett. 1996. Prediction of live lamb chemical composition utilizing elec-tromagnetic scanning (ToBEC). J. Anim. Sci. 74:1864–1872. Wright, I. A., and A. J. F. Russel. 1984. Estimation in vivo of the
chemical composition of bodies of mature cows. Anim. Prod. 38:33–44.
Young, M. J., and J. M. Deaker. 1994. Ultrasound measurements predict estimated adipose and muscle weights better than car-cass measurements. Proc. N.Z. Soc. Anim. Prod. 54:215–217. Young, M. J., J. M. Deaker, and C. M. Jogan. 1992. Factors affecting
repeatability of tissue depth determination by real-time ultra-sound in sheep. Proc. N. Z. Soc. Anim. Prod. 52:37–39.