Revenue Diversification in Public Higher Education: Comparing University
and Polytechnic Sectors
Teixeira, P., Rocha, V., Biscaia, R., & Cardoso, M. F.
Abstract
Financial stringency has been an increasing concern to public higher education in Europe, as this sector has become one of the potential areas for cuts in public expenditure, especially in the aftermath of the financial crisis of 2008. Public Higher Education Institutions have therefore been under increasing pressure to diversify their funding sources. This study compares the ability of public universities and polytechnics to accumulate non-public revenues by using a panel of 30 Portuguese higher education institutions for the period 2003-2009. Specific institutional characteristics are investigated, including the relative size in undergraduate and postgraduate programmes, the qualification of the academic staff and the regional environment where institutions are located. Our results suggest that the level of qualification of the academic staff is one of the most important determinants of institutions’ ability to gather non-governmental funding from tuition fees and other sources.
Keywords: Public Sector; Higher Education; Tuition Fees; Revenue Diversification; Reputation; Location
2
Revenue Diversification in Public Higher Education:
Comparing University and Polytechnic Sectors
1.
Introduction
One of the dominant issues in recent years in public higher education in Europe, as much as elsewhere, has been that of financial stringency (Johnstone and Marcucci, 2010). The current financial crisis has exacerbated the prior debates about the sustainability of the welfare state and undermined the traditional financial reliance of European higher education on public funding (Barr 2004). The growing financial needs in areas such as healthcare and social security have forced many governments to rethink their financial engagement in other areas and higher education has become one of the potential areas for cost containment (Barr and Crawford 2005). Thus, many public Higher Education Institutions (HEIs) have been facing a financial outlook of declining public support.
This has created an increasing pressure upon public HEIs to reduce their reliance on public funding by diversifying their revenue structure (Zidermann and Albrecht 1995; Teixeira and Koryakyna 2010). However, there is very limited knowledge about the institutional characteristics that may explain those apparent differences in their ability for diversifying their funding structure. Existing studies indicate that the success in attracting alternative resources is neither simple, nor accessible to many institutions. Like in other aspects of higher education, a kind of Matthew effect (Merton 1973) may come into play, with the strongest institutions being the most successful in attracting additional non-public revenues and these new sources of funding being channelled to a small number of institutions (see Estermann and Pruvot 2011).
3
The main purpose of this study is to analyze which factors may explain the ability of different types of public HEIs to accumulate revenues from diverse sources (tuition fees and other non-public revenues). The analysis will give particular attention to the comparison of university and vocational sectors and assesses to what extent each type of institutions show particular advantages in revenue diversification. Portuguese data are analysed for the period 2003-2009 through panel data models, which allows the possibility to explore the relevance of each factor both over time and for different parts of the system. Factors such as the distribution of enrolments between undergraduate and postgraduate programs, the regional environment where HEIs are inserted and the qualification of the academic staff are examined. The remainder of the paper is structured as follows: In the following section the contextual trends towards revenue diversification in European public higher education is briefly reviewed. In section 3 there is the analysis of the specific situation of the Portuguese move towards greater cost-sharing and revenue diversification in higher education. Section 4 presents the empirical strategy and describes the data used in this study. Section 5 presents and discusses the empirical results. The text concludes in Section 6, with some reflections about possible implications of the results.
2.
The Move towards Revenue Diversification in European Higher
Education
HEIs face today a demanding and complex financial context in which public modes of funding have been transformed and became more demanding and competitive (Herbst 2006; Johnstone and Marcucci 2010). After several decades of expansion, governments are currently less willing to put additional resources in public higher education system, which becomes even more problematic due to the increasing trends on the cost side (e.g., Barr 2004;
4
Docampo 2007). A possible explanation for rising costs lies in the emphasis on research universities, as the role model has definitely contributed to enhance this trend, as suggested by the American experience where the increase in cost has been far more pronounced in research universities (Clotfelter 1996; Geiger 2004). Another important factor has to do with the nature of higher education as a labour intensive activity and the fact that institutions seem unable to benefit in large scale of the kind of productivity enhancements typically associated with the goods-producing sectors of the industrialised economies (Archibald and Feldman 2010).i
This financial context has led to greater concerns with the level of external and internal efficiency of the system (Teixeira et al. 2004). Like in many other public services, in recent years it became a rather common statement that HEIs should be more efficient in the use of taxpayers’ resources (Pollitt and Bouckaert 2011). These rising concerns with efficiency have had a clear impact in the relationship between HEIs and their main financial provider, which has been visible in changes in the funding of public higher education in Europe and the growing popularity of performance-based funding and contract funding (e.g., Chevaillier and Eicher 2002; Liefner 2003). Underpinning these changes has been the expectation that it will promote greater efficiency of the institutions, namely by enhancing competitive stimuli within the system.
Hence, European public HEIs have been under pressure to diversify their revenues. Revenue diversification has been defined as the generation of revenues beyond government appropriation through commercialization of research, technology transfer, consulting, life-long learning and customized courses, generating funds from assets and alterations in financial decision-making and management as well as other activities (Ziderman and Albrecht 1995). Revenue diversification activities include aspects such as instructional initiatives (e.g. test-preparation courses, lifelong learning programs, workforce retraining, distance education); research and analysis initiatives (e.g. technology transfer offices, business
5
partnerships); franchising, licensing, sponsorship, and partnering with third parties; initiatives in auxiliary enterprises, facilities, and real estate; and development office initiatives (e.g. appeals to donors and other efforts). The trend towards revenue diversification also underpins the introduction of cost-sharing in many higher education systems (Johnstone and Marcucci 2010).ii
Another potential source of revenue has to do with a greater engagement with external stakeholders, which has not been restricted to financial issues but it is part of a broader trend in higher education policy (Middlehurst and Teixeira 2012). University-industry cooperation has become of high relevance on the European political agenda and is supported by several supra-national initiatives, though the findings of a study on university-based research funding indicate that business investment in HE research in the EU is not yet very significant (EUA, 2005). A related potential source of revenue is Philanthropy, which has a long history in connection with higher education in the United States and in recent years has started to be explored in Europe as well. A new development is the spread of American-style endowment campaigns and an increasing number of universities have turned their eyes on their alumni, with many setting-up development offices and creating extended databases of their graduates (see Estermann and Pruvot 2011).
However, not all HEIs are likely to be equally successful in their attempts to diversify revenues and to attract non-public sources. Some institutional characteristics may help or hinder in that respect, though our knowledge is still very limited in this respect. The few existing studies have tended to give particular attention to research funding and its institutional distribution. For the case of the US, the analysis by Ali et al. (2010) of the link between research funding and institutional characteristics indicated that grant distribution was a function of institutional specificities. In his analysis of research funding in Europe, Geuna (2001) noted that there has been a move toward contract-funding and an increasing relevance
6
of funding from businesses, non-profit organizations and international sources. Moreover, his study has also observed signs of an increased concentration of resources and an exacerbation of the impact of cumulative and self-reinforcement phenomena already present in the process of scientific production.
Hence, although most institutions are aware that they face a more competitive and diverse financial scenario, not all of them will be on equal standing to tackle that challenge. Some institutions are likely to be more successful, due to aspects such as their reputation, their size, their disciplinary profile, their location or their mission orientation. We need to deepen our knowledge about those factors, especially to understand the possibilities and limitations faced by many institutions and the potential impact of the current trends in funding policies in re-shaping the higher education landscape in Europe. In the following sections these issues are analysed by looking at the Portuguese public higher education system, which like many European systems has faced in recent years significant pressures towards revenue diversification.
3.
Revenue Diversification in Portuguese Higher Education
Portugal has been part of the discussion about funding changes and revenue diversification, not the least due to the fast and belated expansion of its higher education system. Portuguese higher education remained rather small and elitist until the mid-eighties (Teixeira et al. 2006), but by then the social and political pressures for expansion became very strong and the system has expanded massively both in number of institutions and in enrolments (see table 1). Thus, the expansion of Portuguese higher education took place in an international economic and political context of debate about the reform of the welfare state (Barr 2004) and far less favourable to an exclusive reliance on public funding.
7
Table 1 here
The evolution of funding in Portuguese higher education followed wider European trends by placing greater emphasis on issues such as formula funding’s criteria, competitive funding and revenue diversification. Since the late eighties the funding of public higher education was organized through a funding formula that was proportional to enrolments and incorporated other cost parameters such as the study area and type of institution, though in more recent years there has been a growing political willingness to introduce output indicators regarding graduation rates and research performance of each HEI (see Rosa et al. 2009). Recent years also signalled the political adoption of a more hybrid view regarding higher education funding sources. In the late nineties it was introduced as one of the guiding principles of the funding of public higher education that of complementary funding, meaning that institutions should find additional sources to public funding sources of revenue. In 2003, a new funding law was passed and it became more explicit the emphasis on diversification of funding sources. Subsequent financial regulations would consolidate the incentives towards revenue diversification, namely through a preferential treatment of those institutions capable of generating more revenues.
This view about the role of students’ contributions made its way through the development of cost-sharing. Until the early nineties the level of tuition fees in public institutions remained very low (about €6 per year). In 1992, a new tuition fees system was established, means-tested and with far more significant values (about €300 annually), though still low by international standards. Despite significant students’ protest and political turmoil, with various
8
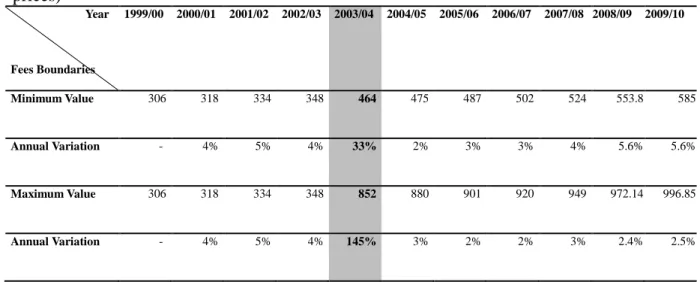
ministers of education having to resign under the pressure of those protests, the situation eventually settled. In 2003 variable fees were introduced, with a minimum amount equal to 1.3 national minimum salaries and the maximum amount updated each year according to the Consumer Price Index.
Table 2 here
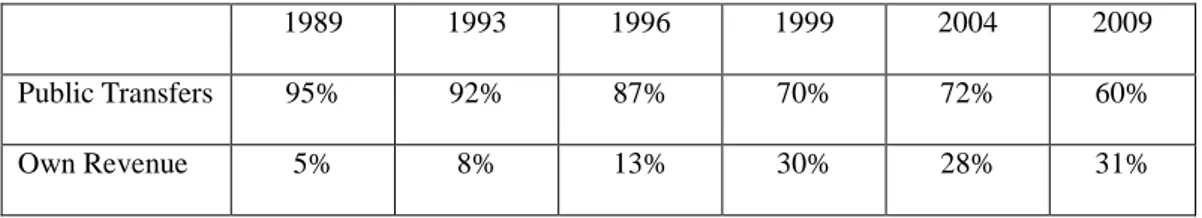
The last two decades have seen not only the consolidation of cost-sharing, but also the development of revenue diversification, due to increasing financial constraints on public expenditure. Looking at table 3, over the last decades the funding of higher education in Portugal has evolved towards greater reliance on the institutions’ capacity to find alternative sources to government transfers. By making institutions more autonomous, governments have increasingly stressed their responsibility to diversify their revenues. The main source among those ones has been the rising role of tuition fees, though other areas such as research funding, EU programs, and the commercialization of services, have all gained increasing relevance. In the following sections the effectiveness of institutions regarding their ability to diversify their funding structure is analysed, under such changes on funding regulations.
Table 3 here
9
In order to study which factors may explain the success of HEIs to attract revenue from non-governmental sources, the situation in the university and the polytechnic sectors is compared to assess to what extent each type of institutions has shown a particular advantage in revenue diversification. The polytechnic sector was created with a stronger regional orientation and aiming at developing stronger links with the business sector, hence it could have some advantage in this regard. On the other hand, the university sector is older, has stronger academic and social visibility and could use the additional reputation in developing postgraduate programs (which charge higher fees) and in selling their expertise. Data is collected from 30 Portuguese public HEIs (15 universities and 15 polytechnic institutes) for the time period 2003 to 2009, which will be explored through panel data models to search for a potential different effect of each of the factors analysed over time, after controlling for the sub-sector of HEIs (polytechnic versus university).
4.1. Empirical Model and Variables
For the analysis two different model specifications are adopted. A separate analysis of those factors explaining revenues from tuition fees and other non-public revenues is performed, since the relevance of each factor may be different for each of these types of revenues. The first model estimated considered the real value of tuition fees obtained by each institution in each year as the dependent variable and the second the real value of own revenues. The explanatory variables considered were the composition of enrolled students in undergraduate and postgraduate programs, the qualification of academic staff (measured by the number of PhD staff in the institution), the subsector where the institution operates and also the regional background where the institution is located, namely the population of the region and the respective purchasing power (see table 4 for a better description of variables).
10
The explanatory variables used reflect what we have considered to be the major possible factors explaining different institutional effectiveness in revenues diversification. As regards tuition fees we have considered undergraduate and postgraduate students separately since the level of fees paid by each group tends to differ significantly (less than 1,000€ for undergraduate students and around 3,000-5,000€ for postgraduate programs). Moreover, the capacity of institutions to attract these students seems to be somewhat different. In the case of undergraduate students geographical proximity seems to be a critical factor, where in the case of postgraduate programs reputation clearly becomes a more important factor (see Teixeira et al. 2009). A larger number of post-graduate students is likely to reflect a stronger social reputation of an institution, which in turn is expected to be an important factor to an institution’s ability to attract other types of revenues.
Another important explanatory variable for the ability of HEIs to accumulate higher revenues from tuition fees is surely the size of the institution, since larger institutions will be able to raise more revenues from tuition fees. In terms of own revenues, the number of undergraduate students is not expected to have any direct and relevant effect per se on the capacity of an institution to accumulate this type of revenues.
The qualification of the academic staff is expected to contribute positively to the HEIs’ ability to generate revenues from both tuition fees and other sources, since it will promote a stronger reputation of the institution. Regarding tuition revenues, the effect may be even more important by attracting more postgraduate students (which also pay higher fees), since they will be more attentive to the research reputation of the institution. Consequently, the expectation is that institutions with a more qualified academic staff will be more able to generate higher revenues from tuition fees and other different sources.
11
Finally, we have considered how the regional background may impact on HEIs’ ability to diversify their revenues. Regarding the regional population, the expectation is that institutions located in more populous regions may have higher levels of enrolments and thus accumulate more revenues from tuition fees. However, institutions located in densely populated/low income regions may obtain lower revenues from student fees than institutions located in less populated/high income regions. Accordingly, the population with 15 to 64 years old in the region, as well as per capita purchasing power in the region where the institution is located, were considered as proxies of, respectively, the effect arising from the dimension of the population in the region and from the regional purchasing power. Regarding the effect on own revenues, population and purchasing power of the region are both expected to have a positive effect on the level of revenues, since population, combined with the purchasing power, may represent indirectly part of the demand for goods and services in the region. However, one must be aware that HEIs do not work only at a regional level, rather working increasingly at a national and international scale, which may weaken the influence of the regional factors.
The models were explored by constructing a database in a panel format that enriched the analysis relatively to a study using only cross-sectional or time-series data. Panel data provides more informative data and greater efficiency in the estimations, allowing us to control for HEIs’ unobserved heterogeneity and studying the dynamics of adjustment over the time (Baltagi 2005). Linear panel data models were considered, namely the fixed and random effects models. Time fixed effects were also controlled for. Additionally, interactions between the considered explanatory variables and both time and subsector were also investigated.
According to some post-estimation tests (namely Hausman test), random effects panel data models were found to be more suitable in our estimations, allowing us to account both for the variability of repeated measures over time (within variation) of the same HEI and for
12
the variability between institutions (between variation). Actually, a previous analysis of data regarding the within and between variation of each variable allowed observing that the institutions under scrutiny were very dissimilar, not only within each subsector (university and polytechnic), but even more between subsectors. As a result, a statistical model able to account for both within and between variation, would be the most appropriate (Greene 2002, 295; Baltagi 2005, 17). Accordingly, the following equation is estimated:
yit =
α
+ X’itββββ
+ε
i + uit (1) where, yit is the dependent variable - real value of tuition fees or real value of “Own revenues” of institution i at time t (according to the specification used to estimate (1)),α
is the intercept term, common across the institutions included in the analysis, while Xit is a vector ofexplanatory variables (see table 4). The two remaining components correspond to a composite error term, where
ε
i is the cross-section, or institution-specific, error component and uit is the combined time series and cross-section error component. The error components were assumed to be not correlated with each other and not correlated across both cross-section and time series units.Table 4 here
4.2. Descriptive statistics
13
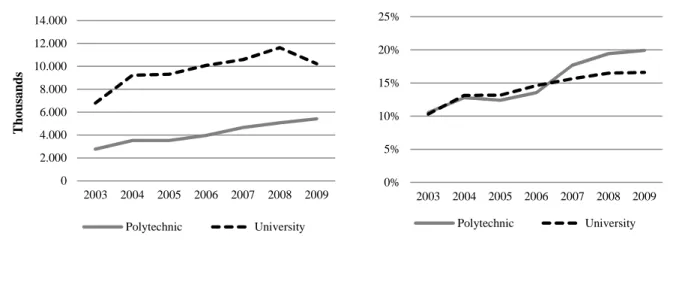
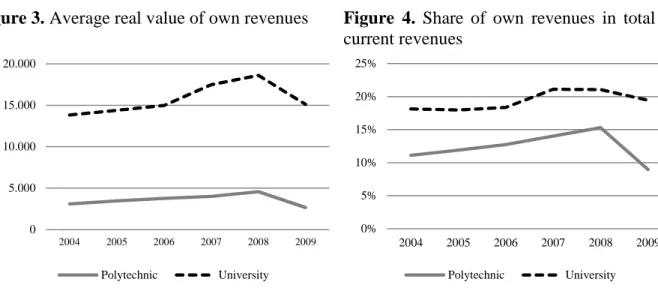
A brief presentation of the evolution of the dependent variables follows. Figure 1 and 2 depict respectively the evolution of the average real value of tuition fees over time and the share of tuition fees in total current revenues. In absolute terms large differences between universities and polytechnics are observed, as the real revenue from tuition fees (and other small fees) for universities was more than the double than that for polytechnics. However, the differences among subsectors almost vanished when this variable was analysed in relative terms (figure 2), except for the most recent years. On average, tuition fees corresponded to 14% of total current revenues in universities and 15% in polytechnics. Figures 3 and 4 present respectively the evolution of the institutions’ own revenues over time and the share of own revenues in total current revenues. Figure 3 indicates that the ability to attract non-public revenues is much more significant for Portuguese public universities than to the polytechnic sector. According to figure 4, and contrasting to the case of tuition fees, those revenues still present significant differences between those two sectors considering their relative weight in the total institutional revenues. Moreover, these disparities between subsectors persist over time and seem to become more pronounced at the end of the period analysed.
Figures 1, 2, 3 and 4 here
Explanatory Variables
As explained above, one of the main variables considered to explain tuition fees and other non-public revenues in the number and the type of students. Looking at the evolution of
14
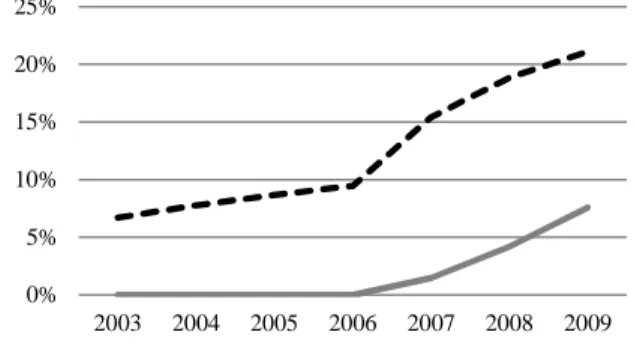
the composition of enrolments a clear increase in the number of postgraduate students is observed, both in absolute and relative terms (figures 5 and 6). Although the increase was felt in both the polytechnic and university sectors, large differences persist with the former still lagging behind the university sector. In particular, postgraduate students corresponded to 4.4% of the total number of students in polytechnics and 18.5% in universities in 2007. The effect of postgraduate students may therefore be a potentially relevant factor to explain part of the difference between these two sectors regarding revenue diversification.
Figures 5 and 6 here
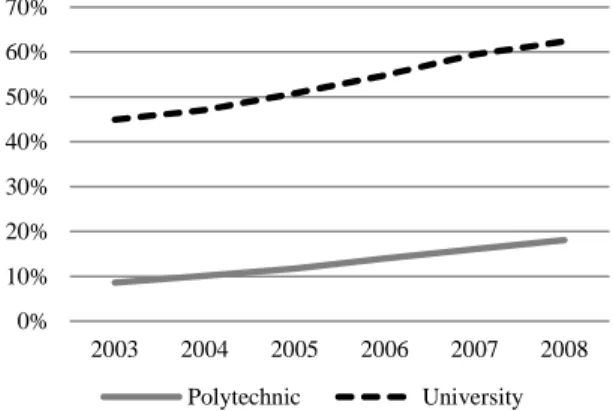
Another potentially relevant factor is the qualification of the academic staff. Figures 7 and 8 depict the evolution of the academic staff qualification, both in absolute (total number of number of PhD professors) and relative (relative weight of PhD professors in total HEIs’ academic staff) terms. Very large differences are observed among universities and polytechnics and these persist over time, with universities presenting a number of PhD professors several times larger than those found in polytechnics. This also reflects a different mission orientation and a much weaker emphasis on research among institutions belonging to the latter group. These differences may have an impact in generating other revenues through multiple ways, e.g., the development of postgraduate programs, the attraction of research funding, the reputation effect in consultancy and other services to society, just to refer some examples.
15
Figures 7 and 8 here
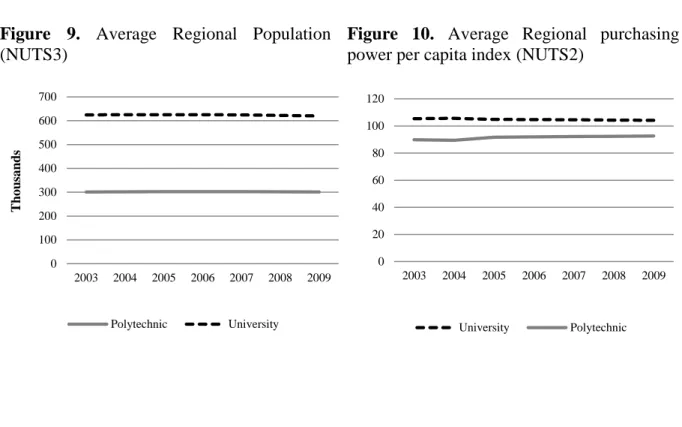
Finally, the issue of location is introduced to evaluate at what extent it may help or hinder the possibility of institutions to attract non-public revenues. According to figure 9 Portuguese universities tend to be located in more populous regions than polytechnics, suggesting that the former have a larger potential market for commercializing their teaching and research services. Moreover, figure 10 indicates that Portuguese universities are located in regions where the average purchasing power is above the national average, while the opposite is observed for polytechnics. Hence, this preliminary analysis of regional variables suggests that these may play some role in explaining differences in the sector’s and institutional capacity to attract non-public revenues.
´
Figures 9 and 10 here
Table 4 describes in detail the variables used in the empirical analysis, presenting as well some basic statistics for polytechnics and universities separately. In order to identify any
16
potential significant association between the two alternative dependent variables - real value of tuition fees and real value of own revenues - and the explanatory variables presented above, a multivariable analysis was carried out. As a first step a univariable analysis of each explanatory variable was performed with each dependent variable. As a second step both forward and backward selection methods were used to obtain the smallest number of explanatory variables and to provide well identified models. In order to find if the effect of each variable varied with time or with sector (university or polytechnic), the interactions between those variables and the variables selected for the multivariable models were investigated. Finally, the regressions including the interactions that were found to have a significant effect in the previous step were estimated. In the final model the effect of each independent variable was obtained by controlling for all the others in the model.
5.
Empirical Results
5.1. Factors Explaining Revenue Diversification through Tuition Fees
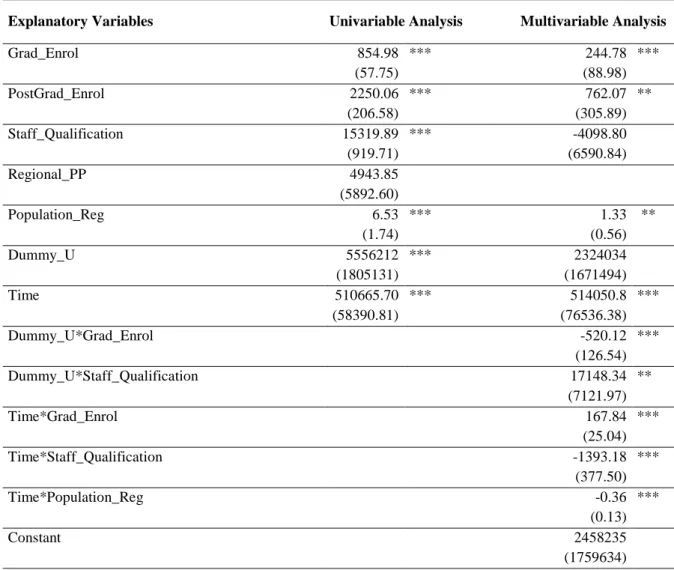
The empirical results for the model analysing factors explaining tuition fees revenues are presented in table 5. They indicate that in the univariable analysis all the tested variables yield the expected results and only the regional purchasing power showed a marginal association (P>0.05) with the value of the tuition fees. After adjusting for the effects of other variables, multiple regression analysis based on random effects panel data models showed that all the considered explanatory variables were significantly associated with the real value of tuition fees, with the exception of the variables related to the purchasing power of the region the institution is located. The following interactions terms were found to be significant and were thus included in the model: interactions between the subsector of HEIs (university or polytechnic) and the qualification of academic staff (Dummy_U*Staff_Qualification) and
17
enrolled students in undergraduate programs (Dummy_U*Grad_Enrol), and interactions between time and the qualification of academic staff (Time*Staff_Qualification), enrolled students in undergraduate programs (Time*Grad_Enrol) and the regional population (Time*Population_Reg)iii.
All the explanatory variables were centred towards its mean, except for the dummy variable and the time variable, allowing the direct interpretation of the constant term. The estimate for the constant, plus n times the Time coefficient, represents the estimated real value of revenues from tuition fees in the nth year for a polytechnic institution with an average profile in terms of number of enrolled students (both in undergraduate and postgraduate programs) and number of academic staff with a PhD degree. Hence, an HEI in these conditions was expected to have on average, in the first year under analysis and according to the estimated model, €2,972,286 of revenue from tuition fees. In the case of a university, this value increased to € 5,296,320.
The model allows us to analyse the effects arising from the enrolment of undergraduate and postgraduate students. The R-Squared Index of the final model is a measure of the goodness of fit of the model. Overall, the model explains about 96% of the variability of the real value of tuition fees in Portuguese HEIs over the period under analysis. After adjusting for the effects of other variables in the model, the marginal effect of an extra undergraduate student in the real value of the revenues from tuition fees depended on the type of institution and varied over time. For a polytechnic, the results indicated that on average an additional undergraduate student had a greater impact than for universities on the real value of the revenues from tuition fees. The effect of an extra student was not constant and increased during the period analyzed. According to the model, the number of postgraduate students was also positively correlated (P<0.05) with the total real revenues from tuition fees, which confirms our expectations that this type of students contributes significantly to this type of
18
revenues, as postgraduate students typically pay higher fees than undergraduate ones. The interactions with time and subsector dummy variables were not significant and were not included in the final model.
Table 5 here
The interactions between the qualification of the academic staff and both the subsector of the institutions and time were statistically significant, yielding results in line with our expectations. The relevance of the qualification of the academic staff seems to be clearly more significant to the university sector than to the polytechnic one, reflecting the vocational orientation of the latter and the lower relevance of that factor to prospective students applying to the polytechnic sector. The effect of the qualification of the academic staff showed a negative trend over time period reflecting recent improvements in the qualification of the academic staff, especially in the university sector, which made the situation more similar across the system and attenuated its positive effect.
The analysis also indicates that, after controlling for other HEIs’ characteristics, the regional variables have a small impact on the total real value of tuition fees. In the case of size of the population, the coefficient is statistically significant but its positive effect - which was already small in the beginning of the period - vanishes over time. In the case of regional purchasing power, the variable does not yield a significant impact, neither in the univariable nor in the multivariable analysis. This result suggests that, after considering other
19
determinants, location seems to be less relevant for HEIs’ capacity to raise resources through tuition fees, as other factors may be far more significant.
5.2 Factors Explaining Revenue Diversification through other Non-Public Sources
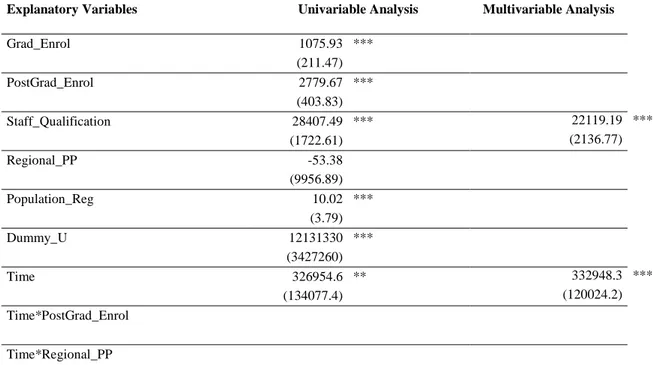
The empirical results for the analysis of the factors explaining differences between sectors in generating revenues from other non-public sources are presented in table 6. From univariate analysis, results indicate that, as in the case of real value of tuition fees, the regional purchasing power is the only variable with no significant association with the dependent variable under consideration. Every other variables yielded the expected results. As expected, the magnitude of the effect arising from the postgraduate students is higher than that of undergraduate students, as the number of postgraduate students reflects the reputation of the institution and its ability to capture revenues other than tuition fees and governmental transfers. Regional population also impacts positively on the HEIs’ ability to gather other revenues, as it works as an indication of the regional demand for goods and services provided by the institutions. Finally, unconditionally (i.e., without control for any other variables), universities per se on average seem to be able to collect about €12.3 million more revenues, in real terms, than polytechnics and the ability of HEIs to accumulate own revenues seem to have increased over time (about €330.000 more per year).
From multivariable analysis, after controlling from the several sources of observed heterogeneity among HEIs, the scenario seems to be very different regarding the factors that mostly explain the HEIs’ ability to collect this particular type of revenues. The qualification
20
of the staff seems to be the most important factor to explain HEIs’ own revenues, suggesting that among the set of variables taken into account institutional reputation matters the most. Additionally, the qualification of the staff is also highly statistically significant when interacted with time. The coefficient associated with staff qualification is positive regardless of the sector that the institution belongs to, since the coefficient of the interaction of staff qualification with the sector is statistically not significant. Regarding the interaction term
Time*Staff_Qualification, the results point out that each additional year increased the effect
arising from having an extra PhD instructor by approximately €1,050 in real terms. The results suggest that, after controlling for other determinants, the sector itself does not seem to be a major factor to explain the HEIs’ ability to generate this type of revenues.iv´
Table 6 here
6.
Concluding Remarks
Public HEIs have been under increasing pressure to attract other sources of income that may complement their traditional reliance upon public funding, which has created a significant competition to attract other revenues through the commercialization of educational and research services. In this paper some factors that may explain the ability of public HEIs to accumulate revenues from different sources were analysed, namely tuition fees and other non-governmental revenues. The results from the analysis of a panel data of Portuguese HEIs suggests that not all institutions seem be on equal standing when it comes to diversify their
21
funding sources and that certain characteristics seem to be particularly relevant in explaining a greater capacity to diversify their funding basis through tuition fees and other non-public revenues.
The comparison has given particular attention to the differences between the polytechnic and the university sectors. There are differences when it comes to revenue diversification through tuition fees, but not when it comes to other revenues (when controlling for other factors). Although the polytechnic sector was created with a stronger regional orientation and aiming at developing stronger links with the business sector, location turned out to be less relevant than what is often expected in explaining HEIs’ capacity to increase their revenues. This suggests that attractive institutions are able to attract students and revenues regardless of certain location issues, though the size of the country may prevent the generalization of this result to a much larger country.
One of the leading factors explaining institutional effectiveness in revenue diversification for both tuition fees and other non-public sources seems to be the qualification and reputation of the academic staff. In the Portuguese case this has been relevant when it comes to revenue diversification through tuition fees since it enabled the institutions to develop postgraduate programs that charge higher fees. Moreover, it seems that the university sector, with its older academic credentials and stronger social visibility, could use its stronger reputation to develop pricier postgraduate programs and to sell its expertise to the private sector. It should be noted nevertheless that the higher level of qualification of the academic staff is also an additional cost that needs to be taken into account from a management perspective, especially since it has been pointed out as a major driver for cost escalation in other higher education systems.
22
Since it is widely expected that the trend towards greater revenue diversification will be enhanced in the coming years, it is important that we continue to explore the factors that may help us to understand the effectiveness of some institutions and sectors to diversify their funding sources. If our results are confirmed, it seems that we may be moving towards a greater differentiation in the financial condition of European HEIs. This will mean that some institutions will be able to put more resources in attracting qualified staff, thus reinforcing their financial competitive advantage, and in strengthening their (expensive) research credentials (which again will enhance their advantages). This will possibly lead to a significant reshaping of the European higher education landscape.
References
Ali, Mir M., Partha Bhattacharyya and Anthony J. Olejniczak. “The Effects of Scholarly Productivity and
Institutional Characteristics on the Distribution of Federal Research Grants.” Journal of Higher
Education 81 (2010): 164-78.
Archibald, Robert B. and David H. Feldman. Why Does College Cost So Much? Oxford and New York: Oxford
University Press, 2010.
Baltagi, Badi H. Econometric Analysis of Panel Data, 3rd edition. England: John Wiley & Sons, Ltd., 2005.
Barr, Nicholas Economics of the welfare state, (4th edition). Oxford: Oxford University Press, 2004.
Barr, Nicholas and Ian Crawford. Financing Higher Education – Answers from the UK. Routledge, 2005.
Cerdeira, Luísa. The Funding of Portuguese Higher Education: Cost-sharing. Coimbra: Almedina, 2009 (in
Portuguese).
Chevaillier, Thierry and Jean-Claude Eicher. “Higher Education funding: a decade of changes.” Higher
Education in Europe 27 (2002): 89-99.
Clotfelter, Charles. Buying the Best - Cost Escalation in Higher Education. Princeton University Press,
23
Docampo, Domingo. “International comparisons in higher education funding.” Higher Education in Europe, 32
(2007): 369-86.
Estermann, Thomas and Enora Pruvot,. Financially Sustainable Universities II – European universities
diversifying income streams. Brussels: European University Association, 2011.
European University Association. The Funding of University-Based Research and Innovation in Europe.
Brussels: European University Association, 2005.
Geiger, Roger. Knowledge and Money. Palo Alto (CA): Stanford University Press, 2004.
Getz, Malcolm and John J. Siegfried. “Costs and Productivity in American Colleges and Universities.” In
Economic Challenges in Higher Education, edited by Charles T. Clotfelter; Ronald G. Ehrenberg; Malcolm Getz, and John J. Siegfried, XX-YY. Chicago: Chicago University Press and NBER, 1991.
Geuna, Aldo. “The Changing Rationale for European University Research Funding: Are There Negative
Unintended Consequences?” Journal of Economic Issues 35 (2001): 607-32.
Greene, William. H. Econometric Analysis, 5th edition. New Jersey: Prentice Hall, 2002.
Herbst, Marcel. Performance Based Funding: Springer: Dordrecht, 2006.
Johnstone, Bruce and Pamela Marcucci. Financing Higher Education Worldwide: Who Pays? Who Should Pay?
Baltimore: The John Hopkins University Press, 2010.
Liefner, Ingo. “Funding, resource allocation and performance in higher education systems.” Higher Education
46 (2003): 469-89.
Merton, Robert. (1973) The Sociology of Science: Theoretical and Empirical Investigations. Edited by Norman
Storer. Chicago: University of Chicago Press.
Middlehurst, Robin and Pedro N. Teixeira. “Governance within the EHEA: dynamic trends, common challenges,
and national particularities”, in European Higher Education at the Crossroads: Between the Bologna
Process and National Reforms. Edited by P. Scott, A. Curaj, L. Vlasceanu, and L. Wilson, 527-551. Springer, 2012.
Pollitt, Christopher. and Geert Bouckaert. Public Management Reform, Oxford: Oxford University Press, 2011.
Rosa, Maria J., Diana Amado and Alberto Amaral. “Funding allocation and staff management: A Portuguese
example”, European Journal of Education, 44 (2009): 127-40.
Teixeira, Pedro N. and Tatyana Koryakina. “Funding Reforms and Revenue Diversification - Patterns,
24
Teixeira, Pedro N., Madalena Fonseca, Diana Amado, Carla Sá and Alberto Amaral. "A Regional Mismatch?
Student Applications and Institutional Responses in the Portuguese Public Higher Education System". in
Public Universities and Regional Development. Edited by Kathryn Mohrman, Jian Shi, Sharon Feinblatt and King Chow. 59‐80. Sichuan: Sichuan University Press, 2009.
Teixeira, Pedro N. Bruce D. Johnstone, Maria J. Rosa and Hans Vossensteyn. A Fairer Deal? Cost-sharing and
accessibility in Western Higher Education. Dordrecht: Springer-Kluwer, 2006.
Teixeira, Pedro N. David Dill, Alberto Amaral and Ben Jongbloed. Markets in Higher Education. Amsterdam:
Kluwer 2004.
Ziderman, Adrian and Douglas Albrecht. Financing universities in developing countries. Washington, DC: The
25 TABLES
Table 1. Growth of enrolments, total and by sub-sector
1981 1991 2001 2008
No. % No. % No % No. %
Public Universities 64.659 76.8 103.999 47.0 176.303 44.5 169.449 43.6
Public Polytechnics 12.195 14.5 31.351 28.7 108.486 27.3 105.872 27.9
Private institutions 7.319 8.7 51.430 24.3 111.812 28.2 91.408 28.5
Total 84.173 100.0 186.780 100.0 396.601 100.0 366.729 100.0
26
Table 2. Evolution of level of annual fees, undergraduate programs (values in current
prices) Year Fees Boundaries 1999/00 2000/01 2001/02 2002/03 2003/04 2004/05 2005/06 2006/07 2007/08 2008/09 2009/10 Minimum Value 306 318 334 348 464 475 487 502 524 553.8 585 Annual Variation - 4% 5% 4% 33% 2% 3% 3% 4% 5.6% 5.6% Maximum Value 306 318 334 348 852 880 901 920 949 972.14 996.85 Annual Variation - 4% 5% 4% 145% 3% 2% 2% 3% 2.4% 2.5%
27
Table 3. Share of public transfers and own revenue of public higher education 1989-2009
1989 1993 1996 1999 2004 2009
Public Transfers 95% 92% 87% 70% 72% 60%
Own Revenue 5% 8% 13% 30% 28% 31%
28 Table 4. Variables and description
Variable Description Mean Mean U a Mean P a N
RV_Tuition Fees Real Value of Tuition Fees 6914782 9692888 4136676 210
RV_Own Revenues b
Real Value of Own Revenues: total current revenues minus revenues from tuition fees (and related taxes) and government budget
9662686 15728350 3597023 180
Grad_Enrol Total enrolled students in
undergraduate courses 8267 10570 5964 210
PostGrad_Enrol Total enrolled students in postgraduate
courses 909 1670 149 210
Dummy_U Dummy variable assuming the value 1
for universities and 0 for polytechnics - - - 210
Staff_Qualification Total number of PhD professors 325 579 72 180
Regional_PP c Index of regional purchasing power
(NUTS2) 98.131 104.808 91.455 210
Population_Reg Total Population (15-64) (NUTS3) 462864 623754 301974 210
Dummy_U*Grad_Enrol
Interaction variable between the university dummy and total enrolled students in undergraduate courses
- - - 210
Dummy_U*PostGrad_Enrol
Interaction variable between the university dummy and total enrolled students in postgraduate courses
- - - 210
Dummy_U*Staff_Qualification
Interaction variable between the university dummy and total doctorate teachers
- - - 195
Dummy_U*Regional_PP
Interaction variable between the university dummy and the index of regional purchasing power (NUTS2)
- - - 210
Dummy_U*Population_Reg
Interaction variable between the university dummy and the total population (NUTS3)
- - - 210
Time d
Discrete variable assuming values between 1 and 7 (time=1 for 2003; …; time=7 for 2009)
- - - 210
a
Mean U and Mean P stand for, respectively, the average values of the variables for the set of Universities and Polytechnics.
b
These set of revenues mainly include revenues from the provision of goods and services and transfers from European Union
and the rest of the world.
c
This variable was initially included at the NUTS3 level, though it produced inconclusive results. Therefore we have
included it at the NUTS2 level in the final calculations.
d Interactions of the different variables with the variable “Time” were also considered in the different estimations.
Data on Tuition fees was obtained from DGO (Direcção Geral do Orçamento) – Ministry of Finance; data on enrolled
students, academic staff and the HEIs’ subsector was obtained from GPEARI – Ministry of Education and Science; Regional
population and regional purchasing power were collected from INE – National Statistical Office. The remaining variables
29
Table 5. Univariable and multivariable analysis of the real value of tuition fees1
Random Effects Regression Coefficients
Explanatory Variables Univariable Analysis Multivariable Analysis
Grad_Enrol 854.98 *** 244.78 *** (57.75) (88.98) PostGrad_Enrol 2250.06 *** 762.07 ** (206.58) (305.89) Staff_Qualification 15319.89 *** -4098.80 (919.71) (6590.84) Regional_PP 4943.85 (5892.60) Population_Reg 6.53 *** 1.33 ** (1.74) (0.56) Dummy_U 5556212 *** 2324034 (1805131) (1671494) Time 510665.70 *** 514050.8 *** (58390.81) (76536.38) Dummy_U*Grad_Enrol -520.12 *** (126.54) Dummy_U*Staff_Qualification 17148.34 ** (7121.97) Time*Grad_Enrol 167.84 *** (25.04) Time*Staff_Qualification -1393.18 *** (377.50) Time*Population_Reg -0.36 *** (0.13) Constant 2458235 (1759634)
* P-value < 0.1; ** P-value < 0.05; *** P-value < 0.01
1 R2-Within=0.6349; R2-Between=0.9863; R2-Overall=0.9556; N=210 for all models, except for the univariable
analysis for the variable Staff_Qualification and the multivariable analysis (N=180), as data on staff is only
available for the period 2003-2008. The values within parenthesis correspond to the standard errors. The
interaction variables Dummy_U*PostGrad_Enrol and Time*PostGrad_Enrol were excluded from Table 5 as
their coefficients were found to be statistically insignificant. These were the only interaction variables that were
30
Table 6. Univariable and multivariable analysis of the real value of own revenues2
Random Effects Regression Coefficients
Explanatory Variables Univariable Analysis Multivariable Analysis
Grad_Enrol 1075.93 *** (211.47) PostGrad_Enrol 2779.67 *** (403.83) Staff_Qualification 28407.49 *** 22119.19 *** (1722.61) (2136.77) Regional_PP -53.38 (9956.89) Population_Reg 10.02 *** (3.79) Dummy_U 12131330 *** (3427260) Time 326954.6 ** 332948.3 *** (134077.4) (120024.2) Time*PostGrad_Enrol Time*Regional_PP Time*Staff_Qualification 1054.41 *** (291.88) Constant 8201386 *** (817641.5)
* P-value < 0.1; ** P-value < 0.05; *** P-value < 0.01
2 R2-Within=0.4461; R2-Between=0.8924; R2-Overall=0.8728; N=180 for all models, except for the univariable
analysis for the variable Staff_Qualification and the multivariate analysis (N=150), as data on staff is only
available for the period 2003-2008 and we have no disaggregated data on government budget for 2003. The
period was thus reduced to 2004-2008 in the multivariate analysis. The values within parenthesis correspond to
the standard errors. The coefficients of the interaction variables not included in the Table were found to be
statistically insignificant. The interaction terms presented in the final model were the only interaction variables
31
FIGURES
Figure 1. Average real value of revenues from
tuition fees
Figure 2. Share of tuition fees in total
current revenues 0 2.000 4.000 6.000 8.000 10.000 12.000 14.000 2003 2004 2005 2006 2007 2008 2009 T h o u sa n d s Polytechnic University 0% 5% 10% 15% 20% 25% 2003 2004 2005 2006 2007 2008 2009 Polytechnic University
32
Figure 3. Average real value of own revenues Figure 4. Share of own revenues in total
current revenues 0 5.000 10.000 15.000 20.000 2004 2005 2006 2007 2008 2009 T h o u sa n d s Polytechnic University 0% 5% 10% 15% 20% 25% 2004 2005 2006 2007 2008 2009 Polytechnic University
33 Figure 5. Average number of post-graduate
students
Figure 6. Share of post-graduate students in
total students 0 500 1000 1500 2000 2500 3000 2003 2004 2005 2006 2007 2008 2009 Polytechnic University 0% 5% 10% 15% 20% 25% 2003 2004 2005 2006 2007 2008 2009 Polytechnic University
34 Figure 7. Average number of Academic Staff
with a PhD
Figure 8. Share of Academic Staff with a
PhD 0 100 200 300 400 500 600 700 2003 2004 2005 2006 2007 2008 Polytechnic University 0% 10% 20% 30% 40% 50% 60% 70% 2003 2004 2005 2006 2007 2008 Polytechnic University
35 Figure 9. Average Regional Population
(NUTS3)
Figure 10. Average Regional purchasing
power per capita index (NUTS2)
0 100 200 300 400 500 600 700 2003 2004 2005 2006 2007 2008 2009 T h o u sa n d s Polytechnic University 0 20 40 60 80 100 120 2003 2004 2005 2006 2007 2008 2009 University Polytechnic
36
i
This has been called cost-disease meaning the rising relative unit cost phenomenon in labour intensive activities
that have greater difficulties in increasing their levels of productivity due to the limitations to replace labour by
capital and technology (Getz and Siegfried, 1991).
ii Out of 27 EU countries (plus Norway and Switzerland), 18 currently charge tuition fees in public institutions
and even traditionally tuition-free Nordic systems are experimenting it to non-EU students. Internationalisation
is a relevant dimension in this respect since international students provide an increasingly important revenue
stream. This is especially the case for those countries such as the UK that charge higher tuition fees to foreign
students.
iii
Regarding the multivariable analysis, only the results for the final estimated model are reported (Table 5),
omitting the results obtained in the intermediate estimations, as explained in the text, for the sake of simplicity
for the reader. However, the results are available upon request to the authors.
iv Since all the variables were centred towards their mean, the constant term can be interpreted as follows: an
institution with an average profile considering the number of postgraduate enrolments, total number of PhD Staff
and regional purchasing power is expected to have earned €8,534,334 in real terms (the constant term plus the
Time coefficient) in the first year of the sample, irrespective of the sector of the institution - university or polytechnic.