Determinants of Corporate Capital Structure: Evidence from
Non-financial Listed French Firms
Ana Margarida Fernandes Afonso Correia
Master Thesis in Finance and Tax
Supervised by
Prof. Dr. António Cerqueira
Prof. Dr. Elísio Brandão
i
Biography
Ana Margarida Fernandes Afonso Correia was born in Bragança, Portugal, on July 20th 1992. In 2010 initiated a Bachelor degree in Economics at the School of Economics and Management of the University of Porto (FEP) that was completed in July 2013.
In September 2013, she continued her studies in the Master of Finance and Tax at the same institution, where remains until the moment, and will conclude through the present master’s thesis.
In July 2014, she starts to work in the administrative and financial direction of
ii
Acknowledgements
First of all, I would like to especially thank to my mother and my father, they were present at every moment and without their support and immense patience this thesis would not have been finished.
I also would like to thank to my supervisors, Professor António Cerqueira and Professor Elísio Brandão, and to the remaining faculty of this master, who helped me in the preparation and elaboration of this document. Their dedication and knowledge were essential to the quality and accuracy of this master thesis.
Finally I would like to thank to the rest of my family and to all of my friends for their support and encouragement during this stage of my life.
iii
Abstract
This paper analyses firms’ characteristics that influence managers’ decisions about how to finance their companies. It also aims to study which financial theory better explains those decisions that affect the capital structure of the firms. Our empirical study uses panel data and Ordinary Least Squares estimations with cross-section fixed effects and year dummy variables. The sample includes 436 non-financial French firms, listed in the Paris Stock Exchange over the period from 2007 to 2013 (3052 firm-year observations). In the empirical study to test the results’ sensitivity to the use of debt with different maturities we use two regressions and hence two dependent variables: the total debt and the long term debt. The independent variables that we use are the tangibility of assets, the profitability, the firm size, the growth opportunities and the non-debt tax shields. All independent variables exhibit explanatory power and the results are robust to the use of debt with different maturities. The empirical results show that there is no leading theory in explaining managers’ decisions about how to finance firms. Additionally, the sample was divided into pre-crisis (2007-2008) and crisis (2009-2013) periods, the results show a substantial change of the influence of the tangibility of assets, as a result of the financial crisis.
Keywords: capital structure, trade-off theory, pecking order theory, market timing
theory, Euronext Paris
iv
Resumo
Este trabalho tem como principal objetivo estudar as características das empresas que influenciam as decisões dos gestores sobre como financiar as suas empresas. Outro dos objetivos deste estudo é perceber que teoria financeira melhor explica essas decisões que afetam a sua estrutura de capital das empresas. No nosso trabalho empírico utilizamos dados em painel e o método Ordinary Least Squares com efeitos fixos cross-seccionais e variáveis dummy para os anos. A amostra inclui 436 empresas Francesas, não financeiras, listadas na bolsa de valores de Paris para o período entre 2007 e 2013 (um total de 3052 observações empresa-ano). Para testar a sensibilidade dos resultados ao endividamento com diferentes maturidades, utilizamos duas regressões e consequentemente duas variáveis dependentes: o endividamento total e o endividamento de longo prazo. As variáveis independestes que utilizamos são a tangibilidade dos ativos, a rentabilidade, a dimensão da empresa, as oportunidades de crescimento e os benefícios fiscais não relacionados com o endividamento. Concluímos que os resultados são robustos ao uso das diferentes maturidades de envidamento. Todas as variáveis explicativas apresentam poder explicativo e os resultados empíricos denotam que das teorias abordadas nenhuma consegue explicar exaustivamente as decisões dos gestores no financiamento das suas empresas. Posteriormente, a amostra foi dividida entre o período pré-crise (2007-2008) e o período de crise (2009-2013), os resultados mostram uma mudança substancial do impacto da variável tangibilidade dos ativos, como resultado da crise financeira.
Palavras-chave: estrutura de capitais, teoria trade-off, teoria pecking-order, teoria market timing, Euronext Paris
Index of Contents
Biography ... i Acknowledgements ... ii Abstract ... iii Resumo ... iv 1. Introduction ... 1 2. Literature Review ... 5 3. Research Design ... 9 3.1 Hypothesis development ... 9 Tangibility of assets ... 9 Profitability ... 10 Firm size ... 11 Growth opportunities ... 12Non-debt tax shield ... 13
3.2 Variables ... 14
Tangibility of assets ... 15
Profitability ... 15
Firm size ... 15
Growth opportunities ... 16
Non-debt tax shields ... 16
3.3 Sample ... 17
3.4 Methodology ... 18
4.1 Univariate Analysis ... 21
4.2 Multivariate Results ... 22
5. Conclusions ... 29
Index of Tables
Table 1: The definition of the independent variables and expected signs ... 17
Table 2: Descriptive statistics ... 21
Table 3: Pearson correlation coefficients between variables ... 22
Table 4: Panel data regression coefficients ... 24
1
1. Introduction
Modern theory of capital structure starts with the Modigliani and Miller (1958) theorem stating that, under a number of specific assumptions, capital structure is irrelevant for both the cost of capital and firm value. The central assumptions of this theory are, for example, there are no taxes, no transaction costs and no bankruptcy costs in the economy.
Under these assumptions the Modigliani and Miller (1958) theorem makes sense. But those propositions are unrealistic. Thus many other studies after this one argue that the capital structure, i.e., the choice between debt and equity, really influences the value of the firm.
After the seminal work of Modigliani and Miller (1958), many other studies analyse this thematic using a less restrictive set of assumptions. Models of trade-off study capital structure by balancing the benefits of taxes against the costs of financial distress, Kraus and Litzenberger (1973), and against agency costs, Jensen and Meckling (1976). Another line of research argues that there is a pecking order among financing sources, Myers and Majluf (1984). Finally, a different body of literature, which is known as market timing theory, suggests that firms issue shares when the market is high and repurchase their own shares when the market is low, Baker and Wurgler (2002).
Since then, other studies have investigated what theory better explains the firms’ capital structure. For example Frank & Goyal (2009) identify a number of relevant factors underlying managers’ decisions about capital structure for a sample of US firms and investigate what theory better explains these decisions. In another work, Cortez & Susanto (2012) aim at finding the theory that better explains what factors influence financing decisions in Japanese Manufacturing Companies. Most of the extant literature found no evidence of a dominant theory in explaining the firms’ capital structure.
The motivations for studying the capital structure, although this issue has been widely discussed, rely on the lack of consensus regarding the determinants of capital structure and about the theory underlying managers’ decisions. In fact, the empirical results depend on the sample used and the period in analysis. Therefore, is important to
2
continue to investigate the firms’ characteristics that affect the managers’ decisions and develop a theory that could explain those decisions.
Thus, the aim of this paper is understand which characteristics of non-financial listed firms affect the decisions taken by managers about how to finance their investments and projects (resort to internal or external funds and resort to short, medium or long term resources) and thus in this way affect the company capital structure. Another purpose of the paper is to investigate which theory among the three presented before (Trade-off theory, Pecking order theory or Market timing theory) better explains the capital structure of firms, given their characteristics.
Initially the objective of this research was to study Portuguese firms, but given the small dimension of the Portuguese market we decided to analyse a market in the Eurozone with a higher number of firm-year observations. Thus, after testing several countries, we select France, because it is the country with the larger number of firm-year observations in the European Economic and Monetary Union (EMU). Given the entire universe of French firms, we chose the subset of non-financial listed companies, so that their financial results and reporting disclosure can be compared with those of the listed companies in the other countries, namely in the European Union.
Therefore, the sample is composed by 436 non-financial French firms, listed in the Paris Stock Exchange for the period since 2007 to 2013 (3052 firm-year observations). In the empirical study we use panel data and Ordinary Least Squares estimations with cross-section fixed effects and year dummy variables.
This paper presents several contributions to the capital structure literature. Firstly, we use a different sample. In most of previous papers the country under study is the United States of America or the United Kingdom, since they are the most developed countries. Additionally, most recently, many studies analyse the developing countries in an attempt to compare their results with those obtained for developed countries. This background points to the importance of analysing a developed European country. We do not choose the entire European Union or a sample including more than one country because in previous literature has been developed the argument that countries’ specific factors can make comparability difficult. So we choose France, after analysing several European countries, because it was the one with the larger number of firm-year
3
observations in EMU. Additionally, we do not found any recent study about capital structure for this country. Thus this is a gap in the literature that we intend to fill with this work.
Secondly, we contribute to the literature by examining a relatively long period of time (since 2007 to 2013), that allows to make relative comparisons not only with other countries but also over time. As it is known the world and, in particular, the European Union since 2008, faces an economic and financial crisis. With our sampling period we were able to investigate if the firms’ characteristics that affect managers’ decisions about how to finance the investments have changed after the financial crisis. We have to mention that we could not extend our sampling period before 2007 to ensure the uniformity of accounting standards (mandatory IFRS adoption in 2005).
Thirdly, in our empirical process to test the models’ sensitivity to the use of debt with different maturities, we use two dependent variables, the total debt divided by the book value of assets and the long term debt divided by the book value of assets. Commonly we should use the long term debt as dependent variable but Cortez & Susanto (2012) conclude that some firms make heavier use of short term debt in their capital structure, so we decided to include the both type of debt.
Finally, we introduce in our regression year dummy variables, instead of the estimation with fixed effects that the most previous works use. These year dummy variables evidence to be statistically significant and allow us to conclude that also the listed firms, in a big European market, were concerned to reduce the debt levels during the years since 2010 to 2013. The most likely explanation for this decrease is the financial and economic crisis.
The results obtained by the empirical work show that there is no a leading theory that can explain the decisions taken by managers of the firms about how to finance its investments and projects. On the one side, the results show that the tangibility of assets and firm size have a positive impact in the firm leverage, as predicted by the Trade-off theory. On the other side, as stated by the Pecking order theory the profitability is negatively correlated with debt; and the firms’ growth opportunities is negatively correlated with leverage, consistent with the Market timing theory. When the sample is divided, to analyse the impact of financial and economic crisis in the capital structure of
4
the firms, we can highlight that before the crisis the variable tangibility presents a negative relation with debt and this relation changes to positive after the crisis. This represents the fact that, for lenders, especially after the financial crisis, tangible assets are considered as important collateral for their lending to firms.
The remainder of the paper proceeds as follows. In section 2 is made a brief literature review of the capital structure theories. In section 3 are presented the hypothesis developed, the variables used in the study, the sample and the methodology of the empirical work. The regressions results are discussed in the section 4. Finally, in section 5 are presented the conclusions of the study with the limitations of this work and suggestions for future researches.
5
2. Literature Review
The optimal capital structure is one of the most debated subjects in corporate finance. The debate attempts to contribute to explain the financing sources used by enterprises to finance their investments (Myers, 2001). The capital structure may be defined as a combination between equity and debt (Akdal, 2010); the optimal capital structure would be the one that maximizes the firm’s value and minimize the weighted average cost of capital.
Although it is one of the most discussed areas, we can say that there is no consensus in the literature. Myers (1984) argues that theories don’t explain the financing behaviour, and so, is presumptuous advising the firms about their optimal capital structure, when the literature is so far to be able to explain the actual decisions.
The modern theory of capital structure starts with the Modigliani and Miller (1958) theorem stating that under a number of specific assumptions capital structure is irrelevant for both the cost of capital and the firm value, which imply that there is no optimal leverage ratio.
In their point of view the amount and the level of debt does not affect the firm value under a number of specific assumptions: if there were no taxes and no transaction costs to borrow or lend; if there were no bankruptcy costs; if the agents could borrow or lend at the risk free rate; if the companies only emit two types of loans: with risk and without risk; if the corporate earnings were fully distribute to shareholders; if all cash flows were perpetual and constant and if all market participants anticipate the same results for companies’ operating results. In other words, the firms’ debt level does not affect their value if the financial markets are efficient and if there is symmetry of information (Modigliani & Miller, 1958).
Gradually, Modigliani and Miller, and many other authors, like Robert Hamada, Merton Miller, Ross, Altman, Jensen, Meckling, for example, began to relax some of these assumptions and created their own theories about the capital structure. In first place they recognized that debt has a preferential treatment in the tax code, so the optimal capital structure would be more leveraged than what is expected. Secondly it was stated that although increasing debt levels means have more tax benefits, it also
6
means high probability of incurring in bankruptcy costs. And finally, it was recognized that there are asymmetric information in financial markets, between investors and managers (Pagano, 2005).
With the relax of this and other assumptions emerged new theories about the optimal capital structure, like, for example, the trade-off theory, the pecking order
theory and the market timing theory.
The trade-off theory studies the capital structure by balancing the benefit of tax against the cost of financial distress, Kraus and Litzenberger (1973), and against agency costs, Jensen and Meckling (1976).
In the perspective of Kraus and Litzenberger (1973) there are a level that maximizes the value market of the firm and this level is achieved with the trade-off between the tax benefits of debt and de financial distress. The firm has a target leverage ratio and move toward it, Myers (1984). In this perspective, the market value of an indebted enterprise should be equal to a market value of a not indebted company plus the present value of the difference between the tax advantages of debt and the bankruptcy costs (Kraus & Litzenberger, 1973).
In another trade-off perspective Jensen and Meckling (1976) and Myers (1977) focused on the agency costs derived from asymmetric information and different lines of interests. These authors were concerned with the conflicts of interests between shareholders and managers, and between managers and bondholders. The agency relationship is a contract where the principal delegate some decisions to the agent and this one agrees to follow the interests of the first one. The relationship between the shareholders and managers is a typically agency relationship (Jensen & Meckling, 1976).
The agency costs result from the fact that the manager can make decisions and investments for their own interests. For Jensen (1986) the use of debt disciplines the managers’ actions, avoiding the use of free-cash flows in inadequate decisions. So the agency costs between managers and shareholders would be reduced with leverage.
The agency costs between managers and bondholders appear when a firm invests in projects with higher risk or does not invest in projects with NPV>0. This problem can
7
be mitigated by limiting the leverage ratio of the firm or with the use of short-term debt (Jensen & Meckling, 1976).
Other line of research is the pecking order theory. This theory states that there is a pecking order among financing sources, if there are information asymmetries in the firm between insiders (shareholders and managers) and outsiders (investors), Myers and Majluf (1984) and Myers (1984). For the authors owing to information asymmetries between insiders and potential investors, firms will prefer retained earnings to debt, short-term debt over long-term debt, and debt over equity. This occurs because use equity under asymmetric information is more expensive, so in this case firms prefer issue debt to avoid selling under-priced securities.
In the pecking order theory there is no target level of leverage, the attraction of interest tax shields and the threat of bankruptcy costs passed to background, Shyam-Sunder and Myers (1999). For the authors the leverage ratio varies with the necessity of external funds. This explains why the most profitable firms are the ones that issue less debt and equity, this firms use their own retain earnings to finance their projects, Myers (2001).
Unlike the pecking order theory, Frank and Goyal (2003) found that when the internal funds are not sufficient to finance investments and projects, firms resort to external funds, but, in this case, debt does not dominate financing through equity.
Finally, we have the Baker & Wurgler (2002) theorem which states that the equity market timing is significant in corporate financial policy. The market timing
theory is based on the assumption that a firm will used equity instead of debt when the
market value is high, and will repurchase equity when market value is low (Baker & Wurgler, 2002). In this work, the authors conclude that market timing has a persistent and large impact in the firm capital structure. The main finding of Baker & Wurgler (2002) is that “low leverage firms are those that raised funds when their market valuations were high, as measured by the market-to-book ratio, while high leverage firms are those that raised funds when their market valuations were low”.
Graham & Harvey (2001), in a CFOs survey about the cost of capital, the capital budgeting and the capital structure, concluded that for managers the stock valuation is very important when they consider the issue of equity. Two-thirds of the executives
8
think that theirs stocks are undervalued by the market and only 3% thinks that they are overvalued. Thus, the choice between debt and equity is also related with the managerial optimism (Heaton, 2000).
As we mentioned above, the country chosen for the study is France. According to Daskalakis & Psillaki (2008) in this country bank loans are very important in the financial structure of the firms. In the empirical work, they concluded that there are a positive relation between size and debt in France, what means that larger firms seem to rely more on debt than smaller firms. They also find that assets structure and profitability are negatively correlated with debt, which is consistent with the pecking order theory. The authors also concluded that, in the case of French firms, and for the capital structure decisions, the company’ effects are more important than the country effects. Kouki & Said (2012) conclude that French firms adjust their debt levels based on the target ration explained by the follows variables: firm size, profitability, growth opportunities and non-debt tax shields. For them it seems that “the level of corporate debt is determined by the resolution of the mechanisms of trade-off between benefits and costs of debt while searching for an optimal debt ratio. Similarly, financial behaviour can be oriented in the light of assessments and evaluations of financing deficit. In this case, the theory of pecking order explains financial behaviour of French firms and would allow managers to better choose between debt and equity.” (Kouki & Said, 2012).
9
3. Research Design
3.1 Hypothesis developmentBased on the assumptions and theories previously presented we formulate the research questions for our study. In the related literature, most authors state that the most relevant firm characteristics that affect the corporate leverage are namely the tangibility of assets, the profitability, the firm size, the growth opportunities and the non-debt tax shield. Many other firm characteristics have also been studied, but in many cases, the authors could not conclude about the relevance of such variables for explaining the capital structure of the firms.
So, in this study are used the five characteristics referred above to analyse the capital structure.
Tangibility of assets
Most of the authors that analyse the determinants that affect the capital structure of the firms, state that the nature of assets affects their leverage level. In the perspective of the trade-off theory the firms that have more tangible assets tend to be more leveraged (Frank & Goyal, 2009). This can be justified because the tangible assets can be used to collateralize the loans, so the firms with more tangible assets tend to issue more debt (Titman & Wessels, 1988). For Rajan & Zingales (1995), who are in consensus with the authors mentioned above, the tangible assets retain more value in liquidation and decrease the agency cost of debt for lenders, so for the authors “the greater the proportion of tangible assets on the balance sheet (fixed assets divided by total assets), the more willing should lenders be to supply loan, and leverage should be higher”.
In the pecking order theory perspective, managers of firms with more tangible assets will prefer to issue debt than equity. This is because the tangible assets are more sensitive to informational asymmetries, have greater value in the event of bankruptcy, and the moral hazard risks decreasing when the company offers tangible assets as collateral for the investor, so the relation between debt and tangibility of assets should be positive (Gaud, et al., 2005).
10
The positive relation between leverage and tangible of assets is supported by many previous empirical studies (Rajan & Zingales, 1995; Titman & Wessels, 1988; Gaud, et al., 2005; Frank & Goyal, 2009 and Akdal, 2010).
Thus, the hypothesis under study is as follows:
H1: Tangibility is positively correlated with debt.
Profitability
There are theoretical conflicts about the impact that profitability has in capital structure decisions of companies. For Myers & Majluf (1984) there is a negative relation between profitability and leverage. This is because the managers prefer internal funds to the external ones, so the most profitable firms should have more retain earnings, what means that, under the pecking order theory, the most profitable firms are less indebtedness, because have more internal funds to finance their projects.
The trade-off theory explores capital structure by balancing the benefits of tax against the costs of financial distress. For Frank & Goyal (2009) the most profitable firms should use more debt because for those companies interest tax shields are more valuable and those companies face lower costs of financial distress. This means that, for this theory, the expected relation between profitability and debt should be positive. Additionally, Gaud, et al. (2005) noted that “if past profitability is a good proxy for future profitability, profitable firms can borrow more as the likelihood of paying back the loans is greater”.
The empirical studies provided by Rajan & Zingales (1995) and Gaud, et al. (2005) support the pecking order theory perspective, high profitable firms have less debt in their capital structure because they prefer to use internal funds than debt or equity.
Thus, the hypothesis under study is as follows:
11
Firm size
The dimension of the firm is another determinant that previous literature argues that affect capital structure.
In the trade-off perspective firm size have a positive relation with leverage. Frank & Goyal (2009) argue that larger and more mature firms are more diversified and face a lower default risk, so it is expected that they have more debt in their capital structure. For Rajan & Zingales (1995) the relationship between firm size and debt is ambiguous. This is because, larger firms are more diversified and so the probability of bankruptcy is lower, what meaning that size has a positive impact on leverage. Nevertheless, and in the pecking order perspective, in larger firms is also expected that the outsiders investors are better informed, which increases the preference for issue equity instead of debt for the managers of those firms.
In Graham, et al. (1998) empirical work the results allow to conclude that firm size should predict more debt in capital structure. The authors state that this is due to the fact that larger firms are more stable, or less volatile, the cash-flows are more diversified and can exploit scale economies in issuing securities. Instead, the smaller firms, because of the information asymmetries and the higher cost for obtaining external funds, should be less leveraged.
For Titman & Wessels (1988) small firms should be more leveraged than large ones, and should issue short-term debt instead long term debt. The justification is that small firms pay much more to issue new equity and long-term debt, so the short-term debt is the best alternative for small firms because of the lower fixed costs of this alternative. In the empirical work, these authors find a negative relation between short-term debt and firm size, which supports their arguments about the impact of firm size in the capital structure.
In their empirical work Akdal (2010), Baker & Wurgler (2002) and Sayilgan, et al. (2011) found that firm size affects positively the level of debt. Rajan & Zingales (1995) state that the effect of size on debt is unclear, despite that, except for Germany, the others countries exhibit a positive relationship between the two variables.
12
Thus, the hypothesis under study is as follows:
H3: Firm size is positively correlated with debt.
Growth opportunities
Myers (1977) state that the most profitable firms are more likely to discards profitable investments opportunities. For Rajan & Zingales (1995) the companies that expect high future growth should issue equity rather than debt, to finance their investments.
For the trade-off perspective, growth is negatively correlated with leverage because growing companies believe that their manoeuvrability is limited when use debt to finance their investments. And otherwise, creditors also don’t like to lend to growing companies because these firms undertake a lot of risk projects and so the bankruptcy risks are higher (Cortez & Susanto, 2012).
Under the pecking order theory, firms with more investments, or growth opportunities, should accumulate more debt over time, because they need larger amounts of funds (Frank & Goyal, 2009). Gaud, et al. (2005) state that for those firms with strong financing needs, it is important to have a close relationship with banks, because this relation decreases informational asymmetry problems and they will be able to have access to debt financing more easily.
As a proxy for growth opportunities, the market-to-book ratio is the instrument most commonly used as we can see in Baker & Wurgler (2002), Rajan & Zingales (1995) and Frank & Goyal (2009) works about capital structure.
The market timing theory state that a company with a high market-to-book ratio should reduce leverage to exploit equity mispricing through equity issuances (Frank & Goyal, 2009). Baker & Wurgler (2002) conclude that companies tend to use equity instead of debt when their market valuation is high, and tend to repurchase equity when their market value is low. Through empirical analysis, the authors conclude that the market-to-book ratio, a proxy for growth opportunities, is negatively correlated with leverage.
13
For Rajan & Zingales (1995) this negative correlation between growth and debt is driven by firms with high market-to-book ratios, because are those companies tend to issue shares when their stock price is high relative to earnings or book value. This implies that such correlation is driven by companies who issue high amount of equity, i.e., those that have high market-to-book ratios.
Thus, the hypothesis under study is as follows:
H4: Growth opportunities are negatively correlated with debt.
Non-debt tax shield
Interest tax shields are not the only way for decreasing corporate tax burdens. For example tax deductions for depreciations and investments tax credits are alternatives for the tax benefits of debt financing (DeAngelo & Masulis, 1980).
The trade-off theory predicts that non-debt tax shields and leverage are negatively correlated, because to take benefits of higher tax shields, companies will issue more debt when tax rates are higher (Frank & Goyal, 2009). For Cortez & Susanto (2012) non-debt tax shields given by depreciation expense could be a substitute for debt tax shield, so the tax reducing property from debt is no longer needed.
Titman & Wessels (1988) could not confirm the significance of the effect of non-debt tax shields on the non-debt level of the companies. And, some literature finds an inverse relation between the two variables. Bradley, et al. (1984) found a positive relation between leverage and non-debt tax shields, suggesting that firms that invest severely in tangible assets, and so generate greater levels of depreciation and tax credits, tend to have higher levels of debt in capital structure. Graham (2005) has an explanation for this positive relation. He argues that the use of depreciation and investment tax credits, as a form of non-debt tax shields may be unwise because these variables are positively correlated with profitability and investment. What happens is that profitable firms invest heavily and also borrow to finance those investments. Certainly, this will induce a positive correlation between leverage and non-debt tax shields.
According to the theory and the empirical results of DeAngelo & Masulis (1980), Cortez & Susanto (2012) and Miguel & Pindado (2001), for example, we can say that it is expected that non-debt tax shields impact negatively firms’ debt.
14
Thus, the hypothesis under study is as follows:
H5: Non-debt tax shields are negatively correlated with debt.
3.2 Variables
In this study, the dependent variables are the firms’ debt. Many ratios of debt were used in the previous literature to investigate the relationship between capital structure and the firms’ characteristics. For example, the dependent variable in the work of Rajan & Zingales (1995) is expressed as the ratio of total debt to net assets, in which the net assets are stated as the total assets less accounts payable and other liabilities. Cortez & Susanto (2012) used the leverage, the ratio of total debt divided by total equity, like Sayilgan, et al. (2011) used to measure the financial leverage.
Many other authors used more than one ratio to measure the corporate debt in the same investigation. For example, Chen (2004) measure debt as the ratio of book value of total debt divided by total assets, and the ratio of book value of long term debt divided by total assets. Frank & Goyal (2003) defined leverage as the ratio of total debt or long term debt divided by the book value of assets or the market value of assets (four measures). Titman & Wessels (1988), initially, have used six measures of financial leverage, the long term, short term and the convertible debt divided by the market and the book values of equity. But the data constraints forced them to measure the debt only in terms of book values.
In this study, we use two dependent variables and they are measured as the ratio of total debt divided by the book value of total assets and as the ratio of long term debt divided by the book value of total assets. The use of two variables allow us testing the models’ sensitivity to the use of debt with different maturities considering that some firms make heavier use of short term debt in their capital structure, Cortez & Susanto (2012).
TDEBTi,t = Total Debti,t / Book Value of Total Assetsi,t , firm i in year t LDEBTi,t = Long Term Debti,t / Book Value of Total Assetsi,t , firm i in year t
The focus in the book values rather than the market values of assets is because as stated by Titman & Wessels (1988), in reference to Bowman (1980), the cross-sectional
15
correlation between the market and the values of indebtedness is large. So the misspecification of using book values rather than market values of assets is insignificant.
Several determinants of firms’ capital structure were analysed in the previous literature. In this study were selected five determinants that those studies concluded that affect the capital structure of firms. They are as follows: tangibility of assets, profitability, firm size, growth opportunities and non-debt tax shields. The classification of these independent variables is provided below.
Tangibility of assets
In order to test de first hypothesis of this study, the tangibility of assets [TANG] is measure as the ratio of tangible fixed assets divided by total assets in consistent with the ratios used by Rajan & Zingales (1995), Akdal (2010) and Cortez & Susanto (2012).
TANGi,t = Tangible Fixed Assetsi,t / Total Assetsi,t , of the firm i in year t
Profitability
Various proxies could be used to measure firms’ profitability. For example, Titman & Wessels (1988) employed as a measure of profitability the ratios of operating earnings over sales and operating earnings over total assets. Others authors, used the ratio of earnings before interest, tax and depreciation (EBITDA) divided by total assets (Gaud, et al., 2005; Rajan & Zingales, 1995; Cortez & Susanto, 2012).
In this work, it will be used the return on total assets (ROA) as measured of profitability [PROF], which is calculated as the ratio of earnings before interest and tax (EBIT) divided by total assets (Chen, 2004; Frank & Goyal, 2009; Akdal, 2010; Sayilgan, et al., 2011).
PROFi,t = EBITi,t / Total Assetsi,t , of the firm i in year t
Firm size
To represent the firm’ size, the previous literature have been used different indicators, like the natural logarithm of total assets (Chen, 2004 and Frank & Goyal, 2003), the natural logarithm of the total revenues (Cortez & Susanto, 2012) and the
16
natural logarithm of net sales (Rajan & Zingales, 1995; Titman & Wessels, 1988 and Gaud, et al., 2005). In present study, the firm size [SIZE] is measure as the natural logarithm of net sales.
SIZEi,t = Log Net Salesi,t , of the firm i in year t
Growth opportunities
Many different measures have been used in the literature as a proxy for growth opportunities. For example, Titman & Wessels (1988) used the capital expenditures over total assets, the percentage change in total assets and the research and development expenditures over sales, as indicator of firms’ growth opportunities.
The most commonly ratio used as a proxy for growth opportunities is the market-to-book ratio, as we can see in the works of Baker & Wurgler (2002), Rajan & Zingales (1995) and Frank & Goyal (2009).
So in this study, growth opportunity [GROW] is measure as a ratio of market value of equity to the book value (Market-to-book ratio).
GROWi,t = Market Value of Equityi,t / Book Value of Equityi,t , of the firm i in
year t
Non-debt tax shields
As a measure of non-debt tax shields [NDTS], most of the literature uses the depreciation and amortisation expenses divided by total assets (Titman & Wessels, 1988; Chen, 2004 and Cortez & Susanto, 2012). Titman & Wessels (1988) also have as indicator of the non-debt tax shields two more ratios: the investment tax credits over total assets and the direct estimate of non-debt tax shields over total assets.
In the present study, the ratio used is the total depreciation and amortisation expenses divided by total assets
NDTSi,t = Total Depreciation and Amortisation Expensesi,t / Total Assetsi,t , of
17
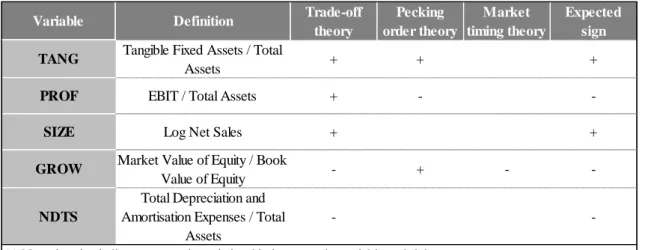
Table 1: The definition of the independent variables and expected signs
3.3 Sample
The main objectives of this study is examine what French firms’ characteristics affect their managers’ decisions about the capital structure, and understand what theory better explains those decisions. To achieve these purposes we select a sample of companies listed in the Euronext Paris. The financial and market information relative to those firms was extracted from Amadeus database.
It is worth noting that initially the objective of the work was to study Portuguese firms, but given the small dimension of the Portuguese market we decided to analyse a market in the Eurozone with a higher number of firm-year observations. We do not select the entire European Union, or a sample including more than one country, because in the previous literature has been developed the argument that countries’ specific factors can make comparability difficult. Thus, after testing several countries, we select France, because it is the country with the larger number of firm-year observations in the European Economic and Monetary Union (EMU). Considering the entire universe of French firms, we chose the subset of non-financial listed companies, so that their financial results and reporting disclosure can be compared with those of the listed companies in the other countries namely in the European Union.
From the initial sample have been removed the firms that failed to have complete information for at least five consecutive years and, also, companies that report negative
Variable Definition Trade-off theory Pecking order theory Market timing theory Expected sign
TANG Tangible Fixed Assets / Total
Assets + + +
PROF EBIT / Total Assets + -
-SIZE Log Net Sales + +
GROW Market Value of Equity / Book
Value of Equity - + -
-NDTS
Total Depreciation and Amortisation Expenses / Total
Assets
-
-(-) Negative sign indicates a negative relationship between the variable and debt (+) Positive sign indicates a positive relationship between the variable and debt
18
accounting equity for at least one year. Finally, were excluded from the sample the 5% largest and smallest companies, to eliminate outliers.
Thus, the final sample is composed by 436 companies for the years since 2007 to 2013 (3052 firm-year observations).
As regards the sample period, we choose the sampling period beginning in 2007 because, in the European Union, in 2005 all listed companies were required to adopt the IFRS standards and if we choose data before this year our results could be impacted by this change. Additionally, in the Amadeus database for 2005 and 2006 there are many missing observations, so we decided to initiate our sample period in 2007 and end it in 2013, which was the last year with available information.
Amadeus’ database do not have information for companies in the financial and insurance sectors, because their capital structure is subject to regulatory norms and prudential rules, so it was not be necessary to remove this type of entities from our sample.
3.4 Methodology
The sample contains data across firms and over time, so our sample is structure in panel data. Some of previous research argues that estimations based on panel data have some advantages relative to those based on cross-sectional or time series data. For example, because the panel data involve at least two dimensions leads to a greater number of observations in regression estimations. The fact that panel data usually contain more degrees of freedom and more sample variability the efficiencies of econometric estimates increase, that is, the accuracy of the estimators is higher, than with cross-sectional data or time series data. Other advantage of panel data is that allows controlling the impact of omitted variables, for the fact that have information for both the intertemporal dynamics and the individuality of the entities. The unobserved variables can lead to seriously biased inference, so the panel data mitigate endogeneity problems related to omitted variables.
The general estimating equation could be written as follows: Yi,t = β0 + β1 X1,t + β2 X2,t + β3 X3,t + … + βi Xi,t + ei,t
19 Where:
Yi,t – represents the dependent variable;
X1,t, X2,t, X3,t , … , Xi,t – represents the independent variables;
β0, β1, β2, β3, … , βi - represents the regression coefficients;
ei,t – represents the error of the model, disturbance term.
The method used to estimate the regressions are ordinary least squares (OLS). Initially we estimate the following regressions:
TDEBTi,t = β0 + β1 TANGi,t +β2 PROFi,t + β3 SIZEi,t + β4 GROWi,t + β5 NDTSi,t + ei,t
LDEBTi,t = β0 + β1 TANGi,t +β2 PROFi,t + β3 SIZEi,t + β4 GROWi,t + β5 NDTSi,t + ei,t
For example, with the previous estimation of the first equation, with no effects specification, the determination coefficient (R2) was 18.96%, that represents the explanatory capacity of the model, and the variables Tangibility of assets (TANG), Profitability (PROF), Firm size(SIZE) and Growth opportunities (GROW) were significant.
To analyse the time series effects we decide introduce six year dummy variables to test differences in intercept terms or slope coefficients between periods. With this change we can conclude that the dummies are significant in 2011, 2012 and 2013, and in these years the debt decreases relatively to 2007, probably because of the economic crisis. Our R2 is now 19.30%, a little higher than the previous. The estimation with the year dummy variables or the estimation with year fixed effects have approximately the same results so we decide to estimate the regressions with time fixed effects using the year dummy variables, because these variables allows to analyse whether debt levels varied from year to year due to different reasons than the givens by the explanatory variables (other external factors can affect the firms debt level, like for example the economic crisis).
As regards to cross-section effects, to decide between using fixed effects or random effects, we run the Hausman test. The null hypothesis was rejected at 1% level, so we can conclude that the random effects model is not appropriate and the fixed
20
effects model must be used. With the introduction of the cross-section fixed effects the explanatory capacity of the model increase, the R2 rose from 19.30% to 89.28%.
We also had the concern to study the impact of the heteroscedasticity in the model, in order to know if the use of the White heteroscedasticity-robust standard errors is applicable. So, we run the Breusch-Pagan test, using the initial data without the panel data structure. The test allowed reject that the conditional variance of the error term is constant. Therefore, we estimate the equation using the White cross-section coefficient covariance method and we conclude that the introduction of the White heteroscedasticity-robust standard errors do not improve the estimation. Given that we kept the estimation with the ordinary coefficients.
Under the previous conclusions, the panel data regressions used to the research hypothesis will take the following forms:
(1) TDEBTi,t = β0 + β1 Y8i,2008 + β2 Y9i,2009 + β3 Y10i,2010 + β4 Y11i,2011 + β5 Y12i,2012 + β6
Y13i,2013 + β7 TANGi,t +β8 PROFi,t + β9 SIZEi,t + β10 GROWi,t + β11 NDTSi,t + ei,t
(2) LDEBTi,t = β0 + β1 Y8i,2008 + β2 Y9i,2009 + β3 Y10i,2010 + β4 Y11i,2011 + β5 Y12i,2012 + β6
Y13i,2013 + β7 TANGi,t +β8 PROFi,t + β9 SIZEi,t + β10 GROWi,t + β11 NDTSi,t + ei,t
In the previous regressions, i refers to firm (Panel variable: Companies) and t to time (Time variable: Year).
The regressions are used to determine the type of relationship between the determinants of capital structure and the firms’ leverage. The hypotheses under study is confirmed when the explanatory variable in question is statistically significant and the sign is in accordance with the theoretical formulation.
21
4. Empirical results and Discussion
In this chapter we present and discuss the empirical results of the study. Initially in the section 4.1, univariate analysis, we proceed with the analysis of the descriptive statistics and the Pearson correlation coefficients between the variables used in the regressions. In the section 4.2, multivariate analysis, we analyse the regression results in the context of the theories discussed above about the capital structure of the firm, namely the trade-off theory, the pecking order theory and the market timing theory.
4.1 Univariate Analysis
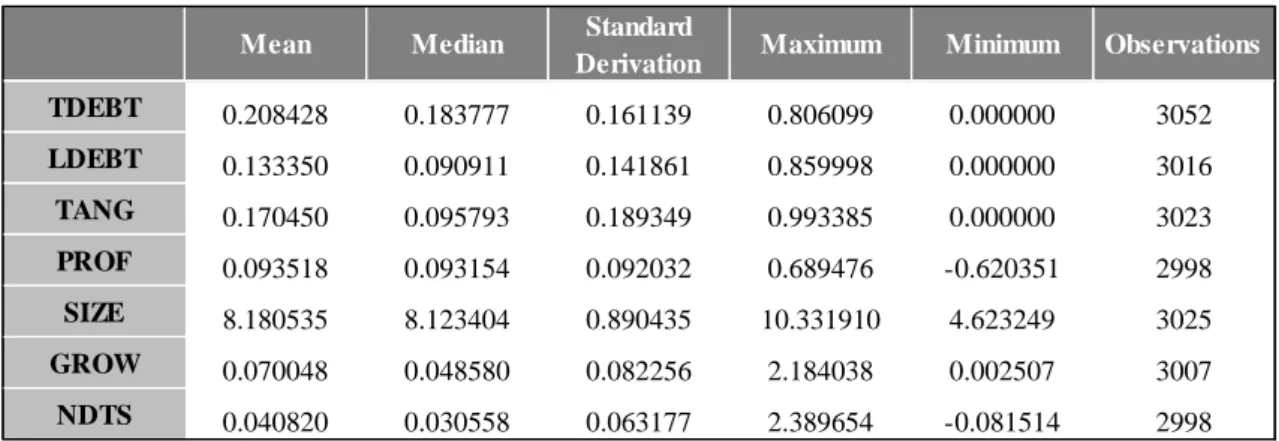
In the table 2 are presented the descriptive statistics (Mean, Median, Standard Derivation, Maximum value, Minimum value and Number of observations) for the years from 2007 to 2013 for the dependent variables (Total debt and Long-term debt) and for the explanatory variables (Tangibility, Profitability, Size, Growth opportunities and Non-debt tax shields) use in the equations (1) and (2).
Table 2: Descriptive statistics
Regarding the dependent variables, in average the ratio of total debt is 20.84% and the ratio of long-term debt is 13.34%. That means that on average, in French non-financial listed firms, the borrowed funds do not have a significant burden in the total of shareholder funds and liabilities of the company. It should be noted that, in the sample we have companies that have no debt in their structures, because in the table 2 the total debt presents a minimum value of zero.
Concerning the independent variables, the volatility of Tangibility, Growth opportunities and Non-debt tax shields is slightly high because the standard derivation
Mean Median Standard
Derivation Maximum Minimum Observations
TDEBT 0.208428 0.183777 0.161139 0.806099 0.000000 3052 LDEBT 0.133350 0.090911 0.141861 0.859998 0.000000 3016 TANG 0.170450 0.095793 0.189349 0.993385 0.000000 3023 PROF 0.093518 0.093154 0.092032 0.689476 -0.620351 2998 SIZE 8.180535 8.123404 0.890435 10.331910 4.623249 3025 GROW 0.070048 0.048580 0.082256 2.184038 0.002507 3007 NDTS 0.040820 0.030558 0.063177 2.389654 -0.081514 2998
22
is greater than the mean of the variables. Nevertheless, the independent variables Profitability and Size have a lower volatility.
It should be noted that to avoid biased data all the explanatory variables are linearized. The variables Tangibility, Profitability, Growth opportunities and Non-debt tax shields are ratios whose denominator is total assets. As regards to the variable Size we use the natural logarithm of sales.
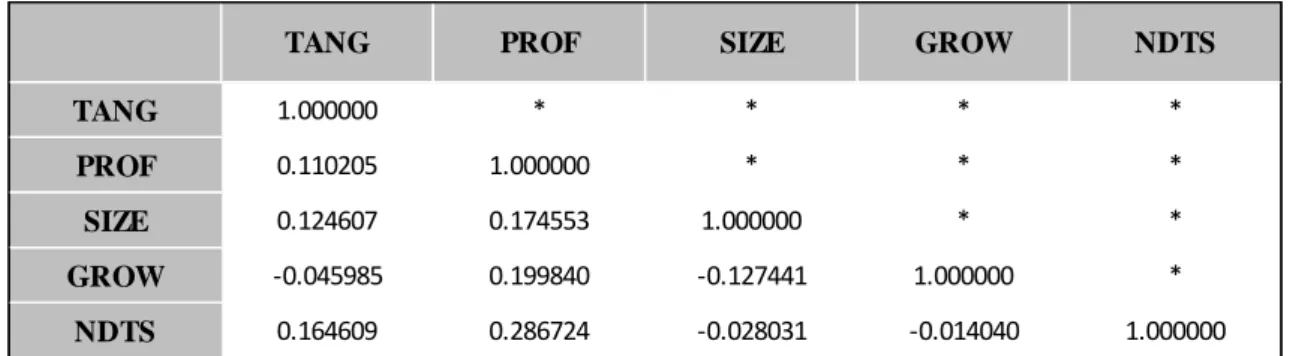
In the table 3 is presented the correlation matrix between the explanatory variables used in equations (1) and (2).
Table 3: Pearson correlation coefficients between variables
As can be seen in the table 3 the correlations between the independent variables are quite small showing that there are no expected problems of collinearity in the estimations. When the correlation coefficients are less than 0.3 we do not expect to have collinearity problems (Aivazian, et al., 2005).
4.2 Multivariate Results
The main objective of this paper is to identify the determinants of the companies that affect their capital structure, in particular for non-financial French companies listed in the Euronext Paris, during the years since 2007 to 2013. For this purpose, we proceed to the estimation of the regressions (1) and (2). The results of this estimation are presented in the table 4 below.
The estimation of the panel data regression has been carried out using the ordinary least squares (OLS) estimation, with cross-section fixed effects and year dummy variables. To study the relevance of the models in explaining the dependent variables we analyse the F-statistic that presents the values 47.2178 and 36.4256, respectively for the equations (1) and (2), what means that at the 1% significance level
TANG PROF SIZE GROW NDTS
TANG 1.000000 * * * *
PROF 0.110205 1.000000 * * *
SIZE 0.124607 0.174553 1.000000 * *
GROW -0.045985 0.199840 -0.127441 1.000000 *
23
the independent variables affect the debt level, i.e., the models have explanatory capacity. So we can conclude by the relevance of both models.
The determination coefficient (R2), which measures the adjustment quality of the regression model to the data, is about 89.28% and 86.53%, respectively for equations (1) and (2). This means that the models (1) and (2) have an explanatory capacity of about 89.28% and 86.53%, respectively, of the variation of the debt level.
In the results present in the table 4 we can see that when the dependent variable is the Total Debt (TDEBT) all explanatory variables are significant at 1% level. When the dependent variable is the Long-term Debt (LDEBT) the variables Growth opportunities (GROW) and Non-debt tax shields (NDTS) lose their significance, but the remaining variables are significant at 1% level.
As expected by the trade-off theory and by the pecking order theory the variable Tangibility of assets (TANG) presents a positive sign in both equations, meaning that the firms that have more tangible assets tend to be more leverage, given that, the tangible assets can be used to collateralize loans (Titman & Wessels, 1988). In the first equation, if the firms’ tangible assets increase by 1% then total debt increases 9.32‰. In case of long-term debt it increases 6.66‰ if the tangible assets increase 1%. In conclusion, the tangibility of assets has a significant and positive impact in firms’ debt level, as stated by the trade-off theory and by the pecking order theory. This relationship supports Hypothesis 1.
The variable Profitability (PROF) is significant and presents a negative sign in both equations, as expected by the pecking order theory. This is explained by previous authors, and particularly by Myers & Majluf (1984), because the more profitable firms have more internal funds to finance their investments, and managers always prefer internal funds to external ones, so the most profitable firms should be less indebted, because they have more internal funds to finance themselves. In the particular case of French firms, we can see that when the variable PROF increases 1%, TDBET decreases about 23.00‰ and LDEBT decreases about 10.89‰. In conclusion, the profitability has a significant and negative impact in the debt level of the firms, as stated by the pecking
24 Table 4: Panel data regression coefficients
Independent Variables TDEBT (1) LDEBT (2) β0 -0.1951 ** (-2.4555) -0.1739 ** (-2.2330) Y08 0.0112 *** (2.6946) 0.0063 (1.5527) Y09 0.0053 (1.3053) 0.0087 ** (2.1895) Y10 -0.0087 ** (-2.1459) -0.0012 (-0.3001) Y11 -0.0155 *** (-3.7570) -0.0080 ** (-1.9738) Y12 -0.0187 *** (-4.4475) -0.0067 (-1.6391) Y13 -0.0131 *** (-3.1025) -0.0063 (-1.5235) TANG 0.0932 *** (4.0363) 0.0666 *** (2.9459) PROF -0.23001 *** (-10.3439) -0.1089 *** (-4.9932) SIZE 0.0505 *** (5.17647) 0.0376 *** (3.9333) GROW -0.0708 *** (-2.8119) -0.0265 (-1.0731) NDTS 0.1466 *** (3.3073) 0.0170 (0.3915) Number of observations 2975 2975 R2 0.8928 0.8653 Adjusted R-squared 0.8739 0.8416 F-statistic 47.2179 *** 36.4256 ***
Note: This table summarizes the results of OLS estimation of panel data regressions, estimated for 436 French companies during the 2007-2013 sample period. Coefficient values are reported as percentages with t-statistics at the second row. The dependent variables are TDEBT and LDEBT. TDEBT=Total debt divided by book value of total assets. LDEBT=Long-term debt divided by book value of total assets. TANG=Tangible fixed assets divided by total assets. PROF=EBIT divided by total assets. SIZE=Natural logarithm of net sales. GROW= Maker value of equity divided by the book value of equity. NDTS=Depreciation and amortisation expenses divided by the total assets. The two equations include year dummies variables. *, ** and *** denote coefficients significance at 10%, 5% and 1% level, respectively.
25
As expected by the trade-off theory, the variable firm size (SIZE) has a significant and positive impact in the firms’ leverage. In the first equation, if the firm’ size increase 1% the total debt should increases 5.05‰, and, in case of long-term debt, it should increases 3.76‰. This impact in firms’ leverage is explained by Frank & Goyal (2009) because the largest and more mature firms are more diversified and face a lower default risk, so it is expected that they have more debt in their capital structure, relatively to small companies that pay much more by issuing new equity and for long-term debt, so short-long-term debt is the best alternative for small firms because of the lower fixed costs of this alternative (Titman & Wessels, 1988). In conclusion, the firm size has a significant and positive impact in firms’ debt level, as stated by the trade-off theory. This relationship supports Hypothesis 3.
The variable Growth Opportunities (GROW) is significant only in the equation (1). In this equation, GROW has a significant and negative impact, when this variable increases 1% the total debt decreases 7.08‰. Relative to the long-term debt, the variable GROW also has a negative impact, but it is not statistically significant. This negative relation is consistent with the Market timing theory that states that companies tend to issue equity instead of debt when their market valuation is high (when the variable GROW increases, given that this variable represent the market-to-book ratio), and tend to repurchase equity when their market value is low (Baker & Wurgler, 2002). Those authors also concluded that the market-to-book ratio, a proxy for growth, is negatively correlated with leverage. In conclusion, the growth opportunity has a significant and negative impact in firms’ total debt level, as stated by the market timing theory. This relationship supports Hypothesis 4.
Unexpectedly, the variable Non-debt tax shields (NDTS) has a positive and significant impact in the total firm debt level. For the long-term debt, the variable also presents a positive impact, but statistically is not significant. In the first equation, when the NDTS increases 1% the total debt should increase 14.66‰. The trade-off theory predicts that non-debt tax shields and leverage should be negatively correlated, because non-debt tax shields given by depreciation expense could be a substitute for debt tax shield, so the tax reduction given by debt is no longer needed (Cortez & Susanto, 2012). Nevertheless, the relation obtained from the equation is positive and is explained by Bradley, et al. (1984) because the firms that invest heavily in tangible assets, and thus
26
generate higher levels of depreciation and tax credits, tend to have higher levels of debt in capital structure, since they need resources to finance these investments. Also Graham (2005) argues that use of depreciation and investment tax credits, as a form of non-debt tax shields may be unwise because these variables are positively correlated with the profitability and the investment; those profitable firms invest heavily and also borrow to finance those investments. In conclusion, the non-debt tax shields have a significant and positive impact in firms’ total debt level, in opposite with the predicted by the trade-off theory, so we have to reject the Hypothesis 5.
From this study we can conclude that we have not a leading theory that can explain the firms’ decisions about its capital structure, because depending on the variable the relationship is supported by a different theory. What can be concluded is that the trade-off theory can explain the relationship between the Tangibility of assets and Debt and between the Firm size and Debt. The Pecking order theory can explain the relationship between the Profitability of the company and the level of debt in its capital structure. Finally, the Market timing theory can explain the relationship between the Growth opportunities of firm and the Leverage. The relationship between the Non-debt tax shield and Debt is not explained by any of those three theories.
With the introduction of the year dummy variables we are able to analyse whether debt levels vary from one year to another due to different reasons than those represented by the five explanatory variables.
In the equation (1) we can see that only the year dummy Y09 is not significant. The dummy Y08 is positive and statistically significant, what means that comparing with 2007 in 2008 the level of total debt increases in non-financial listed French firms. The dummies Y10, Y11, Y12 and Y13 are statistically significant and present a negative sign, meaning that in those years the total debt decreases comparing with 2007. These results show a turning point in the evolution of total debt, maybe triggered by financial and economic crisis. Before the economic crisis the debt increases relative to the previous year and after the economic crisis (in this case from 2010 to 2013) the debt level of the firms decreases comparing with previous years.
In the equation (2) only the 2009 and 2011 year dummy variables are significant. The first have a positive sign and the second one a negative sign, i.e., in 2009 the
long-27
term debt level increase comparing with 2007 and in 2011 the long-term debt level decrease comparing with the same year, for French non-financial listed companies. With these regression results we cannot set a standard for the evolution of the debt.
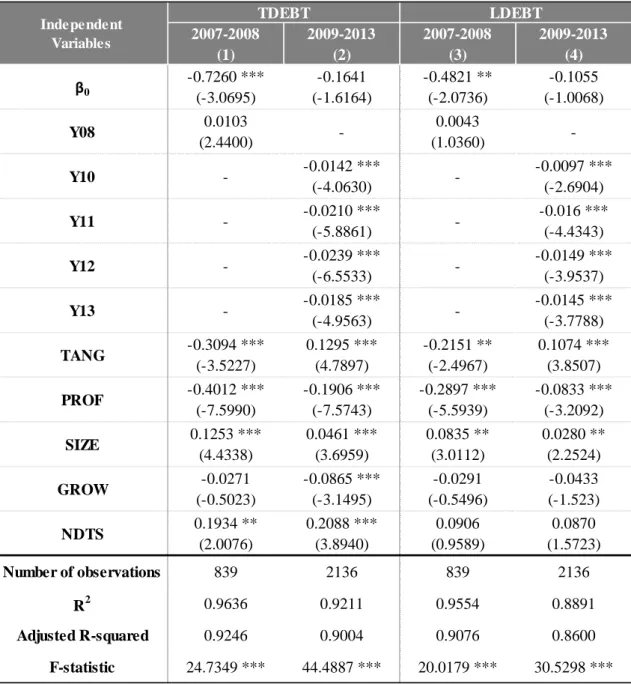
4.2.1 Financial Crisis
Given that in the period since 2007 to 2013 the world went through a financial and economic crisis, it is interesting to study if the variables presented above suffered any change in the impact that they have in the firms’ capital structure. To achieve this purpose, the sample was split in two periods, the period before the financial crisis (2007 to 2008) and the period during the financial crisis (2009 to 2013). The table 5 below present the empirical results.
From these results, we can highlight that before the financial crisis the variable Tangibility of assets had a negative and significant impact, and this impact become positive and also significant after the financial crisis. This represents the fact that, for lenders, especially after the financial crisis, the tangible assets are a very important guarantee for loans. So the firms that did not have those guarantees have more difficulty to obtain loans.
The other variables do not have a significant change that enable us to conclude that the behaviour changes after the economic and financial crisis.
Once more is very interesting analyse the results given by the year dummy variables. In the both cases, for total debt and for long-term debt, before the financial crisis, the year dummy Y08 is not statistically significant, but is positive, which would mean that in 2008 the debt level increase comparing to 2007. In the regressions after the financial crisis, both for total debt and for long-term debt, all the year dummies are negative and statistically significant. This means that after the financial crisis, debt level of the firms starts to decrease due to different reasons than the given by the five explanatory variables. One of these reasons certainly is the economic and financial crisis that the Europe crossed in the last years. It is also interesting to note that this negative impact in debt level from 2010 to 2012 increase. In 2013 this impact is also negative but this negative impact starts to decrease, which may represent the beginning of the end of the economic crisis.
28 Table 5: French financial crises
2007-2008 (1) 2009-2013 (2) 2007-2008 (3) 2009-2013 (4) β0 -0.7260 *** (-3.0695) -0.1641 (-1.6164) -0.4821 ** (-2.0736) -0.1055 (-1.0068) Y08 0.0103 (2.4400) -0.0043 (1.0360) -Y10 - -0.0142 *** (-4.0630) --0.0097 *** (-2.6904) Y11 - -0.0210 *** (-5.8861) --0.016 *** (-4.4343) Y12 - -0.0239 *** (-6.5533) --0.0149 *** (-3.9537) Y13 - -0.0185 *** (-4.9563) --0.0145 *** (-3.7788) TANG -0.3094 *** (-3.5227) 0.1295 *** (4.7897) -0.2151 ** (-2.4967) 0.1074 *** (3.8507) PROF -0.4012 *** (-7.5990) -0.1906 *** (-7.5743) -0.2897 *** (-5.5939) -0.0833 *** (-3.2092) SIZE 0.1253 *** (4.4338) 0.0461 *** (3.6959) 0.0835 ** (3.0112) 0.0280 ** (2.2524) GROW -0.0271 (-0.5023) -0.0865 *** (-3.1495) -0.0291 (-0.5496) -0.0433 (-1.523) NDTS 0.1934 ** (2.0076) 0.2088 *** (3.8940) 0.0906 (0.9589) 0.0870 (1.5723) Number of observations 839 2136 839 2136 R2 0.9636 0.9211 0.9554 0.8891 Adjusted R-squared 0.9246 0.9004 0.9076 0.8600 F-statistic 24.7349 *** 44.4887 *** 20.0179 *** 30.5298 *** Independent Variables TDEBT LDEBT
Note: This table summarizes the results of OLS estimation of panel data regressions, estimated for 436 French companies during the 2007-2013 sample period. Coefficient values are reported as percentages with t-statistics at the second row. The dependent variables are TDEBT and LDEBT. TDEBT=Total debt divided by book value of total assets. LDEBT=Long-term debt divided by book value of total assets. TANG=Tangible fixed assets divided by total assets. PROF=EBIT divided by total assets. SIZE=Natural logarithm of net sales. GROW= Maker value of equity divided by the book value of equity. NDTS=Depreciation and amortisation expenses divided by the total assets. The two equations include year dummies variables. *, ** and *** denote coefficients significance at 10%, 5% and 1% level, respectively.
29
5. Conclusions
After the seminal work of Modigliani e Miller (1958), which states that capital structure is irrelevant for both the cost of capital and firm value, many other studies have analysed the characteristics of companies that affect the decisions of manager about the firms’ capital structure. Models of trade-off study capitals structure by balancing the benefit of tax against the cost of financial distress, Kraus and Litzenberger (1973), and against agency costs, Jensen and Meckling (1976). Another of research argues that there is a pecking order among financing sources, Myers and Majluf (1984). Finally, a different body of literature, which is known as market timing theory, suggests that firms issue shares when the market is high and repurchases when the market is low, Baker and Wurgler (2002).
The aim of this paper is to understand which characteristics of French non-financial listed firms affect the decisions taken by managers about how to finance their investments and projects (internal or external funds; short, medium or long term resources) and thus in this way affect the company capital structure. Other purpose of the paper is investigate what theory among the three presented in the paper (Trade-off theory, Pecking order theory or Market timing theory) can explain the capital structure of firms, given their characteristics.
To achieve the aim of the paper we chose the following explanatory variables, which are consistent with the previous literature: tangibility of assets, profitability, firm size, growth opportunities and non-debt tax shields. As dependent variables are used the Total Debt and the Long-term Debt. The method used to estimate the regressions is ordinary least squares (OLS) with cross-section fixed effects and year dummy variables. The sample is composed by 436 French companies, listed in the Euronext Paris, for the years since 2007 to 2013 (3052 observations). Additionally, the data sample was subdivided into two periods (pre-crisis period, from 2007 to 2008 and post crisis period, from 2009 to 2013) to capture the effects of the financial and economic crisis in the firms’ determinants.
The results obtained by the empirical work show that there is no a leading theory, that can explain the decisions taken by its managers about how to finance its investments and projects. We can highlight that the tangibility of assets and the firm