Full Terms & Conditions of access and use can be found at
http://www.tandfonline.com/action/journalInformation?journalCode=tjom20
Journal of Maps
ISSN: (Print) 1744-5647 (Online) Journal homepage: http://www.tandfonline.com/loi/tjom20
Classification of landforms in Southern Portugal
(Ria Formosa Basin)
Fernando M. G. Martins, Helena M. Fernandez, Jorge M. G. P. Isidoro, Antonio
Jordán & Lorena Zavala
To cite this article: Fernando M. G. Martins, Helena M. Fernandez, Jorge M. G. P. Isidoro, Antonio Jordán & Lorena Zavala (2016) Classification of landforms in Southern Portugal (Ria Formosa Basin), Journal of Maps, 12:3, 422-430, DOI: 10.1080/17445647.2015.1035346
To link to this article: https://doi.org/10.1080/17445647.2015.1035346
© 2015 Fernando M. G. Martins View supplementary material
Published online: 28 Apr 2015. Submit your article to this journal
Article views: 424 View related articles
SCIENCE
Classification of landforms in Southern Portugal (Ria Formosa Basin)
Fernando M. G. Martinsa,b∗, Helena M. Fernandeza,b, Jorge M. G. P. Isidoroa,c , Antonio Jorda´nb,d and Lorena Zavalab,d
aDepartment of Civil Engineering, Institute of Engineering, University of Algarve, Penha Campus,
8005-135 Faro, Portugal;bMED_Soil Research Group, Seville, ES 41012, Spain;cMarine and Environmental
Sciences (MARE), University of Coimbra, Coimbra, Portugal;dDepartment of Crystallography,
Mineralogy and Agricultural Chemistry, University of Seville, Seville, ES 41012, Spain (Received 22 December 2014; resubmitted 18 March 2015; accepted 25 March 2015)
A Geographic Information Systems-based tool is used for macro-landform classification following the Hammond procedure, based upon a Digital Terrain Model (DTM) created from ordinary Kriging. Gentle slopes, surface curvature, highlands and lowlands areas are derived from the DTM. Combining this information allows the classification of terrain units (landforms). The procedure is applied to the Ria Formosa basin (Southern Portugal), with five different terrain types classified (plains, tablelands, plains with hills, open hills and hills). Keywords: landform classification; Hammond; Dikau; DTM; Ria Formosa
1. Introduction
Geomorphic events (e.g., erosion, sedimentation, landslides) may represent threats to people and economic activities. A deeper knowledge of the genesis of these events is thus crucial for finding adequate tools able to mitigate those threats. Within the last decades, Geographic Information Systems (GISs) supported by Digital Terrain Models (DTMs) have shown a marked importance in environmental and land management. DTMs are also important resources for the identification and modelling of geoforms, that is, the land units resulting from the endogenous and exogenous (natural) processes that shape the Earth’s surface.
The Mediterranean region is characterised by having seasonal climate and specific ecological and edaphic conditions that make it one of the most vulnerable ecosystems in Europe, this is, namely, due to the fragility of the ecosystems and the low rates of biomass production during dry periods (e.g.Zachar, 1982). A profound knowledge of Mediterranean topography, at different scales, is thus essential to, for example, set control, prevention and correction measures for soil conservation, and to mitigate the occurrence and intensification of desertification. This process, which can become irreversible, has already occurred in some areas of the Mediterranean region (e.g.Kosmas, Danalatos, & Gerontidis, 2000;Rubio & Calvo, 1996).
Geomorphic studies allow for a deeper knowledge of the natural environment. One example is the modelling of geomorphic terrain units (landforms), considered important for the study of
#2015 Fernando M. G. Martins
∗Corresponding author. Email:[email protected]
environmental and ecological processes (Martins, 2012), with several approaches to classifying landforms. Early studies were mostly manual-based and supported by the analysis of land surface parameters on topographic maps, or directly through field measurements (e.g.Crozier & Owen, 1983; Hammond, 1954,1964a,1964b;Linton, 1968; Wallace, 1955). According to
Hammond (1964a), the best methods for classification require a systematic analysis of the terrain, describing each component individually. Hammond’s geomorphometric and geomorphic studies were conducted in large areas (small scale), using quantitative variables and hierarchical classification. Later, with the emergence of GIS, Dikau updated and automated Hammond’s pro-cedures, ranking the landforms in terms of size, order and geometric complexity (e.g. Dikau, 1989;Dikau, Brabb, & Mark, 1991). Since then several researchers have followed this method-ology (e.g.Barka, Vladovicˇ, & Ma´lisˇ, 2011;Brabyn, 1998;Jorda´n & Bellinfante, 2000;Jorda´n, Zavala, Bellinfante, & Gonza´lez, 2005;Tino´s, Ferreira, Riedel, & Zaine, 2014).
In addition to the Hammond-based procedure, several other methodologies have been used with accurate results to analyse and classify landforms (Martins, 2012).Pellegrini (1995) devel-oped a classification algorithm using eigenvectors and Fourier transformation.Maguire (2005)
used principal component analysis (PCA) to evaluate which topographic features were relevant for landform definition (e.g. slopes, bends, aspect, roughness, local relief). This landform defi-nition was used to train a fuzzy ARTMAP neuronal network for landform classification.
Dra˘gut¸ & Blaschke (2006) used fuzzy logic algorithms to process the segmentation of homo-geneous regions derived from a DTM. Oliveira and Santos (2009)applied high-pass and low-pass spatial filters to a DTM with different levels of information used for intensity-hue-saturation (IHS) image fusion or segmentation-by-region growing techniques.
The aim of this research is to develop a methodology, based on the Hammond and Dikau procedures, for the classification of landforms in the Ria Formosa basin in Southern Portugal (Figure 1), following other studies on the south of the Iberian Peninsula (e.g.Martinez-Zavala, Lo´pez, & Sanmiguel, 2007;Paixa˜o, 2012). The Ria Formosa basin landform map is presented at a 1:60,000 scale (see: Main Map). The 17 terrain units are shown with different colours: green, gentle and low-lying areas; pink, intermediate zones; yellow and red, rougher areas and highlands. To enhance the virtual sense of relief, the colour representation is draped over a hill-shade with a solar elevation of 458 and an azimuth of 308. The map includes the position of 10 localities to assist spotting the landforms.
2. Study area
The Ria Formosa basin is located in the extreme south of mainland Portugal (N 368 57′to N 378 15′and W 78 28′to W 88 04′) and has an area of 86,400 ha and a perimeter of 166 km, including a complex of coastal saltwater lagoons and barrier islands with an area of about 16,000 ha. The coastal lagoons are protected by European Union and Portuguese Laws and classified as a Wetland of International Importance under the RAMSAR convention (PORTUGAL Ramsar
Figure 1. Ria Formosa basin (view from Monte Figo to S).
Site 212). This area is of particular importance for numerous species of breeding, wintering and staging waterbirds.
The basin is characterised by a gentle and homogenous topography without abrupt changes in altitude. The average slope is 11% and the elevation ranges from 0 to 530 m above sea level. The region is divided into three distinct geological areas (from N to S): the mountains of Serra do Cal-deira˜o with lithosols are mainly shale-greywacke and shale-clay; the sections with calcareous soils are called Barrocal; the coast with the system of barrier islands and a sandy coastline extend-ing to the outlet of the Guadiana River into the Atlantic Ocean.
3. Methods
The basic source of information for this study was a 1:25,000 map with contour lines and discrete elevation points (Geographical Institute of the Portuguese Army;IGeoE, 2004). The DTM of the Ria Formosa basin (10 m resolution) was created using ordinary Kriging, with the variogram based on a spherical model (Figure 2). Several land surface parameters such as gentle slope, local relief, curvature and relative vertical position were modelled for each point of the DTM. The automatic classification of landforms was carried out following the methodology established by Hammond and Dikau, with some modifications: (1) slopes below 4% were classified as ‘gentle slopes’ to produce results homogenous and comparable to the obtained by Hammond and Dikau; (2) a curvature map was used to create the relative vertical position map with less steps than the original method, where the low and high areas (as defined by Hammond and Dikau) were represented, respectively, by concave and convex surfaces; (3) adjustments to the classes of landforms were required due to the resolution of the DTM and the smoothness and
regular relief of the Ria Formosa basin. ‘Very irregular plains’, ‘very low and smooth open hills’ and ‘very low and smooth hills’ classes were created. ‘Flat or nearly flat plains’ were split into ‘flat plains’ and ‘nearly flat plains’. ‘Tablelands and plains with hills’ were not divided into subclasses.
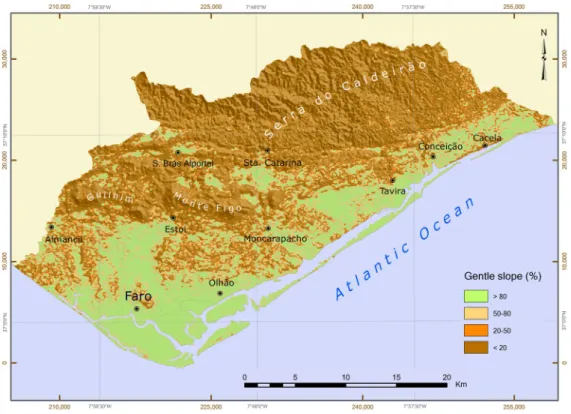
3.1. Gentle slope map
The slope of each pixel of the basin area was calculated using the elevation values of its neigh-bouring pixels, at the spatial resolution of the DTM (seeMonmonier, 1982). A ‘moving window’ technique with a matrix of 7× 7 was then used over the slope map. For each window, the per-centage of gentle slopes (below 4%) was found and assigned to the central pixel of the window. After this process, the ‘gentle slopes’ categories were reclassified (Table 1) and the corresponding map produced (Figure 3).
Table 1. Classes of gentle slopes in the Ria Formosa basin.
Code Gentle slopes (%)
A .80
B 50 – 80
C 20 – 50
D ,20
Figure 3. Gentle slope map of the Ria Formosa basin.
3.2. Local relief map
A ‘moving window’ technique with a 7× 7 convolution matrix was used to obtain the range of elevations directly from the DTM. The range of elevations was reclassified according toTable 2. The local relief map was generated following this procedure (Figure 4).
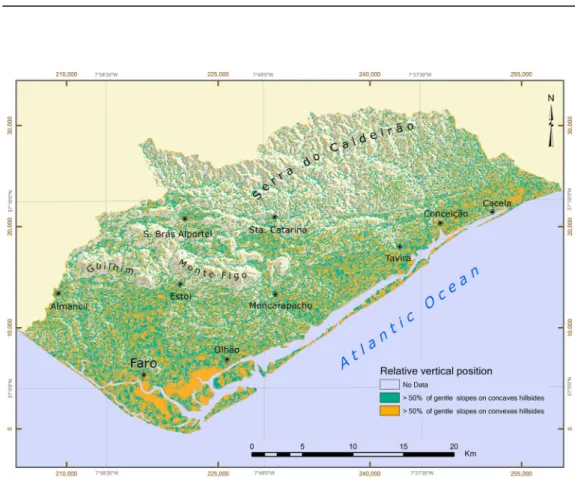
3.3. Relative vertical position map
A 7× 7 Laplacian filter was used over the DTM to find the slope’s rate of change (curvature). The negative and positive values indicate, respectively, concave and convex surfaces. According to the Hammond procedure, only areas with a majority of gentle slopes were considered (to divide the gentle slope shapes of the terrain, separating the ‘tablelands’, as upland units, from the ‘plains with hills’, as lowland units, see Dikau et al., 1991).Table 3shows the classes of gentle slopes on concave and convex hillsides.
Table 2. Classes of local relief in the Ria Formosa basin.
Code Local relief (m)
1 0 – 15
2 15 – 30
3 30 – 90
4 90 – 150
5 150 – 220
Overlaying the curvature and gentle slope maps, it was then possible to produce the relative vertical position map (Figure 5).
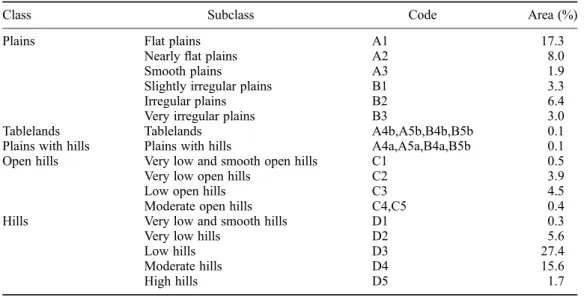
3.4. Landforms map
The map of landforms was obtained by overlaying the maps of gentle slopes (Figure 3), local relief (Figure 4) and relative vertical position (Figure 5). Five main landforms were mapped: plains, tablelands, plains with hills, opens hills and hills. These were divided into 17 subclasses (Table 4). The nomenclature followsHammond (1964a)andDikau, Heidelberg, Mark, Pike, and Park (1995)with slight changes.
The three most representative landforms in the basin area are low hills (27.4%), flat plains (17.3%) and moderate hills (15.6%). The low hills and moderate hills are mainly on the mountains of Serra do Caldeira˜o. The flat plains are on the coast, next to the coastal lagoons and along the leeward coast.
Table 3. Classes of relative vertical position in the Ria Formosa basin.
Code Relative vertical position
a .50% of gentle slopes on concave hillsides
b .50% of gentle slopes on convex hillsides
Figure 5. Relative vertical position map of the Ria Formosa basin.
4. Conclusions
This paper presents a methodology based on GIS tools for the detection and classification of land-forms in the Ria Formosa basin (southern of Portugal). A DTM is used as the starting point for an automatic classification of landforms based on the procedures of Hammond and Dikau. The spatial distribution of gentle slopes, local relief and relative vertical position are combined to auto-matically identify distinct landforms. This methodology has shown to be effective for the classi-fication of landforms. Also, it allows for easy and fast visual analysis. The results show that this method allows the reliable identification of the main landforms, with high-detail. In this particular example, the final map presents 17 subclasses of landforms.
The resulting map, which reflects the main physical and structural differences of the Ria Formosa basin, can be of substantial interest for the definition of hazard mitigation strategies (e.g. prevention and fighting of forest fires and control of the consequential soil, hydrological modelling for flood management purposes).
At the present stage, the authors are working with higher-resolution DTMs with which it will be possible to distinguish landforms with a smoother relief (e.g. saltmarshes, usually classified as flat plains surfaces).
Software
IDRISI Taiga software (Clark Labs, Clark University, 2009) was used as the analysis platform for modelling landforms. Esri ArcGIS 10.1 was used to design the maps.
Acknowledgements
The authors wish to thank the MED_SOIL Research Group for all support offered during fieldwork and the IGeoE for providing the information needed to create the DTM.
Disclosure statement
No potential conflict of interest was reported by the authors.
Table 4. Classes, subclasses, codes and areas of landforms in the Ria Formosa basin.
Class Subclass Code Area (%)
Plains Flat plains A1 17.3
Nearly flat plains A2 8.0
Smooth plains A3 1.9
Slightly irregular plains B1 3.3
Irregular plains B2 6.4
Very irregular plains B3 3.0
Tablelands Tablelands A4b,A5b,B4b,B5b 0.1
Plains with hills Plains with hills A4a,A5a,B4a,B5b 0.1
Open hills Very low and smooth open hills C1 0.5
Very low open hills C2 3.9
Low open hills C3 4.5
Moderate open hills C4,C5 0.4
Hills Very low and smooth hills D1 0.3
Very low hills D2 5.6
Low hills D3 27.4
Moderate hills D4 15.6
ORCID
Jorge M. G. P. Isidoro http://orcid.org/0000-0002-6901-5652
Antonio Jorda´n http://orcid.org/0000-0003-3165-5846
References
Barka, I., Vladovicˇ, J., & Ma´lisˇ, F. (2011). Landform classification and its application in predictive mapping of soil and forest units. In J. Hora´k, T. Hla´sny, J. Ru˚zˇicˇka, L. Halounova´, & O. Cˇ erba (Eds.), GIS Ostrava 2011 – The 8th International Symposium (pp. 143 – 157). Ostrava: Technical University of Ostrava. Brabyn, L. (1998). GIS analysis of macro landform. In P. Firns (Ed.), SIRC98 – The 10th Annual
Colloquium of the Spatial Information Research Centre (pp. 35 – 48). Dunedin: University of Otago. Crozier, M. J., & Owen, R. C. (1983). Terrain evaluation for rapid ecological survey. Victoria: Department
of Physical Geography, University of Victoria.
Dikau, R. (1989). The application of a digital relief model to landform analysis in geomorphology. In J. F. Raper (Ed.), Three dimensional applications in Geographical Information Systems (pp. 51 – 77). London: Taylor & Francis.
Dikau, R., Brabb, E. E., & Mark, R. M. (1991). Landform classification of New Mexico by Computer (Report No. 91 – 634). Denver, CO: U.S. Geological Survey.
Dikau, R., Heidelberg, E. E. B., Mark, R. K., Pike, R. J., & Park, M. (1995). Morphometric landform analysis of New Mexico. Zeitschrift fu¨r Geomorphologie, (Suppl.-Bd. 101), 109 – 126.
Dra˘gut¸, L., & Blaschke, T. (2006). Automated classification of landform elements using object-based image analysis. Geomorphology, 81, 330 – 344.doi:10.1016/j.geomorph.2006.04.013
Hammond, E. H. (1954). Small scale continental landform maps. Annals of the Association of American Geographers, 44, 33 – 42.doi:10.1080/00045605409352120
Hammond, E. H. (1964a). Analysis of properties in land form geography – an application to broad-scale land form mapping. Annals of the Association of American Geographers, 54, 11 – 19. doi:10.1111/j. 1467-8306.1964.tb00470.x
Hammond, E. H. (1964b). Classes of land-surface form in the forty-eight states, U.S.A. Annals of the Association of American Geographers, 54, Map Supplement, 4, scale: 1:5,000,000.
IGeoE (2004). Carta Militar de Portugal a` escala 1:25000 [Portuguese Military Map at 1:25000 scale] [Map]. Lisbon: Instituto Geogra´fico do Exe´rcito.
Jorda´n, A., & Bellinfante, N. (2000). Cartografı´a de la Erosividad de la Lluvia Estimada a Partir de Datos Pluviome´tricos Mensuales en el Campo de Gibraltar (Ca´diz) [Mapping rainfall erosivity estimated from pluviometric monthly data in the campo de Gibraltar (Ca´diz)]. Edafologı´a, 7, 83 – 92.
Jorda´n, A., Zavala, L. M., Bellinfante, N., & Gonza´lez, F. (2005). Cartografı´a Semicuantitativa del Riesgo de Erosio´n en Suelos Mediterra´neos [Semiquantitative cartography for erosion risk mapping in Mediterranean soils]. In R. J. Ballesta & A. M. Gonza´lez (Eds.), Control de la Degradacio´n de Suelos (pp. 701 – 706). Madrid: Autonomous University of Madrid.
Kosmas, C., Danalatos, N. G., & Gerontidis, S. (2000). The effect of land parameters on vegetation perform-ance and degree of erosion under Mediterranean conditions. Catena, 40, 3 – 17. doi:10.1016/S0341-8162(99)00061-2
Linton, D. (1968). The assessment of scenery as a natural resource. Scottish Geographical Magazine, 84, 219 – 238.doi:10.1080/00369226808736099
Maguire, B. D. (2005). Towards a landform geodatabase: The automatic identification of landforms (Unpublished master thesis). The University of British Columbia, Vancouver.
Martinez-Zavala, L., Lo´pez, A. J., & Sanmiguel, P. I. (2007). Aplicacio´n de un sistema de informacio´n geo-gra´fica al ana´lisis del medio fı´sico en el parque natural Los Alcornocales. Aproximacio´n a una cartografı´a geomorfolo´gica a partir de un modelo digital de elevaciones [Application of a geographic information system to the analysis of the physical environment in the Los Alcornocales natural park. Approach to a geomorphological mapping from a digital elevation model]. Almoraima, 35, 245 – 254.
Martins, F. (2012). Elaboracio´n de um modelo digital de geoformas de la Cuenca de la Ria Formosa (Algarve, Portugal) [Development of a landforms digital model of the Ria Formosa Basin (Algarve, Portugal)]. (Unpublished doctoral dissertation). University of Seville, Seville.
Monmonier, M. (1982). Computer-assisted cartography: Principles and prospects. Englewood Cliffs, NJ: Prentice-Hall.
Oliveira, A. M., & Santos, R. L. (2009). Ana´lise comparativa entre fatiamento e a classificac¸a˜o de imagens aplicada ao mapeamento das unidades de vertentes em Feira de Santana-BA [Comparative analysis of slicing and image classification applied to the mapping of hillslope units in Feira de Santana-BA]. Paper presented at the XIII Simpo´sio Brasileiro de Geografia Fı´sica Aplicada, Vic¸osa.
Paixa˜o, H. (2012). Elaboracı´on de un modelo digital del terreno de la zona norte de la Sierra de Graˆndola (Alentejo, Portugal) [Development of a digital terrain model of the northern part of the Sierra de Graˆndola (Alentejo, Portugal)]. (Unpublished doctoral dissertation). University of Seville, Seville. Pellegrini, G. J. (1995). Terrain shape classification of digital elevation models using eigenvectors and
fourier transforms (Doctoral dissertation). State University of New York at Albany, Albany, NY. Rubio, J. L., & Calvo, A. (1996). Mechanisms and processes of soil erosion by water in Mediterranean
Spain. In J. L. Rubio & A. Calvo (Eds.), Soil degradation in Mediterranean environments (pp. 37 – 48). Logron˜o: Geoforma Ediciones.
Tino´s, T. M., Ferreira, M. V., Riedel, P. S., & Zaine, J. E. (2014). Aplicac¸a˜o e Avaliac¸a˜o de Metodologia de Classificac¸a˜o Automa´tica de Padro˜es de Formas Semelhantes do Relevo [Implementation and evaluation of a methodology for automated classification of landform patterns]. Revista Brasileira de Geomorfologia, 5, 353 – 370.
Wallace, H. W. (1955). New Zealand Landforms. New Zealand Geographer, 11, 17 – 27. doi:10.1111/j.1745-7939.1955.tb01323.x