ABSTRACT: The main factor considered in breeding programs for fish is growth, which can be assessed in terms of a gain in either weight or body measurements. This study was undertaken to evaluate the morphometric traits of GIFT strain tilapia (Oreochromis sp.) selected for weight gain. The data set used contained information on 6,650 animals. The genetic values of 8,590 animals in a relationship matrix of five generations were predicted. The following morphometric measurements were evaluated: standard length; body depth and body width. Body area and volume were also calculated. Bi-character analyses involving morphometric traits were used to estimate (co)variance components. Heritability, larval and fingerling common environmental effects were estimated for each trait, together with the genetic and phenotypic correlations between traits. Bayesian procedures were utilised by Gibbs chains, and the convergence of the chains was tested using the Heidelberger and Welch method. Genetic trends were estimated by segmented regression of the fish breeding values of the generations considered in this study. Estimates of heritability (0.28 a 0.31) had moderate to high magnitudes for all traits. Genetic correlations between traits were all above 0.8, and the genetic gains were satisfactory from the third generation onwards. From the estimates of the genetic parameters and genetic gain the morphometric traits evaluated have good potential for selection.
Keywords: Bayesian approach, genetic correlation, genetic gain, heritability
Introduction
Tilapia, Oreochromis sp., is one of the most popular species of fish farmed in Brazil, and its production repre-sents 39 % (155,450 tons) of all cultured freshwater fish (MPA, 2012). Systems for the production of tilapia are be-coming increasingly intensified, giving rise to a constant search for more productive strains. Different strains of Nile tilapia have been developed into a viable business in Brazil. However, much of the aquaculture production in Brazil is still based on the use of unimproved strains, or strains improved by mass selection without inbreeding discrimination, which impairs growth rates (Santos, 2011).
The first fish breeding program, using statisti-cal methods for genetic analysis based on information surrounding the individual and relatives, was initiated in 2005 in Brazil. The starting point was a partnership between the State University of Maringá (UEM, in the state of Paraná, Brazil) and the World Fish Center (Ma-laysia). This involved the importation of 30 families of GIFT (Genetically Improved Farmed Tilapia) tilapia, a strain that has been improved by selection process for several generations.
The most important trait to be improved in a selec-tion program from an economic point of view is growth (Huang and Liao, 1990), which has a component related to body shape that is expressed by morphometric indices or measures (Reist, 1985). The understanding of the pro-cesses involved in growth, such as changes in the size, shape and body composition of livestock, is fundamental for all aspects of animal production as it can reflect the
quality of the final product found in the marketplace (Al-laman et al., 2013; Lawrence and Fowler, 1997).
In common with the program carried out in Mar-ingá, most fish breeding programs in the world are mainly concerned with weight gain and, therefore, most studies of genetic parameters are related to this trait (Eknath and Acosta, 1998; Ponzoni et al., 2005; Rutten et al., 2005b; Charo-Karisa et al., 2006; Khaw et al., 2008). However, knowledge of the changes that occur in other related traits, such as morphometric measurements, as a result of selec-tion for weight gain is also important (Nguyen et al., 2010; Charo-Karisa et al., 2007). Fish that have more width and depth lead to the perception of higher yield meat eating and are preferred by consumers (Nguyen et al., 2007).
An efficient way to study changes in morphomet-ric traits due to selection for weight gain is the genetic parameters and genetic change estimates, which are es-sential when establishing guidelines for a breeding pro-gram. The evaluation of genetic progress over time can provide results that serve as indicators for future action (Hershberger et al., 1990).
This study aimed at evaluating genetically the morphometric traits of the tilapia GIFT strain using se-lection breeding programs for weight gain by estimation of genetic parameters and genetic trends.
Materials and Methods
GIFT Program in Brazil
The GIFT tilapia breeding program started in Bra-Received September 03, 2013
Accepted March 11, 2014
1São Paulo State University/Course Coordination of Fishing Engineering, Experimental Campus of Registro, Av. Nelson Brihi Badur, 430 – 11900-000 – Registro, SP – Brazil. 2State University of Maringa – Dept. of Animal Science, Av. Colombo, 5790, Jd. Universitário – 87020-900 – Maringá, PR – Brazil.
3University of Lavras, Dept. of Animal Science, C.P 3037 – 37200-000 – Lavras, MG – Brazil.
4State University of Santa Cruz, Dept. of Statistics, Campus Soane Nazaré de Andrade, Rod. Jorge Amado, Km 16, Bairro Salobrinho – 45662-900 – Ilhéus, BA – Brazil. *Corresponding author <[email protected]>
Edited by: Gerson Barreto Mourão
Genetic parameters and trends of morphometric traits of GIFT tilapia under selection
Rafael Vilhena Reis Neto1, Carlos Antônio Lopes de Oliveira2, Ricardo Pereira Ribeiro2, Rilke Tadeu Fonseca de Freitas3*, Ivan
zil with the importation of 30 families from the World Fish Center (Malaysia) by the State University of Mar-ingá (UEM), located in the state of Paraná in southern Brazil. The program is currently at the 7th generation.
The first two generations were used for multiplication of families and process of selection for weight gain be-gan with the 3rd generation. From the third generation
onwards, the best animals of each family were chosen through their breeding values (BLUP) to be the parents of the next generation, featuring a selection within fami-lies. Each selection process always resulted in complete replacement of broodstock fish, featuring discrete gen-erations.
Mating, farming and performance test
The mating, larvae and fingerling cultures were conducted in a Fish Farm Station located in Floriano, in the state of Paraná, Brazil (23°30'37" S 52°3'45" W), using ponds. The mating system was hierarchical, one male to two females, constituting full-sib and half-sib families. All full-sib families provided animals for the production of the next generation, and the use of ani-mals with close ties of kinship in hierarchical mating was avoided to keep inbreeding levels low (2 %).
During the mating season, from November to Feb-ruary, breeders were kept in individual hapas (1 m³). The females were observed every two days, until signs of imminent spawning were identified (swollen abdo-men and urogenital papilla prominent), at which time the male was placed in the female hapa. After spawning, the animals were again separated.
Larvae were kept with their mothers until the end of the mating season, creating a common source of varia-tion, which was considered to be the larval common en-vironmental effect. Fish birth date, which was recorded for inclusion of animal age in the model, was considered when larvae were observed in the reproduction hapas, as hapas were checked every two days so that the re-cords would have a maximum of one day of error only.
When the fish attained an average mass of 1 g, two groups of 100 fingerlings from the same full-sib fam-ily were separated and randomly assigned to fingerling hapas (1 m3) arranged in earth ponds, creating a further
source of variation known as the fingerling common en-vironmental effect. When the fingerling reached a weight exceeding 10 g, 50 fish of each full-sib family were iden-tified by microchips (‘Passive Integrated Transponder’ or PIT-tag) implanted in the visceral cavity. They were then placed, on the same day, into growth-out cages (4 m3)
with a stocking density of 150 fish m–3. In each
genera-tion, the fish were assigned to different growth-out cages due to the large number of families evaluated. Each tank always received, as a priority, representatives from all the families.
The growing period in the cages lasted approxi-mately 150 days, throughout part of the autumn, the entire winter and part of the spring. After this period of culture, the fish were harvested, anesthetized by
im-mersion in a water tank with a solution containing 25 mg L–1 benzocaine, identified, weighted and submitted
submitted to morphometric analysis and subsequently returned to the cage.
The following morphometric measurements were used in the analyses: standard length (SL), which was measured from the anterior extremity of the head to the insertion of the caudal fin; body depth (BD), which was measured ahead of the first ray of the dorsal fin; and body width (BW), which was also measured ahead of the first ray of the dorsal fin. The body area (BA), a product of standard length and body depth (SL × BD), and body volume (BV), a product of standard length, body width and body depth (SL × BD × BW), were also calculated.
Database and statistical analysis
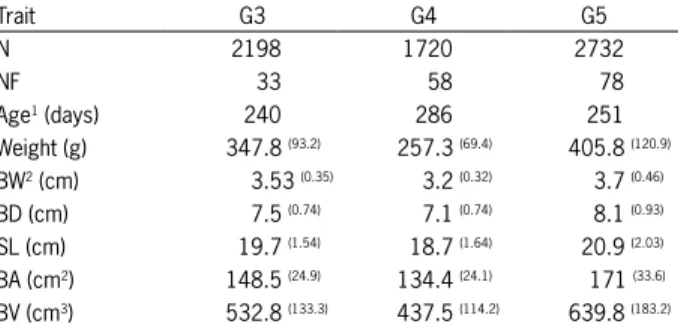
The genetic evaluation of morphometric traits was performed using a data set containing information from 6,650 animals (3rd, 4th and 5th generation), and a
relation-ship matrix with 8,590 fish, of five generations, which had their breeding values predicted. The base population considered in the evaluation was represented by the 30 families of GIFT tilapia imported from Malaysia (Table 1).
Morphometric data were subjected to bi-character analysis in order to estimate the (co)variance compo-nents, using the following animal model and the mixed model equations of Henderson implemented in MTG-SAM:
in which y1 and y2 are the observation vectors of traits 1 and 2; b1 and b2 are the identified environmental ef-fects vectors of traits 1 and 2; a1 and a2 are the direct additive genetic effects vectors of traits 1 and 2; c1 and
c2 are the larval common environmental effect vectors of traits 1 and 2; w1 and w2 are the fingerling common environmental effect vectors of traits 1 and 2; e1 and e2
are the random errors vectors of traits 1 and 2; X1 and X2
Table 1 – Number of observations (N), number of full-sib families (NF), age at assessment, means and standard deviation (s) of weight and morphometric traits of GIFT tilapia in the 3rd (G3), 4th (G4) and 5th (G5) generation of the breeding program.
Trait G3 G4 G5
N 2198 1720 2732
NF 33 58 78
Age1 (days) 240 286 251
are the incidence matrices of identified environmental effects of traits 1 and 2; Z1 and Z2 are the matrices of di-rect additive genetic effects for traits 1 and 2; C1 and C2
are the matrices of larval common environmental effects of traits 1 and 2; and W1 and W2 are the matrices of fin-gerling common environmental effects of traits 1 and 2. The identified environmental effects, what are generally called fixed effects in the analysis were: gen-eration, cage, sex, and age as covariate. The environ-mental effects included in the statistical model showed statistical significant effect on the previous analysis us-ing SAS PROC GLM. The interactions “sex*generation” and “age*generation” were not considered in the analy-sis because there was no overlap of generations. Thus, we adopted the criterion of parsimony, and inclusion of these effects would result in further analyses that would not alter the estimates of (co)variance components. The random part of the model consisted of direct additive genetic effects and uncorrelated environmental common effects of larvae and fingerling.
Bayesian procedures were used, adopting the methods of Monte Carlo Markov Chain (MCMC) and Gibbs Sampling, which were implemented in the com-putational system MTGSAM (Tassell, C.P. van and Vleck, D.L. van, 1995). This software was developed using "flat" and normal a priori distributions for the environ-mental effects identified, and the genetic, common and residual effects, respectively. For the (co)variance com-ponents, the prior distribution was inverted (Wishart, Eaton, 2007).
The strategy for obtaining the Gibbs chains was the initial generation of 1,500,000 cycles, with a burn-in of 100,000 cycles and 50 cycles of thburn-innburn-ing burn-interval. The final chain size for each genetic parameter and (co) variance component was the result of a convergence test, and could vary according to the combination of traits in the bi-character analysis. Using the (co)variance components, the heritability, larval and fingerling com-mon environmental effects were estimated for each trait separately. The genetic correlations were estimated be-tween traits. The convergence of chains was tested by the Heidelberger and Welch (1981) method, using the CODA library, which was implemented by means of the ‘R’ software for Windows (version 2.13.2, 2011).
The highest posterior density region (HPD) was estimated to 95 % for the (co)variance components and genetic parameter estimates, using the ‘R’ software. The credible interval commonly used in the Bayesian ap-proach considers, in the a posteriori distribution, tabs of equal reliability. However, the chains often have some form of asymmetry, especially in the case of genetic pa-rameters. Thus, the HPD region becomes an interesting alternative, since it minimizes the extent of the interval to a given level of credibility, providing more reliable estimates.
Genetic trends were estimated by segmented regression analysis of the fish breeding values for the morphometric traits as a function of the generations
considered in this study. This procedure was performed using the ‘nls’ function of the ‘R’ software. The genetic gains were calculated as the ratio (percentage) of the regression coefficients, by phenotypic means of each trait studied, according to the methodology proposed by Maluwa and Gjerde (2007). Phenotypic correlations be-tween morphometric traits were calculated by Pearson’s linear correlation coefficient, with confidence intervals estimated at 95 %.
Results
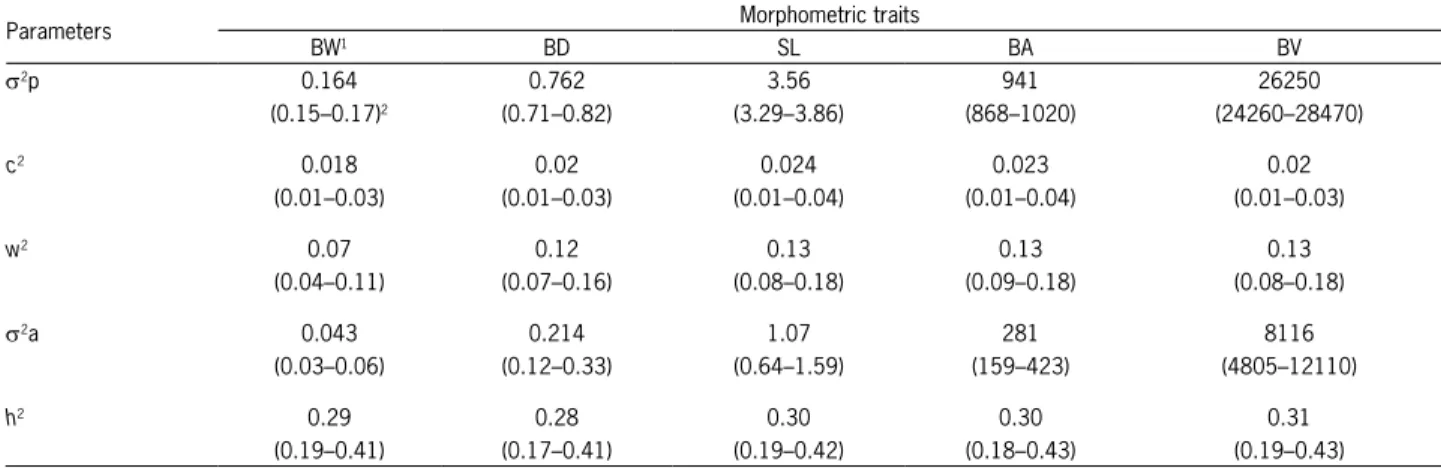
The numbers of Gibbs samples which attained convergence in the bivariate analyses were: 27,000 for BWxSL, BWxBD, BWxBA, BWxBA, BAxBV; 18,000 for SLxBD, BDxBA; and 28,000 for SLxBA, SLxBV and BDxBV. The marginal posterior distribution estimated for the larval common environmental effects was very low, ranging from 0.018 for body width to 0.024 for standard length. The values obtained for fingerling ef-fects were higher than those obtained for larval. The lowest observed was 0.07 for body width, while the standard length, body area and body volume presented the same estimates (0.13). These results indicate that the fingerling common environmental effect has higher in-fluence on total variation than the larval effect (Table 2). All heritability estimates differed from zero by 95 % HPD region and were moderate to high in magnitude. The morphometric trait that showed the lowest herita-bility was body depth (0.28), while body volume had the highest estimate (0.31), demonstrating that this param-eter exhibited small variability between traits (Table 2). These heritability estimates, together with the estimates of additive genetic variance (s2a), which were equally
different from zero (95 %), indicate the high potential for genetic gain of morphometric traits under the farming strategy presented in the current study.
Phenotypic correlation coefficients showed a high degree of association among the traits. The lowest corre-lation coefficient was observed between body width and standard length (0.8), while the greatest was between body area and volume (0.98; Table 3). Genetic correla-tions were also positive and high, all being above 0.8, and reaching 0.98 between body volume and area. This suggests that the morphometric traits are controlled by the same set of genes, and there is a slight or no inde-pendent genetic variability between the traits (Table 3). Thus, selection for one of the variables would also result in gains for the others and would not, therefore, require the use of all measurements in a selection program. The amplitudes of the HPD region of the genetic correlations were very small, indicating high precision estimates.
results were expected, since the first two generations of the program were only used for the production of the families, without going through the selection process. High coefficients of determination (R2) indicate a proper
fit of segmented regression models, and the regression coefficients (b1), which indicate the genetic gain from the third generation onwards, were highly significant (p
< 0.01) for all morphometric variables.
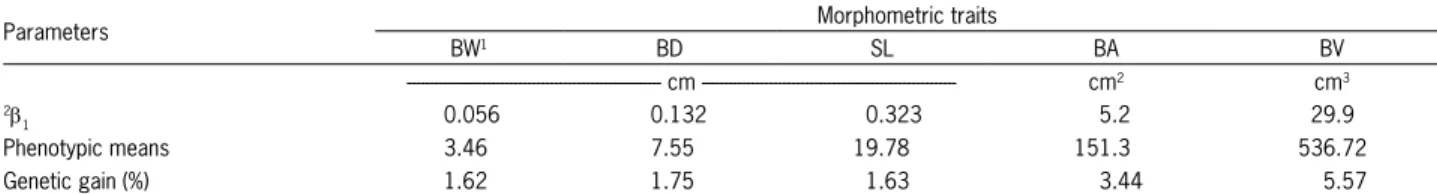
The morphometric trait that demonstrated the greatest genetic gain was body volume, with an increase of 5.57 % per generation (from the third generation), fol-lowed by body area with a gain of 3.44 %. Measure-ments of body width, depth and standard length pre-sented similar genetic gains, namely 1.62, 1.75 and 1.63 %, respectively (Table 4).
Discussion
Eknath et al. (2007) illustrated the importance of considering common environmental effects in the
anal-Table 2 – Phenotypic variances (s2p), fingerling (w2) and larval (c2) common environmental effects, additive genetic variances (s2a), heritability
(h2) and HPD region (95 %) for the morphometric traits of the GIFT tilapia under selection for weight gain.
Parameters Morphometric traits
BW1 BD SL BA BV
s2p 0.164 0.762 3.56 941 26250
(0.15–0.17)2 (0.71–0.82) (3.29–3.86) (868–1020) (24260–28470)
c2 0.018 0.02 0.024 0.023 0.02
(0.01–0.03) (0.01–0.03) (0.01–0.04) (0.01–0.04) (0.01–0.03)
w2 0.07 0.12 0.13 0.13 0.13
(0.04–0.11) (0.07–0.16) (0.08–0.18) (0.09–0.18) (0.08–0.18)
s2a 0.043 0.214 1.07 281 8116
(0.03–0.06) (0.12–0.33) (0.64–1.59) (159–423) (4805–12110)
h2 0.29 0.28 0.30 0.30 0.31
(0.19–0.41) (0.17–0.41) (0.19–0.42) (0.18–0.43) (0.19–0.43)
1Morphometric traits: body width (BW); body depth (BD); standard length (SL); body area (BA); and body volume (BV); 2HPD highest posterior density region (lower limit–upper limit) to 95 %.
yses. The culture of full-sib families in separate hapas until they reach the proper size for tagging can cause a systematic non-genetic effect, which will be confused with full-sib genetic effects during performance tests, re-sulting mainly in a loss of selection accuracy (Nguyen et al., 2007). Consequently, the fingerling common envi-ronmental effect and the larval effect, which exhibited low values, must be included in the analysis models.
Most authors do not include the larval effect in their analysis models, and consider just the hapa effect (Rutten et al., 2005a; Karisa et al., 2006; Charo-Karisa et al., 2007; Nguyen et al., 2007; Nguyen et al., 2010), which corresponds to the fingerling effect in the current study. This can be explained by the fact that these authors employed a system of artificial embryo in-cubation, whereby, soon after hatching, the larvae are transferred to fry hapa, resulting in a single random en-vironmental effect.
The common environmental effects for standard length estimated by Rutten et al. (2005a) were much low-Table 3 – Genetic correlations (below diagonal), with their highest posterior density region (95 %), and Pearson phenotypic correlations (above
diagonal), with their confidence intervals (95 %), among the morphometric traits of the GIFT tilapia under selection for weight gain.
BW1 BD SL BA BV
BW 0.81 0.8 0.82 0.91
(0.79–0.82)2 (0.79–0.82) (0.8–0.84) (0.9–0.93)
BD 0.87 0.9 0.98 0.95
(0.79–0.93)3 (0.88–0.91) (0.97–0.99) (0.93–0.96)
SL 0.81 0.87 0.96 0.93
(0.7– 0.9) (0.74–0.94) (0.94–0.97) (0.92–0.95)
BA 0.91 0.97 0.96 0.97
(0.84–0.96) (0.95–0.99) (0.93–0.98) (0.95–0.98)
BV 0.95 0.97 0.92 0.98
(0.91–0.98) (0.94–0.98) (0.87–0.96) (0.97–0.99)
er (0.07) than those obtained in the current study. How-ever, Rutten used an artificial system for embryo incuba-tion in his research. Furthermore, until they were ready to be marked, the fingerling were reared in a recirculation system under conditions that were much more controlled than in the current study, resulting in a lower influence on the total variation of morphometric measurements.
Using a spawning system similar to that used in the current study, Nguyen et al. (2007) found slightly higher values for fingerling effects on tilapia morpho-metric measurements: 0.16, 0.16 and 0.24 for standard length, body width and body depth, respectively.
How-Figure 1 – Genetic trends of GIFT tilapia body depth (BD) and body width (BW) for five generations of the Brazilian program.
Figure 2 – Genetic trends of GIFT tilapia body area (BA) and body volume (BV) for five generations of the Brazilian program.
ever, Nguyen et al. (2007) assessed their fish when the body weight reached approximately 190 g, which was 148 g lower than the weight of the fish in the current study, and common environmental effects tend to de-cline as animals grow (Gjedrem and Baranski, 2009). Nguyen et al. (2010) found that common environmental effects accounted for 4–5 % of the total variation of mor-phometric measurements in tilapia weighing approxi-mately 530 g, while Ponzoni et al. (2005) observed values of 15–26 % for tilapia with an average weight of 250 g.
Nguyen et al., 2007; Nguyen et al., 2010) produced herit-ability estimates very similar to those obtained in the current study. Even after several generations of selection (in the Philippines, Malaysia and Brazil), there was no reduction in the genetic variation of body traits, which confirms the potential of the breeding program for fur-ther generations of selection.
Charo-Karisa et al. (2007) presented heritability es-timates for tilapia body depth, width and standard length of 0.60, 0.73 and 0.62, respectively. These are much high-er values than those found in the current study. Howevhigh-er, the animals evaluated in the previous investigation were tested under conditions (fertilised ponds without a food supply) different from the present ones, and taken from a different tilapia strain were in the second generation of selection only. Heritability estimates closer to those found in the current study (standard length 0.25 and width 0.25) were observed by Rutten et al. (2005a) for tilapia reared under conditions more similar to this work.
Several authors have confirmed the genetic as-sociation between morphometric variables. Rutten et al. (2005a) found a genetic correlation of 0.84 between body width and standard length in tilapia; Nguyen et al. (2007) reported that estimates of genetic correlation are
very high between length and width (0.94), length and depth (0.92) and width and depth (0.95), suggesting that these characteristics are controlled by the same group of genes; and Charo-Karisa et al. (2007) found high genetic correlations of 0.9 to 0.98 between morphometric char-acteristics, suggesting that there is no need to use all of the variables in a selection program.
Maluwa and Gjerde (2007) observed a linear ge-netic gain in the growth of tilapia from the base popula-tion to the third generapopula-tion, which was also reported by Khaw et al. (2009) working with two tilapia strains for three generations of selection. Nguyen et al. (2010) also observed a linear increasing trend of breeding values for fillet yield as a response to selection for fillet weight of tilapia in three generations. In the studies of Maluwa and Gjerde (2007), Khaw et al. (2009) and Nguyen et al. (2010), there were gains of 3.8 % and 5.4 % for weight gain and 1.7 % for fillet yield, respectively. Given that just a few generations of selection were evaluated in these studies, the genetic gain of morphometric vari-ables was satisfactory.
The Brazilian GIFT program research has report-ed, in an aquaculture magazine, a genetic increase of about 4 % for weight gain per generation (Oliveira et al., 2012). This estimate is in line with the gains obtained by morphometric variables, mainly the body area (3.44 %) and volume (5.57 %), indicating that the body measure-ments have gains that are proportional as a result of the selection for weight gain GIFT program in Brazil.
Generally, the morphometric traits showed good potential for selection because they present estimates of heritability of medium to high magnitude, are genetically correlated, and furthermore, still had significant genetic gains in recent generations without direct selection. Rut-ten et al. (2005a) assessed carcass traits and morphomet-ric measures of tilapia and reported genetic correlations to be higher than phenotypic, and the fillet yields were correlated with width (0.98), fillet weight (0.81) and body weight (0.74). In the same study, estimated heritabili-ties were moderate to high for fillet weight (0.24), body weight (0.26), length (0.25) and width (0.25). However, the heritability of fillet yield was low (0.12), suggesting that the correlated responses to fillet yield by morphometric measurements would be larger than by direct selection (Turra et al., 2010). In this sense, the use of morphometric measurements in breeding programs would be interest-Table 4 – Regression coefficients (b1), phenotypic means and genetic gain of the morphometric traits for the GIFT tilapia under selection for
weight gain.
Parameters Morphometric traits
BW1 BD SL BA BV
--- cm --- cm2 cm3 2b
1 0.056 0.132 0.323 5.2 29.9
Phenotypic means 3.46 7.55 19.78 151.3 536.72
Genetic gain (%) 1.62 1.75 1.63 3.44 5.57
1Morphometric traits: body width (BW); body depth (BD); standard length (SL); body area (BA); and body volume (BV); 2Represents the genetic gain in absolute terms per generation, from the third generation of selection onwards.
ing as an indirect selection criterion for improving carcass traits and can be included in selection indices.
Genetic parameter estimates are inherent in the population and environment from which they are ob-tained. Therefore, the results of Rutten et al. (2005a) could not be repeated in the fish population evaluated in the current study. Thus, it is necessary to undertake a study of the morphometric and carcass traits of tilapia in order to determine the genetic correlations between these traits and, thus, verify the possibility of using these measures in selection programs.
Acknowledgements
To the Brazilian National Council for Scientific and Technological Development (CNPq) and to Minas Gerais State Foundation for Research Support (FAPEMIG) for support, and all employees of the Aquaculture Station of Maringá State University for help during the experi-ments.
References
Allaman, I.B.; Reis Neto, R.V.; Freitas, R.T.F.; Freato, T.A.; Lago, A.A.; Costa, A.C.; Lima, R.R. 2013. Weight and morphometric growth of different strains of tilapia (Oreochromis sp). Revista Brasileira de Zootecnia 42: 305-311.
Charo-Karisa, H.; Komen, J.; Rezk, M.A.; Ponzoni, R.W.; Arendonk, J. van; Bovenhuis, H. 2006. Heritability estimates and response to selection for growth of Nile tilapia (Oreochromis niloticus) in low-input earthen ponds. Aquaculture 261: 479-486.
Charo-Karisa, H.; Bovenhuis, H.; Rezk, M.A.; Ponzoni, R.W.; Arendonk, J. van; Komen, H. 2007. Phenotypic and genetic parameters for body measurements, reproductive traits and gut length of Nile tilapia (Oreochromis niloticus) selected for growth in low-input earthen ponds. Aquaculture 2731: 15-23.
Eaton, M.L. 2007. The Wishart distribution. p. 302-333. In: Eaton, M.L. Multivariate statistics: a vector space approach. Institute of Mathematical Statistics, Beachwood, OH, USA.
Eknath, A.E.; Acosta, B.O. 1998. Genetic Improvement of Farmed Tilapias (GIFT) Project: Final Report, March 1988 to December 1997. Makati City, International Center for Living Aquatic Resources Management, Philippines.
Eknath, A.E.; Bentsen, H.B.; Ponzoni, R.W.; Rye, M.; Nguyen, N.H.; Thodesen, J.; Gjerde, B. 2007. Genetic improvement of farmed tilapias: composition and genetic parameters of a synthetic base population of Oreochromis niloticus for selective breeding. Aquaculture 273: 1-14.
Gjedrem, T.; Baranski, M. 2009.Selective Breeding in Aquaculture: An Introduction. Springer Science, New York, NY, USA. Heidelberger, P.; Welch, P.D. 1981. A spectral method for
confidence interval generation and run length control in simulations. Communications of the ACM 4: 233-245.
Hershberger, W.K.; Myers, J.M.; Iwamoto, R.N.; Mcauley, W.C.; Saxton, A.M. 1990. Genetic changes in the growth of Coho Salmon (Oncorhynchus kisutch) in marine net-pens, produced by ten years of selection. Aquaculture, Amsterdam 85: 187-197. Huang, C.M.; Liao, I.C. 1990. Response to mass selection for
growth rate in Oreochromis niloticus. Aquaculture 85: 199-205.
Khaw, H.L.; Bovenhuis, H.; Ponzoni, R.W.; Rezk, M.A.; Charo-Karisa, H.; Komen, H. 2009. Genetic analysis of Nile tilapia (Oreochromis niloticus) selection line reared in two input environments. Aquaculture, Amsterdam 294: 37-42.
Khaw, H.L.; Ponzoni, R.W.; Danting, M.J.C. 2008. Estimation of genetic change in the GIFT strain of Nile tilapia (Oreochromis nilóticus) by comparing contemporary progeny produced by males born in 1991 or in 2003. Aquaculture 275: 64-69. Lawrence, T.L.J.; Fowler, V.R. 1997. Growth of Farm Animals.
Cambridge University Press, London, UK.
Maluwa, A.O.; Gjerde, B. 2007. Response to selection for harvest body weight of Oreochromis shiranus. Aquaculture 273: 33-41. Ministério da Pesca e Aquicultura [MPA]. 2012. Fish production
and aquaculture: 2008 and 2010 statistics = Boletim Estatístico da Pesca e Aquicultura. Available at: www.mpa.gov.br/iamages/ Docs/Informacoes_e_Estatisticas/BoletimMPA. [Accessed Nov 19, 2013] (in Portuguese)
Nguyen, H.N.; Khaw, H.L.; Ponzoni, R.W.; Hamzah, A.; Tan, S.; Kamaruzzaman, N. 2007. Supplement. Can sexual dimorphism and body shape be altered in Nile tilapia by genetic means? Aquaculture 272: 38-46.
Nguyen, N.H.; Ponzoni, R.W.; Abu-Bakar, K.R.; Hamzah, A.; Khaw, H.L.; Yip Yee, H. Jan. 2010. Correlated response in fillet weight and yield to selection for increased harvest weight in genetically improved farmed tilapia (GIFT strain), Oreochromis niloticus. Aquaculture 305: 1-5.
Oliveira, C.A.; Ribeiro, R.P.; Junior, D.S.; Povh, J.A.; Resende, E.K. 2012. Breeding fish, a reality for Brazilian fish farming = Melhoramento genético de peixes, uma realidade para piscicultura Brasileira. Panorama da Aquicultura Magazine, 130:. 38-47. Avaiable at: http://peixegen.blogspot.com.br/2012/08/ revista-panorama-da-[Accessed Nov. 19, 2013] (in Portuguese) Ponzoni, R.W.; Hamzah, A.; Saadiah, T.; Kamaruzzaman, N. June
2005. Genetic parameters and response to selection for live weight in the GIFT strain of Nile tilapia (Oreochromis niloticus). Aquaculture 247: 203-210.
Reist, J.D. 1985. An empirical evaluation of several univariate methods that adjust for size variation in morphometric data. Canadian Journal of Zoology 63: 1429-1439.
Rutten, M.J.M.; Bovenhuis, H.; Komen, H. May 2005a. Genetic parameters for fillet traits and body measurements in Nile tilapia (Oreochromis niloticus L.). Aquaculture 246: 125-132. Rutten, M.J.M.; Komen, H.; Bovenhuis, H. 2005b. Longitudinal genetic
analysis of Nile tilapia (Oreochromis niloticus L.) body weight using a random regression model. Aquaculture 246: 101-113.
Santos, A.I.; Ribeiro, R.P.; Vargas, L.; Mora, F.; Alexandre Filho, L.; Fornari, D. C.; Oliveira, S.N. 2011. Bayesian genetic parameters for body weight and survival of Nile tilapia farmed in Brazil. Pesquisa Agropecuária Brasileira 46: 33-43.
Turra, E.M.; Oliveira, D.A.A.; Teixeira, E.A.; Prado, S.A.; Melo, D.C.; Sousa, A.B. 2010. The use of morfometric measurements for the genetic improvement of the Nile tilapia fillet yield (Oreochromis niloticus). Revista Brasileira de Reprodução Animal 34: 29-36 (in Portuguese, with abstract in English). Tassell, C.P. van; Vleck, L.D. van. 1995. A Manual for Use of