http://dx.doi.org/10.1590/1806-9061-2016-0240
Their Growth Rate, Carcass and Meat Qualities
Author(s)
Juodka RI
Nainiene RI
Juskiene VI
Juska RI
Stuoge II
Leikus RI
I Animal Science Institute of Lithuanian
Uni-versity of Health Sciences; R. Zebenkos 12, Baisogala, LT-82317 Radviliskis district, Li-thuania
Mail Address
Corresponding author e-mail address Robertas Juodka
Department of Ecology, Animal Science Institute of Lithuanian University of Health Sciences, R. Zebenkos 12, Baisogala, LT-82317 Radviliskis district, Lithuania Tel: (+370) 61535692 Email: [email protected]
Keywords
Anatomic carcass dissection data; chemical indicators; growth rate; lupine; turkey.
Submitted: February/2016 Approved: October/2016
ABSTRACT
A study was carried out to determine the effects of soybean meal replacement with different amounts of blue lupine in the diets of turkeys on the growth rate, anatomic carcass dissection data, chemical indicators of breast and thigh muscles and the content of tryptophan and oxyprolin. In total three hundred and sixty cross BIG-6 turkeys were allotted to two control and ten experimental groups of 30 one-day-old turkeys. The control group of turkeys was fed the diet containing soybean meal, whereas the trial groups were offered different amounts (from 20 to 30%) of lupines. Group 4 and 5 were additionally given probiotic mixture Bio Plus 2B and allzyme SSF, respectively. Soybean oil replacement from 20 to 30% lupine in the diet had no influence on the growth rate, dressing percentage, edible parts and abdominal fat content of turkeys. The study indicated that lupines in the diet of turkeys had a different effect on the meat quality of different genders. Lupines did not have any negative effect on the meat quality of female turkeys and 30% lupines even improved the protein value index of breast muscles. However, 20–30 and 25–30% lupines in male turkey diets lowered dry matter and protein contents in breast muscles but had no negative influence on the main quality indicators in thigh muscles. The results of the study showed that the negative effect on the male breast muscle quality might be avoided using Bio Plus 2B or allzyme SSF additives in the male diets containing 30% lupines.
INTRODUCTION
would be higher as well. An alternative protein source for soybeans might be lupines (Lupinus spp.). Lupines possess good agronomic characteristics which makes it more appealing to cultivate than soybeans, and they have no anti-nutritive factors, such as trypsin-inhibitor (Olver, 1987). The protein from lupines has all indispensable amino acids and are well-digestible (Sujak et al. (2006). Birds fed lupines had a low mortality rate and low relative pancreatic weight, confirming that the level of anti-nutrients in these legume seeds was low in comparison with soybeans (Nalle, 2009). Moreover, sweet lupines are the cheapest home grown feeds (Leikus et al., 2004). However, the worldwide production of lupine grain seeds is low, and amounted to about 0.01 % of the worldwide production of soybeans (Mittermaier, 2013).
Australia is the country with the highest level of lupine growing and exportation, which represents 75.3% of global production (Lucas et al., 2015). In the EU, lupine production makes up 17.6% of the global production with Poland being the leader (77799–126200 tons annually in 2010–2013) and Germany the second in the production of lupines (27660–31500 tons annually in 2010–2013) (Faostat, 2015; Lucas et al., 2015). Undoubtedly, the areas with lupines will be increasing in Lithuania as well due to the development of organic agriculture and animal production, whereas currently the production of sweet lupines in our country is low, i. e. 3800 tons in 2013 (Faostat, 2015). One of the most popular species of lupines in our country is the narrow-leafed lupine. ‘Bora’ is a narrow-narrow-leafed alkaloid-free variety of blue lupines developed in Germany. Several studies can be found on the efficiency of lupines in the diets of different species of animals and birds, but there is no unanimous agreement regarding the highest possible amount of blue lupines in the diets of heavy-type turkeys.
The studies of Mierlita (2014), Zdunczyk et al. (2014) and Krawczyk et al. (2015) indicated that from 6 to 30 % lupine in the turkey diets had no influence on their body weight if compared with lupine-free diets. Mierlita (2014) concluded that substituting soybean protein meals with white lupine beans in turkey broilers at a rate from 20 to 30% had no adverse effects on the slaughter indices, however, the diet containing over 30% of lupines had a negative impact on carcass features. Zdunczyk et al. (2014) indicated that the slaughter value of turkeys was not affected by feeding them 6 to18% sweet yellow lupine meal in comparison with the diet containing soybean meal. This is in agreement with the studies of Krawczyk et
al. (2015) who carried out trials with turkeys fed 8 to 24% yellow lupine meal.
The studies of the effect of lupines on the chemical indicators of goslings and chicken meat showed that 5-20% of lupines in the feed had no influence on the above meat indicators and on the contents of tryptophan and oxyprolin (Morkunas et al., 1995; Vaitiekunas et al., 1996; Morkunas, 2002).
Currently, the demand for organic fowl is increasing both in Europe and Lithuania. Also, the birds are grown by Label Rouge programme mostly in France, according to which the ration composition is based principally on locally produced feed (Sundrum et al., 2005). As it is not allowed to use genetically modified soya products in organic farming, the use of lupines for poultry feeding would reduce the shortage of protein feeds and allow reaching high protein content necessary for feeding turkey poults. For these farms, balanced diets are the major difficulty under the organic farming standards (Rahmann & Böhm, 2005). However, the available information is insufficient to develop the diets with blue lupines, that have no negative influence on the qualitative and quantitative indicators of meat.
The purpose of our study was to determine the efficiency of different amounts of blue narrow lupine seed meal in the diets for hybrid cross BIG-6 turkeys, to analyze the effects of the lupine content on the growth rate of turkeys, anatomic carcass dissection data and chemical indicators of breast and thigh muscles; and to determine the contents of tryptophan and oxyprolin in above muscles.
MATERIAL AND METHODS
Birds and experimental treatments
meal in the diets of turkeys in Groups 3, 4 and 5. For all the groups, the amounts of lysine, methionine and threonine were respectively 16, 10.5 and 10.4 g per kg feed at the age of 0–4 weeks, from 5 to 8 weeks it was 14, 9.0 and 9.0 g, and from 9 to 12 weeks 12.1, 6.5, 7.9 g and from 13 to 16 weeks – 9.0, 5.2 and 6.3 g. During experimental period, water and feed were provided ad libitum. All birds were reared under the
same conditions. The investigations were conducted in accordance with the law of the Republic of Lithuania for animal welfare and handling, Law No.IX-2271 (State News, 2012) and a sub-statutory act by the State Food and Veterinary Service of Lithuanian Republic regarding the confirmation of the order on the animals for experiments, research, storage, maintenance and operating requirements (State News,2012).
Table 1 – Experimental design
Age week Protein content of feed (%)
Metabolizable energy, MJ/kg
Control group Group 1 Group 2 Group 3 Group 4/5
Soybean oil-meal content in
the diet (%)
Soybean oil-meal + lupine content in the diet (%)
0–4 27 11.1 36.5 22.4+20 18.8+25 15.3+30 15.3+30
5–8 25.1 11.1 36.0 21.9+20 18.4+25 14.9+30 14.9+30
9–12 22.8 11.3 29.5 15.4+20 11.9+25 8.3+30 8.3+30
13–16 18.5 11.3 21.2 7.1+20 3.5+25 0+30 0+30
Growth rate, carcass traits and meat quality
Birds of all groups were weighed at 4, 8, 12 and 16 weeks of age. At the age of 16 weeks, three males and three females of average weight were chosen from each group for control slaughtering. Prior to slaughter, the birds had not been fed for 12 hours. Carcasses were anatomically dissected according to the methodological recommendations of anatomic carcass dissection and organoleptic evaluation of poultry (Lukashenko et al.1984). The chemical composition of meat was analyzed by standard AOAC methods (1990). The contents of tryptophan and oxyprolin in meat were determined by the methods of Marina &
Shut (1970) and Kolar (1990). All analytical studies were carried out at the Analytical Laboratory of the Animal Science Institute of Lithuanian University of Health Sciences.
Data analysis
Processing of the data was performed using software Statistica (Data Analysis Software System, Version 7.0; StatSoft, Inc., Tulsa, OK, USA). The statistical evaluation of the results was performed using descriptive statistics and Student’s t test for independent samples. In the tables, all of the data are displayed as mean (x) ± standard error (SE) of mean. The probability level of p< 0.05 was considered to be statistically significant.
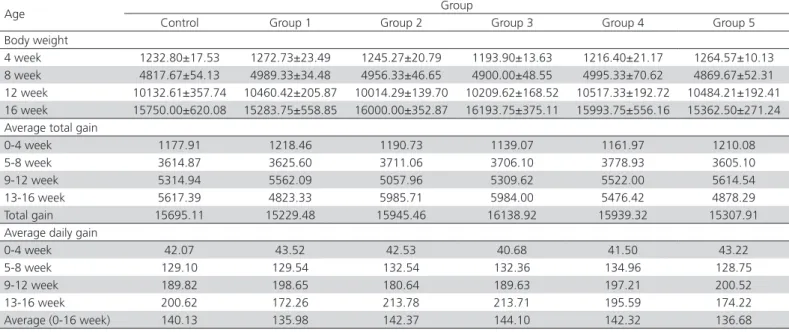
Table 2 – Effect of different amounts of blue lupine in the diets of turkeys on the growth rate of male turkeys, g
Age Group
Control Group 1 Group 2 Group 3 Group 4 Group 5 Body weight
4 week 1232.80±17.53 1272.73±23.49 1245.27±20.79 1193.90±13.63 1216.40±21.17 1264.57±10.13 8 week 4817.67±54.13 4989.33±34.48 4956.33±46.65 4900.00±48.55 4995.33±70.62 4869.67±52.31 12 week 10132.61±357.74 10460.42±205.87 10014.29±139.70 10209.62±168.52 10517.33±192.72 10484.21±192.41 16 week 15750.00±620.08 15283.75±558.85 16000.00±352.87 16193.75±375.11 15993.75±556.16 15362.50±271.24 Average total gain
0-4 week 1177.91 1218.46 1190.73 1139.07 1161.97 1210.08 5-8 week 3614.87 3625.60 3711.06 3706.10 3778.93 3605.10 9-12 week 5314.94 5562.09 5057.96 5309.62 5522.00 5614.54 13-16 week 5617.39 4823.33 5985.71 5984.00 5476.42 4878.29 Total gain 15695.11 15229.48 15945.46 16138.92 15939.32 15307.91 Average daily gain
0-4 week 42.07 43.52 42.53 40.68 41.50 43.22
5-8 week 129.10 129.54 132.54 132.36 134.96 128.75
9-12 week 189.82 198.65 180.64 189.63 197.21 200.52
13-16 week 200.62 172.26 213.78 213.71 195.59 174.22
Average (0-16 week) 140.13 135.98 142.37 144.10 142.32 136.68
RESULTS AND DISCUSSION
Lupine BoraIn our study, the turkeys of both genders were fed ‘Bora’ variety lupines. This variety of lupines contained 1% bitter lupine seeds, 94.12% dry matter, 5.12% crude fat, crude protein 37.22%, crude fibre 13.32%, crude ash 3.09%. These contents were similar to those indicated for L.angustifolius in general (Nalle, 2009; Mittermaier, 2013).
Growth rate
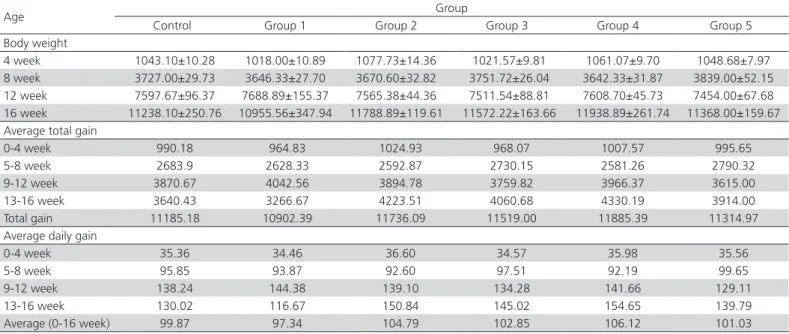
There was no significant difference between male and female weights at the age of 4, 8, 12 and 16 weeks in both control and treated groups (Table 2, 3). The results of our study are in agreement with those of Mierlita (2014), Zdunczyk et al.(2014), Krawczyk
et al. (2015), who indicated that lupine in the diet of heavy-type turkeys had no adverse effect on their body weight. However our results do not agree with
Table 3 – Effect of different amounts of blue lupine in the diets of turkeys on the growth rate of female turkeys, g
Age Group
Control Group 1 Group 2 Group 3 Group 4 Group 5 Body weight
4 week 1043.10±10.28 1018.00±10.89 1077.73±14.36 1021.57±9.81 1061.07±9.70 1048.68±7.97 8 week 3727.00±29.73 3646.33±27.70 3670.60±32.82 3751.72±26.04 3642.33±31.87 3839.00±52.15 12 week 7597.67±96.37 7688.89±155.37 7565.38±44.36 7511.54±88.81 7608.70±45.73 7454.00±67.68 16 week 11238.10±250.76 10955.56±347.94 11788.89±119.61 11572.22±163.66 11938.89±261.74 11368.00±159.67 Average total gain
0-4 week 990.18 964.83 1024.93 968.07 1007.57 995.65
5-8 week 2683.9 2628.33 2592.87 2730.15 2581.26 2790.32
9-12 week 3870.67 4042.56 3894.78 3759.82 3966.37 3615.00 13-16 week 3640.43 3266.67 4223.51 4060.68 4330.19 3914.00 Total gain 11185.18 10902.39 11736.09 11519.00 11885.39 11314.97 Average daily gain
0-4 week 35.36 34.46 36.60 34.57 35.98 35.56
5-8 week 95.85 93.87 92.60 97.51 92.19 99.65
9-12 week 138.24 144.38 139.10 134.28 141.66 129.11
13-16 week 130.02 116.67 150.84 145.02 154.65 139.79
Average (0-16 week) 99.87 97.34 104.79 102.85 106.12 101.03
±SE – standard error
the findings of Mikulski et al. (2014), who indicated that the use of blue lupine in the diet had resulted in significantly higher body weight of turkeys.
Anatomic carcass dissection_data
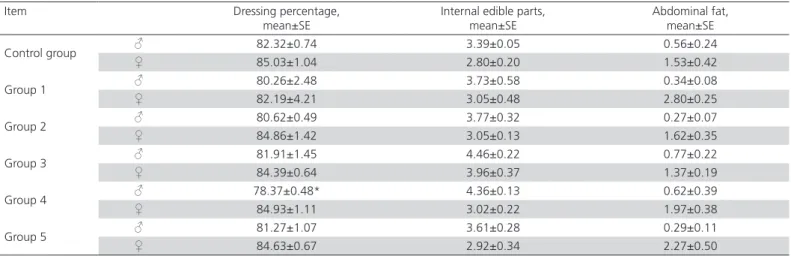
The different amounts of blue lupines in the diets of turkeys had no effects on the dressing percentage (Table 4), except for the significant difference between the control and Group 4 male turkeys fed diets containing 30% lupines and probiotics (+3.95%; p<0.05).
Büttner & Oster (2004) and Siudikas et al. (2010) have mentioned that supplementation of the feed for fattening pigs with 0.06% or 2.5–3.0% probiotic Bioplus 2B had no influence on the dressing percentage. Feeding chickens lupines or no-lupines resulted in no significant difference for the dressing percentage in the studies by Nalle (2009) (20% lupines), Morkunas
et al. (1995) (5–20% lupines), Olver (1987) (40% white lupine, variety ‘Buttercup’), Bekric et al. (1990) (23% lupine, variety ‘S-14’) and Orda et al. (2006) (5–20% yellow lupine, variety ‘Sonet’). Similar findings
were observed in the studies by Witak et al. (2006) on feeding duckling’s 2.5–15% yellow lupine, Mierlita (2014) on feeding male turkeys 20–30% white lupine (variety ‘Energy’), Mikulski et al. (2014) on feeding male turkeys 6–18% blue lupine (variety ‘Sonet’) and Krawczyk et al. (2015) on feeding female turkeys 8–24% yellow lupine (variety ‘Baryt’).
Contrary findings, i. e. higher dressing percentage values when feeding lupines, were reported by Morkunas (2002) in his study with goslings fed 20% lupines and Mierlita (2014) in the trials with male turkeys fed 40% white lupines (variety ‘Energy’).
In our study, there was no correlation determined between the content of abdominal fat and the composition of the feed offered to both trial and control groups of turkeys of both genders. This is in agreement with the findings of Witak et al. (2006) in the trial with chickens fed 2.5–15% yellow lupine, Suchy et al. (2010) and Orda et al. (2006) in the trials with chickens fed, respectively, 8.7–31.0% white lupine (variety ‘Amiga’) and 5–20% yellow lupine (variety ‘Juno’). On the contrary, Mikulski et al. (2014) indicated that 18% blue lupine (variety ‘Sonet’) in the diet of male turkeys had resulted in significantly higher content of abdominal fat. Krawczyk et al. (2015) have also found that the content of abdominal fat tended to increase when female turkeys were given 8–24% yellow lupine (variety ‘Baryt’). However, Bekric et al. (1990) reported that 23% lupines in the diet of chickens had influenced lower abdominal fat percent.
Chemical composition
The dry matter content in the male breast muscles trial groups 1, 2, 3 (Table 5) was from 1.95 to 2.31% lower (p<0.05–p<0.025), in Group 4 tended to decrease (–1.58%; p=0.08) and in Group 5 was statistically insignificantly lower (–1.30 %; p>0.05) than that of male turkeys in the control group.
The protein content in male breast muscles in trial (Groups 2 and 3 was from 1.86 to 2.13% lower (p<0.05–p<0.025), in Groups 1, 4 and 5 tended to decrease from –1.64 to –2.43% (p=0.06–p=0.08) in comparison with the control group.
Our findings for the dry matter content are contrary to those by Morkunas (2002) who indicated that the male chickens fed the diet containing 10– 20% lupines, had from 0.48 to 1.77% higher dry matter content in breast muscles. No other data have Table 4 – Effect of different amounts of blue lupine in the diets of turkeys on anatomic carcass dissection data, %
Item Dressing percentage, mean±SE
Internal edible parts, mean±SE
Abdominal fat, mean±SE
Control group ♂ 82.32±0.74 3.39±0.05 0.56±0.24
♀ 85.03±1.04 2.80±0.20 1.53±0.42
Group 1 ♂ 80.26±2.48 3.73±0.58 0.34±0.08
♀ 82.19±4.21 3.05±0.48 2.80±0.25
Group 2 ♂ 80.62±0.49 3.77±0.32 0.27±0.07
♀ 84.86±1.42 3.05±0.13 1.62±0.35
Group 3 ♂ 81.91±1.45 4.46±0.22 0.77±0.22
♀ 84.39±0.64 3.96±0.37 1.37±0.19
Group 4 ♂ 78.37±0.48* 4.36±0.13 0.62±0.39
♀ 84.93±1.11 3.02±0.22 1.97±0.38
Group 5 ♂ 81.27±1.07 3.61±0.28 0.29±0.11
♀ 84.63±0.67 2.92±0.34 2.27±0.50
*– p<0.05; ±SE – standard error
Table 5 – Effect of different amounts of blue lupine in the diets of turkeys on chemical composition of male´s breast muscles
Control group Group 1 Group 2 Group 3 Group 4 Group 5
Dry matter % mean ±SE
27.50±0.62 25.21±0.53* 25.19±0.17** 25.55±0.16* 25.92±0.26 26.20±0.54 Protein % mean ±SE
25.14±0.52 22.71±0.91 23.01±0.29** 23.28±0.14* 23.45±0.37 23.50±0.34 Fat % mean ±SE
1.29±0.20 1.43±0.39 0.82±0.03 1.16±0.15 0.79±0.04 0.90±0.18 Ash, % mean ±SE
0.99±0.03 1.05±0.01 0.93±0.09 1.04±0.01 1.04±0.01 0.97±0.01 Tryptophan mg 100 g mean ±SE
369.01±31.76 350.50±20.74 383.57±9.94 352.43±41.73 370.71±15.57 424.25±43.38 Oxyprolin mg 100 g mean ±SE
54.21±1.59 55.81±4.52 54.00±0.44 53.37±2.14 53.87±1.84 60.11±2.93 Tryptophan:oxyprolin ratio (protein value index)
6.81 6.28 7.10 6.60 6.88 7.06
been found regarding the dry matter and protein content in the breast muscles of heavy-type turkeys fed lupines.
In our study, the dry matter and protein content data in the female breast muscle, male and female thigh muscles (Table 6, 7, 8) indicated that diet supplementation with lupines had not affected the above indicators. This is in agreement with the results of Olver (1987) in the study with chickens fed 40% white lupine (variety ‘Buttercup’) regarding dry matter difference, Suchy et al. (2010) regarding protein content difference (from one third to two thirds
white lupine in the feed, variety ‘Amiga’), Froidmont
et al. (2004), who found no difference for the above indicators in thigh muscles (30–58% lupines in the feed) and Sitko & Čermak (1998) who indicated no
difference for the protein content in breast and thigh muscles with 20% lupine in the feed. Moreover, no difference for the dry matter and protein content in the breast muscles were reported by Krawzcyk et al.
(2015) in the study with female turkeys fed 8–24% yellow lupine (variety ‘Baryt’) and Mikulski et al. (2014) in the study with male turkeys fed 6–18% blue lupine (variety ‘Sonet’).
Table 6 – Effect of different amounts of blue lupine in the diets of turkeys on chemical composition of female´s breast muscles
Control group Group 1 Group 2 Group 3 Group 4 Group 5
Dry matter % mean ±SE
27.34±0.55 26.62±0.49 27.05±0.53 26.89±0.70 25.98±0.42 27.06±0.21 Protein % mean ±SE
23.51±0.16 22.69±0.60 23.13±0.30 23.16±0.19 22.97±0.46 23.33±0.23 Fat % mean ±SE
2.60±0.67 2.74±0.77 2.72±0.20 2.59±0.83 1.91±0.17 2.59±0.15 Ash % mean ±SE
1.10±0.04 1.12±0.03 1.08±0.02 0.97±0.06 1.03±0.04 1.10±0.03 Tryptophan mg 100 g mean ±SE
317.52±10.09 329.85±13.95 328.72±15.29 309.31±13.07 295.50±11.94 298.08±3.34 Oxyprolin mg 100 g mean ±SE
65.55±1.38 52.89±0.13***** 58.15±4.61 57.10±1.19*** 53.98±0.49***** 62.03±3.29 Tryptophan:oxyprolin ratio (protein value index)
4.84 6.24 5.65 5.42 5.48 4.81
***p<0.01; *****p<0.001; ±SE – standard error
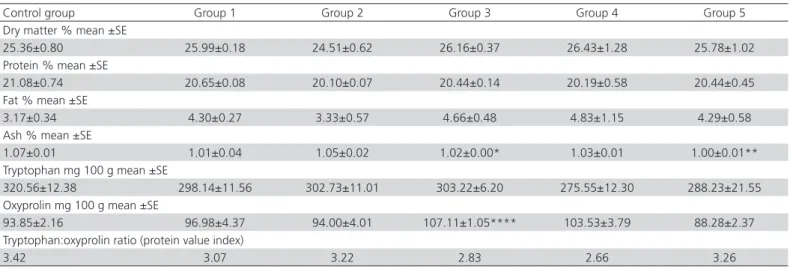
Table 7 – Effect of different amounts of blue lupine in the diets of turkeys on chemical composition of males thigh muscles
Control group Group 1 Group 2 Group 3 Group 4 Group 5
Dry matter % mean ±SE
25.36±0.80 25.99±0.18 24.51±0.62 26.16±0.37 26.43±1.28 25.78±1.02 Protein % mean ±SE
21.08±0.74 20.65±0.08 20.10±0.07 20.44±0.14 20.19±0.58 20.44±0.45 Fat % mean ±SE
3.17±0.34 4.30±0.27 3.33±0.57 4.66±0.48 4.83±1.15 4.29±0.58 Ash % mean ±SE
1.07±0.01 1.01±0.04 1.05±0.02 1.02±0.00* 1.03±0.01 1.00±0.01** Tryptophan mg 100 g mean ±SE
320.56±12.38 298.14±11.56 302.73±11.01 303.22±6.20 275.55±12.30 288.23±21.55 Oxyprolin mg 100 g mean ±SE
93.85±2.16 96.98±4.37 94.00±4.01 107.11±1.05**** 103.53±3.79 88.28±2.37 Tryptophan:oxyprolin ratio (protein value index)
3.42 3.07 3.22 2.83 2.66 3.26
*p<0.05; **p<0.025; ****p<0.005; ±SE – standard error
In our study, the ash content (Table 7) in the thigh muscles of male turkeys was from 0.05 to 0.07% (p<0.05–p<0.025) and from 0.02 to 0.06% (p>0.05) lower in, respectively, Groups 3 and 5 and Groups 1, 2 and 4 in comparison with the control group.
No significant differences for the ash content were found in the breast muscles of male and female turkeys and in the thigh muscles of female turkeys. This is in agreement with the findings of Suchy et al.
muscles of male chickens fed 17.3 to 31.0% lupines was lower, however, than in the breast muscles of the same chickens was significantly higher.
In our study, the ash content in the breast muscles was in agreement with the results of Krawczyk et al.
(2015) in the trial with turkeys fed from 8 to 24% yel-low lupine (variety ‘Baryt’) and lupine in the feed had no influence on the ash content in the breast muscles.
The differences in our study between genders for the dry matter, protein and ash contents in various muscles do not contradict from the findings of Morkunas (2002) and Nalle (2009) who indicated that feeding birds with leguminous plants might result in different data for different genders.
The oxyprolin content in the breast muscles of female turkeys was from 3.52 to 12.66 mg% lower if compared with the control group and statistically significant difference was found when compared with Groups 1, 3 and 4 (p<0.01–p<0.001). The protein value index in female muscles (Groups 1–4) was from 0.58 to 1.40 units higher in comparison with the control group.
The oxyprolin content in the thigh muscles of male turkeys (Groups 1–4) was from 0.15 to 13.26 mg% higher in comparison with the control group and the significance was determined when comparing with Group 3 (p<0.001) and if compared with Group 4, this indicator tended to increase (+9.68 mg%, p=0.09). The protein value index in male thigh muscles was from 0.16 to 0.73 units lower in comparison with the control group.
The differences of the results for the oxyprolin content in different male and female muscles are in agreement with the conclusion by Nalle (2009) that
the gender of the bird might influence different meat quality indicators. On the contrary, our data on the oxyprolin content partly in female breast and male thigh muscles contradicts the findings of Barroeta (2007) who noticed that the composition of the feed has no influence on the amino acid content in poultry meat and also do not agree with the results of Leikus
et al. (2004); Leikus (2006); and Juodka et al. (2016) who indicated that the use of lupine or peas in the feed had no effect on the oxyprolin content in meat.
It can be concluded that soybean oil meal replace-ment with lupine content from 20 to 30% in the diets of turkeys had no influence on the growth rate, dress-ing percentage, edible parts and abdominal fat con-tent, except for the significantly lower dressing per-centage in male turkeys fed 30% lupine and probiotic supplement if compared with a lupine free diet.
The study indicated that lupines in the diet of turkeys had a different effect on the meat quality of different genders. Lupines did not have any negative effect on the meat quality of female turkeys and 30% lupines even improved the protein value index of breast muscles. However, 20–30 and 25–30% lupines in male turkey diets lowered dry matter and protein contents in breast muscles but had no negative influence on the main quality indicators in thigh muscles. The results of the study showed that the negative effect on the male breast muscle quality might be avoided using Bio Plus 2B or allzyme SSF additives in the male diets containing 30 % lupines.
REFERENCES
AOAC - Association of Official Analytical Chemists. Official methods of analysis of the Association of Official Analytical Chemists. 15th. Washington: Association of Official Analytical Chemists;1990.
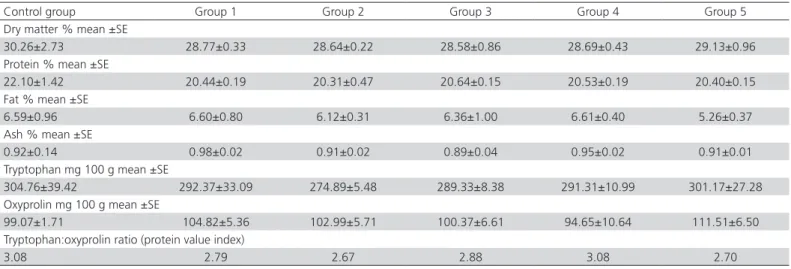
Table 8 – Effect of different amounts of blue lupine in the diets of turkeys on chemical composition of female´s thigh muscles
Control group Group 1 Group 2 Group 3 Group 4 Group 5
Dry matter % mean ±SE
30.26±2.73 28.77±0.33 28.64±0.22 28.58±0.86 28.69±0.43 29.13±0.96 Protein % mean ±SE
22.10±1.42 20.44±0.19 20.31±0.47 20.64±0.15 20.53±0.19 20.40±0.15 Fat % mean ±SE
6.59±0.96 6.60±0.80 6.12±0.31 6.36±1.00 6.61±0.40 5.26±0.37 Ash % mean ±SE
0.92±0.14 0.98±0.02 0.91±0.02 0.89±0.04 0.95±0.02 0.91±0.01 Tryptophan mg 100 g mean ±SE
304.76±39.42 292.37±33.09 274.89±5.48 289.33±8.38 291.31±10.99 301.17±27.28 Oxyprolin mg 100 g mean ±SE
99.07±1.71 104.82±5.36 102.99±5.71 100.37±6.61 94.65±10.64 111.51±6.50 Tryptophan:oxyprolin ratio (protein value index)
3.08 2.79 2.67 2.88 3.08 2.70
Barroeta AC. Nutritive value of poultry meat: relationship between vitamin E and PUFA. World Poultry Science Journal 2007;63:277-284.
Bekric B, Božovic I, Pavlovski Z, Masic B. Lupin, field pea, horse bean and soya-bean in combination with maize as feed for 21 to 52 days old broilers. Options Mediterraneennes 1990;7:103-106.
Büttner D, Oster A. Futterzusatzstoffe Bioplus 2Bund Sangrovit in der Mast. Landinfo 2004;5:9-12.
FAOSTAT [cited 2015 oct]. Available from: http://faostat3.fao.org/ download/Q/QC/E
Froidmont E, Becker Y, Dehareng F, Thewis A, BartiauxThill N. Lupin seed as a substitute tosoybean meal in broiler chicken feeding: incorporation level and enzyme preparation effects on performance, digestibility and meat composition [cited 2015 Dec]. Available from: http://www. eaap. org/Previous_Annual_Meetings/
Juodka R, Nainiene R, Juskiene V, Juska R, Stuoge I. Effects of different amounts of field peas (Pissum sativum L.) in the diets for turkeys on meat qualities. Journal of Applied Animal Research 2016;44(1):150-157.
Kolar K. Colorimetric determination of hydroxyproline as measure of collagen content in meat and meat products: NMKL collaborative study. Journal of the Association of Official Analytical Chemists 1990;73(1):54-57.
Krawczyk M, Mikulski D, Przywitowski M, Jankowski J. The effect of dietary yellow lupine (L. luteus cv. Baryt) on growth performance, carcass characteristics, meat quality and selected serum parameters of turkeys. Journal of Animal and Feed Sciences 2015;24: 61-70.
Leikus R, Triukas K, Svirmickas G, Juskiene V. The influence of various leguminous seed diets on carcass and meat quality of fattening pigs. Czech Journal of Animal Science 2004;49(9):398-406.
Leikus R. The influence of local feeds on meat quality of pigs. Gyvulininkyste. Animal Husbandry 2006;47:83-93.
The provisions of the Republic of Lithuania (2012-10-03) for animal welfare and handling. Law No. XI-2271., No. 108-2728; State News 2012 No. 122-6126.
Sub-statutory act by the State Food and Veterinary Service of Lithuanian Republic regarding the confirmation of the order on animals for experiments, research, storage, maintenance and operating requirements., State News 2012, No. 130-6595.
Lucas MM, Stoddard FL, Annicchiarico P, Frías J, Martínez-Villaluenga C, Sussmann D, et al. The future of lupin as a protein crop in Europe. Frontiers in Plant Science 2015;6:705.
Lukashenko VS, Lisenko MA, Stoliar TA. Methodological recommendation of anatomic carcass dissection and organoleptic evaluation of poultry. Moscow: Vaschnil;1984. p. 22.
Marina MA, Scut JE. Tryptophan determination. In: Schmanenkov NA, editor. New methods of biochemical studies and modifications in animal production. Moscow: Vniifbpsz;1970. p.50-52.
Mierlita D. Lupine seed (Lupinus albus vr. Energy) on growth performance and carcass traits in turkeys. Bulletin UASVM Animal Science and Biotechnologies 2014;71(2):192-197.
Mikulski D, Zdunczyk Z, Juskiewicz J, Rogiewicz A, Jankowski J. The effect of different blue lupine (L. angustifolius) inclusion levels on gastrointestinal
function, growth performance and meat quality in growing-finishing turkeys. Animal Feed Science and Technology 2014;198:347-352.
Mittermaier S. Characterisation of functional and sensory properties of lupin proteins [dissertation]. Nürnberg: Der Naturwissenschaftlichen Fakultät der Friedrich- Alexander- Universität Erlangen; 2013.
Morkunas M, Vaitiekunas D, Stankevicius V. Lupin in the diets broiler chicken. Proceedings of the 3rd Baltic Poultry Conference; 1995. p.45.
Morkunas M. Locally procurable fodder for poultry. Vilnius: Lithuanian Institute of Animal Science; 2002. p.157.
Nalle CL. Nutritional evaluation of grain legumes for poultry [dissertation]. Palmerston Noth (NZ): Massey University; 2009.
Olver MD. Sweet lupins as a feedstuff for broilers. South African Journal of Animal Science 1987;17:168-170.
Orda J, Jamroz D, Wiliczkiewicz A, Wertelecki T, Skorupinska J, Broz J. Effects of increased dietary inclusion of yellow lupins and microbial status of large intestine in broiler chickens. Archiv für Geflügelkunde 2006;70(1):14-21.
Rahmann G, Böhm H. Organic fodder production in intensive organic livestock production in europe: recent scientific findings and the impact on the development of organic farming. In: Rowlinson et al, editors. Integrating livestoc-crop systems to meet the challenges of globalisation. Proceedings of the AHAT/BSAS International Conference; 2005 Nov 14; Khon Kean. Thailand: Poultry Industry. 2005. p.471-485.
Sieradzki Z, Walczak M, Kwiatek K. Occurrence of genetically modified maize and soybean in animal feeding stuffs. Bulletin of the Veterinary Institute in Pulawy 2006;52:567-570.
Sitko VA, Cermak B. Influence of lupin seed performance and meat quality of broilers. Zootechnicka rada 1998;15:3-9.
Siudikas G, Kulpys J, Jeresiunas A, Juskiene V, Leikus R, Norviliene J. The influence of probiotics on carcass, meat and fat quality in pigs. Veterinarija ir Zootechnika 2010;52(74):79-86.
Suchy P, Strakova E, Herzig I, Steinhauser L, Vopalensky J, Kroupa L. Effect of replacing soybean meal with lupin seed-based meal in chicken diet on performance, carcass value and meat quality. Acta Veterinaria Brno 2010;79:195-202.
Sujak A, Kotlarz A, Strobel W. Composition and nutritional evaluation of several lupin seeds. Food Chemistry 2006;98:711-719.
Sundrum A, Schneider K, Richter U. Possibilities and limitations of protein supply in organic poultry andpig production 2005 [cited 2015 Nov]. Available from: http: //www.organic – revision. org/pub/Final_Report_ EC_Revision. pdf
Witak B, Górski J, Górska A. The effect of yellow lupine meal and extracted rapeseed meal oncarcass composition and some characteristics of meat quality of 7-week-old ducks of strain A44[cited 2015 Dec]. Available from: http://www.cabi.org/Uploads/animal-science/worldspoultry-science-association/WPSA-italy-2006/10936.pdf