299
Weed interference periods and transplanting desities of ...1 Recebido para publicação em 5.10.2015 e aprovado em 31.1.2016.
2 Universidade Estadual do Centro-Oeste, PPGA/UNICENTRO. Guarapuava-PR, Brasil, <[email protected]>; 3 Universidade
Federal de Lavras, UFLA. Lavras-MG, Brasil; 4 Universidade Federal de Pelotas, UFPEL, Pelotas-RS, Brasil; 5 Universidade Estadual
Paulista Júlio de Mesquita Filho, UNESP, Botucatu-SP, Brasil.
W
EEDI
NTERFERENCEP
ERIODS ANDT
RANSPLANTINGD
ENSITIES OFO
NIONC
ROP IN THEB
RAZILIANR
EGION OFG
UARAPUAVA, PR
1Períodos de Interferência de Plantas Daninhas e Densidades de Transplantio da Cultura da
Cebola na Região de Guarapuava, PR
SOUZA, J.I.2, SILVA, A.A.P.2, CHAGAS, R.R.3, OLIVEIRA NETO, A.M.4, MACIEL, C.D.G.2,
RESENDE, J.T.V.2, and ONO, E.O.5
ABSTRACT -The study was conducted with the objective of determining the critical
periods of interference prevention (CPIP) and the best period for the management of weeds community in onion crop Crioula Mercosul genotype, transplanted in distinct plants densities. The experiment was carried out in field conditions in the Brazilian municipality of Guarapuava, Paraná State, during the 2012 and 2013 agricultural
years, at Universidade Estadual do Centro-Oeste – UNICENTRO. Treatments were
disposed in randomized complete blocks and experimental design, with five repetitions, consisting of weeds coexistence periods and weeds control at 14, 28, 56, 112 and 168 days after transplanting the seedlings (DATS), using 0.6, 0.8 and 1.0 million
plants ha-1. Weeds community was evaluated through a phytosociological survey at
the end of each coexistence period in relation to yield and commercial quality of bulbs. Bulbs yield of transplanted onion was significantly affected by weeds coexistence, reaching 100% of losses. From adjusted models, viability was not observed in increasing plantation density as a practice that may favor the necessary reduction of weeds control. Onion plants transplanted in August 2012 and July 2013 presented CPIP, respectively, of 23 at 76 and 21 at 120 DATS for commercial bulbs yield, and of 20 at 55 and 26 at 112 DATS for total bulbs yield, respectively.
Keywords: Allium cepa, competition, plant arrangement, bulb yield.
RESUMO -O trabalho foi realizado com o objetivo de determinar os períodos críticos de
prevenção da interferência das plantas daninhas (PCPI) na cultura da cebola cultivar Crioula Mercosul, transplantada em diferentes densidades. O experimento foi conduzido em campo no município de Guarapuava, PR, durante as safras de 2012 e 2013, na
Universidade Estadual do Centro-Oeste – UNICENTRO. Os tratamentos obedeceram ao
delineamento experimental de blocos ao acaso com cinco repetições, constituídos por
períodos de convivência e controle das plantas daninhas aos 14, 28, 56, 112 e 168dias
após o transplantio das mudas (DATM), utilizando 0,6, 0,80 e 1,0 milhão de plantasha-1.
plantas daninhas. A cebola transplantada em agosto de 2012 e julho de 2013 apresentou PCPI, respectivamente, de 23 aos 76 e 21 aos 120 DATM para a produtividade de bulbos comerciais, e de 20 aos 55 e 26 aos 112 DATM, para a produtividade de bulbos totais, respectivamente.
Palavras-chave: Allium cepa, competição, arranjo de plantas, produção de bulbos.
INTRODUCTION
Onion crops (Allium cepa), just like any
other crop, are subjected to the effects of biotic and abiotic factors that influence their yield. One of the main biotic factors that negatively interfere in onion yield is the presence of weeds (Soares et al., 2003); the lack of control or inadequate control of such vegetation intensify the problem of weed interference in crops (Usman et al., 2005).
Low competition capacity of onion crops with the infesting weed community is reported and emphasized when referring to the early crop development stages (Garcia et al., 1994; Soares et al., 2003; Qasem, 2005). Therefore, crops should be kept free from weed interference for a certain period so that there is no yield reduction. Losses caused by the coexistence with the weeds can be severe, and the reduced bulbs yield can increase according to the competition period and the weeds. According to Zanatta et al. (2006), long periods of competition of the weed community with the crop can reduce the bulbs yield at 100%, compared to the condition without its interference.
Weeds interference in vegetable crops intensifies because of the cultivation areas going through intensive exploitation, frequent tillage, high fertilization rates and low water restriction (Pitelli, 1985). Therefore, this environment is favorable to the occurrence of weeds, which are fast-growing, have a short development cycle and high production of diaspores, significantly increasing the soil seed bank (Carvalho et al., 2008).
The competition of weeds with crops occurs by the limited resources from the environment, such as light, nutrients, water and space (Pitelli, 1985). The result of this competition depends on factors related to
the culture (species, cultivar and plant population), the weed community (specific composition, density and distribution), the management adopted (both for culture and for weeds) and the period of coexistence between the culture and the weed community (season and duration), and all these factors are influenced by climate and soil conditions of the environment.
As the season and duration of the coexistence period are the main factors influencing the interference relationship between the weed community and the culture, in weed interference studies the possibility of the occurrence of three periods is considered: a) period before interference (PBI), in which after emergence weeds can coexist with the culture without causing economic losses; b) total period of interference prevention (TRIP), wherein the control practices start with the emergence of weeds and crop and their end reflects the time at which the culture is capable of preventing weeds interference; and c) critical period of interference prevention (CPIP), which refers to the final period of the PBI to the TPIP, wherein the presence of weeds must be prevented by performing control practices. Thus, knowledge of these periods is essential to establish management strategies of weeds and is characterized as key to achieving high yield in potherbs (Zanatta et al., 2006).
Soares et al. (2004) have mentioned that there is a wide variation in the results of weed interference studies available in the literature; for onion transplanted, these periods range between 7 and 60 days for PBI and between 7 and 80 days for TPIP. Recently, Cavalieri (2013) has reported that search results on weed interference on onion crops indicate, on average, the critical periods of interference prevention (CPIP) as being from
the 56th days of the cycle for the direct seeding systems and seedlings transplant, respectively.
Moreover, among the phytotechnical management aspects that are key for commercial production of bulbs, which is directly related to weed interference, the establishment of the ideal plant population per hectare, the cultivar and the cultivation system are highlighted (Baier et al., 2009; Menezes Júnior & Vieira Neto, 2012).
Given the above, onion crop yield and quality may be influenced by weeds coexisting with the culture in different periods during the development cycle, as well as some cultivation control practices, such as the proper arrangement of the plant population. Thus, the aim of this study was to estimate the periods of coexistence and weed control in onion crops transplanted in the Brazilian region of Guarapuava, PR, using three population densities during two agricultural years.
MATERIALS AND METHODS
The study was divided in two experiments carried out in the field in the periods from August to December 2012 (harvest 1) and from July to January 2013/2014 (harvest 2), located in the Olericulture Sector belonging to the Agronomy Department at Central-West State
University (UNICENTRO – Universidade
Estadual do Centro-Oeste), Campus CEDETEG/
UNICENTRO, under coordinates 23o12’28,8" S
latitude, 53o18’14,7" W longitude and 1,020 m
altitude. The area climate is classified as Cfb humid subtropical mesothermal (Köppen, 1948), with cool summers, winters with the occurrence of severe and frequent frosts, and no significant dry season. The soil of the experimental area is classified as typical alic bruno latosol (Embrapa, 2013) clayey textured (50% clay, 20% sand and 30% silt), which, in a chemical analysis of samples from
0 to ... cm deep showed pH (CaCl2) of 5.7; OM
of 28.2 g dm-3; P of 11.1 mg dm 3; and 0.29, 6.4,
2.6, 0.0 per cmolc dm-3 of K, Ca, Mg and Al,
respectively.
The seedlings were obtained in beds used
as “seedbeds” and onion sowing was done by
sowing about 60 days before the final
transplanting, using 10 g of seed m-2 of
cultivar Crioula Mercosul, in a bed raised with the use of a rotary seedbed maker. The transplantation was performed when the seedlings were in the stage of two to three leaves, or about 15 cm high, while keeping the spacing at 0.15 cm and ranging the spacing between plants in 0.065, 0.08 and 0.10 m, which respectively constituted the population densities of 0.6, 0.8 and 1.0 million
plants ha-1. Harvests 1 and 2 were manually
transplanted on 08/29/2012 and 07/27/2013, respectively.
One day before transplanting the seedlings, basic fertilization was done with the formula
N-P-K (03-16-08), using 312 and 475 kg ha-1,
respectively, for harvests 1 and 2. At 15 and 35 days after transplanting, side dressings were carried out with the mix of urea and potassium
chloride in the amounts of 450 and 75 kg ha-1,
respectively. Irrigation was performed weekly with a micro-sprinkler system, according to the crop needs. To control pests and diseases, insecticides and fungicides applications were made using products registered for the crop in the Brazilian state of Paraná, in their recommended doses.
The experiment was conducted in an experimental design of randomized blocks in a 10 x 3 factorial arrangement with five repetitions. In both harvests, ten treatments consisted of five periods of coexistence and five of absence of coexistence of the onion crop with the weed community during the time interval of 14, 28, 56, 112 and 168 days after transplanting the seedlings (DATS) in three densities of plants (0.6, 0.8 and 1.0 million of
plants ha-1). In the 2012 harvest, due to the
seedlings having been transplanted later, the crop reached full circle at 112 DATS, being harvested in November 2012. At this stage, weed control in crop inter-rows and rows was done by hand weeding, considering the schedule and the need for treatments. Each experimental unit consisted of plots of five planting rows measuring 1.5 m long by 0.8 m wide and floor area measuring 1.2 m², since 0.1 m of the ends and the external rows were considered only as a border.
quantification (WSDM) using technical criteria adopted in phytosociological surveys, according to concepts described by Concenço et al. (2013). This procedure was carried out using a 0.25 m² area square-shaped metallic jig and random sowing per plot was done. Weeds shoots were collected and separated into monocotyledons and eudicotyledons. Samples were dried in
an air forced circulation stove at 60 oC until
constant weight, and then weighed on a precision scale. The classification system adopted in species identification was based on
the Angiosperm Phylogeny Group – APG II (2003)
with the help of the boundaries of families and arrangement of some genera, according to Souza & Lorenzi (2005), and other literature (Kissman & Groth, 1997, 1999, 2000; Lorenzi, 2006, 2008).
The harvesting point was determined by
drying the lower leaves and “popping” of
about 80% of the plants, according to the methodology described by Baier et al. (2009). After harvesting, the onion bulbs were kept
in a shed for the “curing” process, where
they were subjected to the cleaning process, weighing and percentage sorting, according to the cross-sectional diameter (CEAGESP, 2001a, b), in class 5 (diameter higher than 9 cm), class 4 (diameter between 7 and 9 cm), class 3 (diameter between 7 and 5 cm), class 2 (diameter between 5 and 3.5 cm) and scrap (diameter lower than 3.5 cm) with a precision scale and a classifier built for this purpose.
Yield results of marketable bulbs (kg ha-1),
considering only the sum of classes 3 to 5, and
the total bulb yield (kg ha-1), determined
considering 8,000 m-2 of floor area, were
subjected to analysis of variance by the F-test (p < 0.01 and 0.05) and regression analysis
using the statistical software SigmaPlot 11.0®.
Determining the periods before interference (PBI), total period of interference prevention (TPIP) and critical period of interference prevention (CPIP) was carried out by estimating losses of 5% compared to the treatment that was developed free of coexistence with weeds, considering that this value refers to the chemical control cost.
For trend analysis of the effects of interference periods on the yield of marketable bulbs and total bulbs of onion crops, regression
studies were carried out. Mathematical models adjusted were Logistic and Gompertz, respectively, to estimate PBI (1) and TPIP (2), as described by Knezevic et al. (2002). Those models were the ones that best explained the biological behavior of the phenomenon evaluated, considering the significance of the parameters, the mean squares of the waste
and the values of R2 (Alvarez V. & Alvarez,
2006).
Y = A/(1+ABS(DATM/K)*EXP(B)) (eq. 1)
Y =A*EXP(-EXP(-(DATM-K)/B)) (eq. 2)
where Y refers to the yield of commercial or
total bulbs, expressed in kg ha-1; A refers to
the maximum asymptote in kg ha-1; DATM
refers to days after transplanting seedlings in which the crop remained free or subject to
coexistence with weed infestation; and B and
K are constants of the model.
RESULTS AND DISCUSSION
Weeds identified in the experimental area formed by the culture of onion transplanted in harvests 2012 and 2013 in the Brazilian municipality of Guarapuava, PR, totaled 24 and 20 species, distributed in 13 and 10 families,
respectively. Families Asteraceae, Poaceae and
Euphorbiaceae were those that showed the
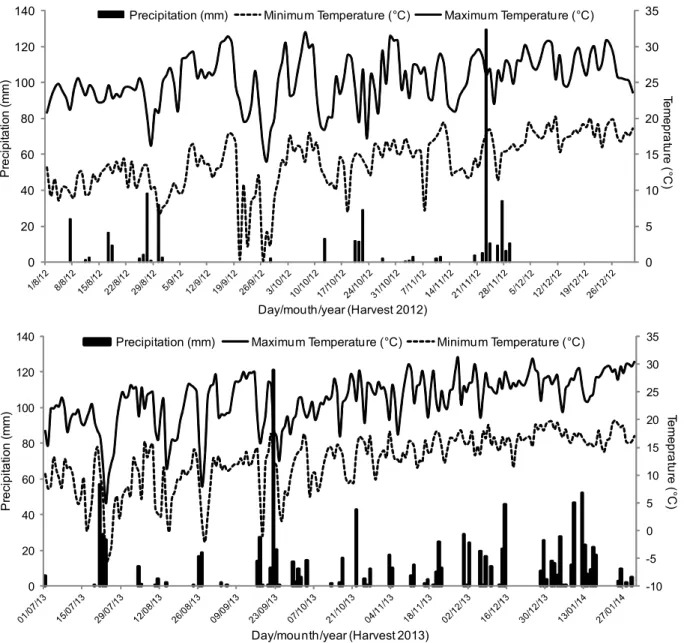
highest number of species in the two harvests studied, even with such contrasting weather conditions, according to variations in temperature and precipitation distribution (Figure 1).
In general, the main species that occurred
during the experiment were Digitaria
horizontalis, Raphanus raphanistrum, Brachiaria
plantaginea, Amaranthus sp. and Richardia
brasiliensis, in the 2012 harvest, and
R. raphanistrum, D. horizontalis, Ambrosia
artemiifolia, B. plantaginea and Bidens
subalternans, in the 2013 harvest. However,
Despite the great similarity of weed species that occurred between harvests on both infested conditions, they showed great competitive ability, especially in the 2012 harvest, since the dry mass of shoots tended to increase even with the reduction of their population (Figures 2A, B). According to Radosevich et al. (1997), as the population increases and the weeds grow, especially at the beginning of the cycle, the interspecific and intraspecific competition processes intensify, with domain and suppression of weeds of greater stature on the smaller ones.
This description explains the reduction in the weeds density in crops evaluated by increasing the shoots dry matter during the crop cycle (Afifi & Swanton, 2011). For Meschede et al. (2004), the accumulated dry matter is more important than the weeds density and shows an inverse correlation to the yield components of the crop.
The experimental units in which the onion crop was kept for increasing initial periods in coexistence with the weeds allowed to calculate the period in which these can
0 5 10 15 20 25 30 35
0 20 40 60 80 100 120 140
Te
m
e
p
rat
ur
e
(
°C
)
P
rec
ip
it
at
io
n
(
m
m
)
Day/mouth/year (Harvest 2012)
Precipitation (mm) Minimum Temperature (°C) Maximum Temperature (°C)
-10 -5 0 5 10 15 20 25 30 35
0 20 40 60 80 100 120 140
Te
m
e
p
rat
ur
e
(
°C
)
Pr
e
c
ip
it
a
tio
n
(
m
m
)
Day/mounth/year (Harvest 2013)
Precipitation (mm) Maximum Temperature (°C) Minimum Temperature (°C)
emerge and infest the crop without losses in yield. In this sense, it was verified that in 2012 and 2103 harvests 25 and 21, 21 and 25, 23 and 17 DATS were necessary for the onion crop harvested in densities of 0.6, 0.8 and
1.0 million plants ha-1, respectively, to show
significant yield losses of commercial bulbs (Figures 3 and 4). This period corresponds to the period before interference (PBI); weed control should be effectively carried out before that time so that there are no yield losses. As for the total period of interference prevention (TPIP) in the 2012 and 2103 harvests, total control of infestation was necessary up to 67 and 106, 70 and 120, 83 and 134 DATS for the onion crop, harvested in densities of 0.6, 0.8
and 1,0 million plants ha-1, respectively, to be
able to stand out in relation to weeds, not showing significant losses of commercial bulbs (Figures 3 and 4).
When analyzing the yield of total bulbs, it was observed that there was a great similarity of the responses to those identified for commercial bulbs in the 2012 and 2013 harvests, specially for the PBI values (Figures 3
and 4). However, in both cases there was no evidence of a behavior trend that could justify the increase and/or reduction in planting density to favor weeds control in the onion crop transplanted in Guarapuava, PR. In both crops, increased population density of the onion transplanted provided yield drop of commercial bulbs, regardless of coexistence or not with weeds. These results corroborated those
reported by Viegas D’Abreu (1996), Stoffella
(1996), Rumpel & Felczynski (2000), Cecílio Filho et al. (2006) and Resende & Costa (2006), who found a greater reduction in bulbs yield with the increase of the crop planting density. However, Baier et al. (2009) have found that
increasing the density of onion plants per m2
gave lower average mass of bulbs and increased yield in commercial classification 3 filled in a study conducted in Guarapuava, PR.
Thus, for the commercial bulbs yield, considering the average of the results among the planting densities studied, the period in which the control practices must be effectively adopted (CPIP) was characterized by the period between 23 at 73 and 21 at 120 DATS,
0 500 1000 1500 2000 2500 3000 3500 4000 4500 5000
14 28 56 112
D
en
s
it
y
o
f pl
an
ts
m
2
Days after transplanting seedlings (DATS)
Monocotyledons Eudicotyledons
0 50 100 150 200 250 300 350 400 450 500 550 600
14 28 56 112
Dr
y
m
a
tt
e
r
g
m
2
Days after transplanting seedlings (DATS)
Monocotyledons Eudicotyledons
0 200 400 600 800 1000 1200 1400 1600
14 28 56 112 168
Den
s
it
y
of
pl
a
n
ts
m
2
Days after transplanting seedlings (DATS)
Monocotyledons Eudicotyledons
0 100 200 300 400 500 600 700 800
14 28 56 112 168
D
ry
m
a
tte
r
g
m
2
Days after transplanting seedlings (DATS)
Monocotyledons Eudicotyledons
(A)
(B)
respectively, for the 2012 and 2013 harvests. As for the total bulbs yield, the average of results among planting densities, CPIP was characterized as of 20 at 55 and 26 at 112 DATS, respectively, for the 2012 and 2013 harvests.
Importantly, in the 2012 harvest planting was done too late, resulting in anticipation of the growing season and harvest at 112 DATS, and in the 2013 harvest there was frost, resulting in delays in the development of
0 5000 10000 15000 20000 25000 30000 35000
0 10 20 30 40 50 60 70 80 90 100 110 PTPI
PAI
Y = 32787,79*exp(-exp(-(x-26,4760)/13,9025)) R2: 0,99
Y = 32157,70/(1+abs(x/39,7540)/*exp(6,1823)) R2: 0,99
Dias Após Transplante das Mudas (DATM)
Pr od ut iv ida de B ul b o s C ome rc ia is ( kg ha -1)
PAI: 25 DATM PTPI: 67 DATM
PCPI: 25-67 DATM
Days after transplanting seedlings (DATS)
PBI: 25 DATS TPIP: 67 DATS
TPIP Y = 32787.79*exp (-exp (-(x - 26.4760)/l3.9025)) R2 : 0.99
CPIP: 25-67 DATS
PBIY = 32157.70/(1 + abs (x/39.7540)/*exp (6.1823)) R2 : 0.99 0 5000 10000 15000 20000 25000 30000 35000 40000 45000
0 10 20 30 40 50 60 70 80 90 100 110 Y = 38985,54*exp(-exp(-(x-18,83)/10,83)) R2: 0,99 Y = 38501,28/(1+abs(x/45,3570)/*exp(3,6622)) R2: 0,99
Pr od ut iv id ade B ul bos T ot ai s (k g ha -1)
Dias Após Transplante das Mudas (DATM) • PTPI
• PAI
PAI: 21 DATM PTPI: 51 DATM
PCPI: 21-51 DATM
Days after transplanting seedlings (DATS)
TPIP Y = 38985.54*exp (-exp (-(x - 18.83)/l0.83)) R2 : 0.99 PBI Y = 38501.28/(1 + abs (x/45.3570)/*exp (3.6622)) R2
: 0.99
PBI:21 DATS TPIP: 51 DATS
CPIP:21-51 DATS 0 2000 4000 6000 8000 10000 12000 14000
0 10 20 30 40 50 60 70 80 90 100 110 PTPI
PAI
Y = 13830,82*exp(-exp(-(x-32,14)/12,81)) R2: 0,99
Y = 13939,38/(1+abs(x/37,3960)/*exp(5,0346)) R2: 0,99
Dias Após Transplante das Mudas (DATM)
Pr odu ti vi dad e B ul bos C om er ci ai s (k g ha -1)
PAI: 21 DATM PTPI: 70 DATM
PCPI: 21-70 DATM
Days after transplanting seedlings (DATS)
TPIP Y = 13830.82*exp (-exp (-(x - 32.14)/l2.81)) R2 : 0.99 PBI Y = 13939.38/(1 + abs (x/37.3960)/*exp (5.0346)) R2: 0.99
PBI:21 DATS TPIP: 70 DATS
CPIP:21-70 DATS 0 5000 10000 15000 20000 25000 30000 35000
0 10 20 30 40 50 60 70 80 90 100 110 Y = 28720,75*exp(-exp(-(x-18,63/14,53)) R2: 0,99 Y = 29147,15/(1+abs(x/47,872)/*exp(2,9557)) R2: 0,99
Pr odut ivi dade B ul bos T ot ai s ( kg ha -1)
Dias Após Transplante das Mudas (DATM)
•PTPI
• PAI
PAI: 15 DATM PTPI: 61 DATM
PCPI: 15-61 DATM
Days after transplanting seedlings (DATS)
TPIP Y = 28720.75*exp (-exp (-(x - 18.63)/l4.53)) R2 : 0.99 PBI Y = 29147.15/(1 + abs (x/47.872)/*exp (2.9557)) R2: 0.99
PBI: 15 DATS TPIP: 61 DATS
CPIP: 15-61 DATS
0 1000 2000 3000 4000 5000 6000 7000 8000 9000
0 10 20 30 40 50 60 70 80 90 100 110 PTPI
PAI
Y = 6947,48*exp(-exp(-(x-37,06)/16,44)) R2: 0,99 Y = 7155,32/(1+abs(x/38,4260)/*exp(5,5467)) R2: 0,99
Dias Após Transplante das Mudas (DATM)
Pr od ut iv id ad e B ul bo s C o me rc ia is ( k g h a -1)
PAI: 23 DATM PTPI: 83 DATM
PCPI: 23-83 DATM
TPIP Y = 6947.48*exp (-exp (-(x - 37.06)/l6.44)) R2 : 0.99 PBI Y = 7155.32/(1 + abs (x/38.4260)/*exp (5.5467)) R2
: 0.99
PBI:23 DATS TPIP: 83 DATS
CPIP: 23-83 DATS
Days after transplanting seedlings (DATS)
0 5000 10000 15000 20000 25000 30000 35000
0 10 20 30 40 50 60 70 80 90 100 110 Y = 27817,54*exp(-exp(-(x-18,53/12,10)) R2: 0,99 Y = 31328,32*exp(-exp(-(x/52,72)/-21,90)) R2: 0,99
Pr odu ti vi da de B u lb o s T o ta is ( k g h a -1)
Dias Após Transplante das Mudas (DATM)
•PTPI
• PAI
PAI: 21 DATM PTPI: 54 DATM
PCPI: 21-54 DATM
Days after transplanting seedlings (DATS)
TPIP Y = 27817.54*exp (-exp (-(x - 18.53)/l2.10)) R2 : 0.99
PBI Y = 31328.32*exp (-exp (-(x/52.72)/21.90)) R2 : 0.99
PBI:21 DATS TPIP: 54 DATS
CPIP: 21-54 DATS
weeds. In this sense, due to the weeds shoots dry matter formation (Figure 2) and/or covering of the soil surface in the experimental units, earliest development of the weed community was found in the 2012 harvest and later in the 2013 harvest. These results partially corroborate those by Cavalieri (2013), who mentions that the critical periods of weeds interference prevention (CPIP) in the onion culture transplanted, on average, will be from
the 27th to the 56th days of the crop cycle; those
by Garcia et al. (1994), in a study developed in
Figure 3 - Commercial bulbs yield and totals of onion transplanted in densities of 0.6, 0.8 and 1.0 million plants ha-1 (A, B and C) subjected to coexistence periods (PBI) and control (TPIP) of weeds in the 2012 harvest. Guarapuava, PR, 2012.
(A)
(B)
the Brazilian State of Rio Grande do Sul, who reported TPIP of three onion cultivars as being from 61 to 74 DATS; and those by Paller et al. (1971) and Bond & Burston (1996), who reported values of TPIP for the onion transplanted as being from 49 to 56 and 21 to 56 DATS, respectively.
This variation in results is due to the action of factors that influence the degree of interference of the weed community on the crop, such as the set of prevailing weeds and the cultivars used. Conversely, in a study
developed in the Brazilian region of Jaboticabal, SP, Soares et al. (2003) have reported the occurrence of PBI of 42 DATS for onion cultivars Mercedes, Granex33, Superex and Serrana. Therefore, the regional knowledge of interference periods may feature more or less need for infestation control for transplanted onion, or even the establishment of more appropriate dosages of the herbicides, which therefore will allow the reduction of the amount and frequency of the control interventions, the production cost and possible environmental impact. 0 10000 20000 30000 40000 50000 60000 70000 80000
0 10 20 30 40 50 60 70 80 90 100 110 120 130 140 150 160 170 PTPI
PAI
Y = 63604,33*exp(-exp(-(x-45,43)/20,73)) R2: 0,99 Y = 67947,56/(1+abs(x/48,7197)*exp(4,09)) R2: 0,99
Dias Após Transplante das Mudas (DATM)
Pr od ut iv id ade B u lbo s C o m er c ia is ( kg ha -1)
PAI: 21 DATM
PTPI: 106 DATM
PCPI: 21-106 DATM
Days after transplanting seedlings (DATS) PBI: 21 DATS
TPIP: 106 DATS TPIP Y = 63604.33*exp (-exp (-(x - 45.43)/20.73)) R2: 0.99
CPIP: 21-106 DATS
PBIY = 67947.56/(1 + abs (x/48.7197)/*exp (4.09)) R2 : 0.99 0 5000 10000 15000 20000 25000 30000 35000 40000
0 10 20 30 40 50 60 70 80 90 100 110 120 130 140 150 160 170 PTPI
PAI
Y = 33308,09*exp(-exp(-(x-53,73)/23,82)) R2: 0,99
Y = 30956,56/(1+abs(x/54,5271)*exp(3,7532)) R2: 0,99
Dias Após Transplante das Mudas (DATM)
Pr odut iv id a d e B ul b o s C o m er ci a is ( kg ha -1)
PAI: 25 DATM PTPI: 120 DATM
PCPI: 25-120 DATM
PBI: 25 DATS TPIP: 120 DATS
TPIP Y = 33308.09*exp (-exp (-(x - 53.73)/23.82)) R2 : 0.99
CPIP: 25-120 DATS
PBIY = 30956.56/(1 + abs (x/54.5271)/*exp (3.7532)) R2: 0.99
Days after transplanting seedlings (DATS)
0 5000 10000 15000 20000 25000 30000 35000 40000 45000 50000
0 10 20 30 40 50 60 70 80 90 100 110 120 130 140 150 160 170 PTPI
PAI
Y = 42056*exp(-exp(-(x-56,23)/30,42)) R2: 0,99
Y = 39617,32/(1+abs(x/46,2919)/*exp(3,0932)) R2: 0,99
Dias Após Transplante das Mudas (DATM)
Pr od ut iv id ade B ul bos C o m er ci ai s (kg ha
-1) PAI: 17 DATM PTPI: 134 DATM
PCPI: 17-134 DATM
Days after transplanting seedlings (DATS)
PBI: 17 DATS TPIP: 134 DATS
TPIP Y = 42056*exp (-exp (- exp (x - 56.23)/30.42)) R2: 0.99
CPIP: 17-134 DATS
PBIY = 39617.32/(1 + abs (x/46.2919)/*exp (3.0932)) R2 : 0.99 0 10000 20000 30000 40000 50000 60000 70000 80000
0 10 20 30 40 50 60 70 80 90 100 110 120 130 140 150 160 170
Pr od ut iv id ad e B ul b o s T o ta is ( k g ha -1)
Y = 69647,24*exp(-exp(-(x-39,65)/21,64)) R2: 0,99 Y = 70725,09/(1+abs(x/51,4988)/*exp(3,8856)) R2: 0,99
Dias Após Transplante das Mudas (DATM)
•PTPI
• PAI
PAI: 25 DATM PTPI: 102 DATM
PCPI: 25-102 DATM
Days after transplanting seedlings (DATS) TPIP: 102 DATS PBI:25 DATS
CPIP: 25-102 DATS
PBIY = 70725.09/(1 + abs (x/51.4988)/*exp (3.8856)) R2: 0.99 TPIP Y = 69647.24*exp (-exp (-(x - 39.65)/21.64)) R2
: 0.99 0 5000 10000 15000 20000 25000 30000 35000 40000 45000 50000
0 10 20 30 40 50 60 70 80 90 100 110 120 130 140 150 160 170
P ro d u tiv id a d e B u lb o s T o ta is (k g h a -1)
Y = 40966,28*exp(-exp(-(x-43,59)/24,83)) R2: 0,99
Y = 30956,56/(1+abs(x/54,5271)*exp(3,7532)) R2: 0,99
Dias Após Transplante das Mudas (DATM) PAI: 25 DATM
PTPI: 114 DATM
PCPI: 25-114 DATM
Days after transplanting seedlings (DATS)
TPIP: 114 DATS PBI:25 DATS
CPIP: 25-114 DATS
● PBIY = 30956.56/(1 + abs (x/54.5271)/*exp (3.7532)) R2: 0.99
● TPIP Y = 40966.28*exp (-exp (-(x - 43.59)/24.83)) R2 : 0.99 0 10000 20000 30000 40000 50000 60000
0 10 20 30 40 50 60 70 80 90 100 110 120 130 140 150 160 170
Pr o dut ivi dad e B ul bos T ot ai s ( k g ha -1)
Y = 48452,35*exp(-exp(-(x-44,25)/27,59)) R2: 0,99
Y = 45431,18/(1+abs(x/58,1180)/*exp(4,0822)) R2: 0,99
Dias Após Transplante das Mudas (DATM)
PAI: 29 DATM PTPI: 120 DATM
PCPI: 29-120 DATM
PBI: 29 DATS
CPIP: 29-120 DATS
Days after transplanting seedlings (DATS)
● TPIP Y = 48542.35*exp (-exp (-(x - 44.25)/27.59)) R2: 0.99 ● PBIY = 45431.18/(1 + abs (x/58.1180)/*exp (4.0822)) R2
: 0.99
TPIP: 120 DATS
Figure 4 - Commercial bulbs yield and totals of onion transplanted in densities of 0.6, 0.8 and 1.0 million plants ha-1 (A, B and C) subjected to coexistence periods (PBI) and control (TPIP) of weeds in the 2013 harvest. Guarapuava, PR, 2013.
(A)
(B)
In view of the results, it can be concluded that onion Crioula Mercosul transplanted in the Brazilian region of Guarapuava, PR, showed, on average, CPIP of 23 at 73 and 21 at 120 DATS for the commercial bulbs yield. No viability in increasing plant density in the transplanting was found as a management practice that favors the reduction of CPIP without impairing the yield of commercial and/or total bulbs of the crop.
ACKNOWLEDGEMENT
The authors are grateful to Capes/ Fundação Araucária (Coordenação de Aperfeiçoamento de Pessoal de Nível Superior/ Fundação Araucária) for granting the scholarship.
LITERATURE CITED
AFIFI, M.; SWANTON, C. J. Maize seed and stem roots
differ in response to neighbouring weeds. Weed Res., v. 51,
n. 5, p. 442-450, 2011.
ALVAREZ, V. H.; ALVAREZ, G. A. M. Comparações de
médias ou testes de hipóteses? Contrastes! B. Inf. SBCS,
v. 31, n. 1, p. 24-34, 2006.
ANGIOSPERM PHYLOGENY GROUP – APG II. An update of the Angiosperm Phylogeny Group classification for
the orders and families of flowering plants: APG II. Bot. J.
Linnean Soc., n. 141, p. 399-436, 2003.
BAIER, J. E. et al. Produtividade e rendimento comercial de bulbos de cebola em função da densidade de cultivo.
Ci. Agrotecnol., v. 33, n. 2, p. 496-501, 2009.
BOND, W.; BURSTON, S. Timing the removal of weeds
from drilled salad onions to prevent crop losses. Crop
Protec., v. 15, n. 2, p. 205-211, 1996.
CARVALHO, L. B. et al. Interferência e estudo fitossociológico da comunidade infestante na cultura da beterraba transplantada.
Acta Sci. Agron., v. 30, n. 3, p. 325-331, 2008.
CAVALIERI, S.D. Árvore do conhecimento cebola: Plantas
daninhas – matointerferência. Agência Embrapa de Informação tecnológica. AGEITEC, 2013. Disponível em: <http:// www.agencia.cnptia.embrapa.br/gestor/cebola/arvore/ CONT000gn9eurvp02wx5ok0liq1mqz0umhli.html>. Acesso em: 12 mar. 2014.
COMPANHIA DE ENTREPOSTOS E ARMAZÉNS GERAIS DO ESTADO DE SÃO PAULO – CEAGESP.
Programa Brasileiro para a melhoria dos padrões comerciais e embalagens de hortigranjeiros. São Paulo: 2001a.
COMPANHIA DE ENTREPOSTOS E ARMAZÉNS GERAIS DO ESTADO DE SÃO PAULO – CEAGESP.
Programa brasileiro para modernização da horticultura:
Classificação da cebola (Allium cepa L.). Impresso CEAGESP,
2001b. Disponível em: <http://www.ceagesp.gov.br/wp-content/uploads/2015/07/cebola.pdf>. Acesso em: 12 jul. 2015.
CECÍLIO FILHO, A. B. et al. produtividade e qualidade de bulbos de duas cultivares de cebola em função da população
de plantas, em semeadura direta. Caatinga, v. 19, n. 2,
p. 146-152, 2006.
CONCENÇO, G. et al. Phytosociological surveys: tools for
weed science. Planta Daninha, v. 31, n. 2, p. 469-482, 2013.
EMPRESA BRASILEIRA DE PESQUISA
AGROPECUÁRIA – EMBRAPA. Sistema brasileiro de
classificação de solos. 3.ed. Brasília, DF: 2013. 353 p.
GARCIA, D. C.; BARNI, V.; STORCK. L. Influência da interferência de plantas daninhas no rendimento de bulbos de
cebola. Pesq. Agropec. Bras., v. 29, n. 10, p. 1557-1563,
1994.
KISSMANN, K. G.; GROTH, D. Plantas infestantes e
nocivas. 2.ed. São Paulo: BASF, 1997. Tomo I. 825 p.
KISSMANN, K. G.; GROTH, D. Plantas infestantes e
nocivas. 2.ed. São Paulo: BASF, 1999. Tomo II. 978 p.
KISSMANN, K. G.; GROTH, D. Plantas infestantes e
nocivas. 2.ed. São Paulo: BASF, 2000. Tomo III. 722 p.
KNEZEVIC, S. Z. et al. Critical period for weed control: the
concept and data analysis. Weed Sci., v. 50, n. 6, p. 773-786,
2002.
KÖPPEN, W. Climatologia: com um estudio de los climas
de la tierra. México: Fondo de Cultura Econômica, 1948. 478 p.
LORENZI, H. Manual de identificação e controle de
plantas daninhas: plantio direto e convencional. 6.ed. Nova Odessa: Plantarum, 2006. 339 p.
LORENZI, H. Plantas daninhas do Brasil: terrestres,
aquáticas, parasitas e tóxicas. 4.ed. Nova Odessa: Plantarum, 2008. 640 p.
MESCHEDE, D. K. et al. Período anterior à interferência de plantas daninhas em soja: estudo de caso com baixo estande e
testemunhas duplas. Planta Daninha, v. 22, n. 2,
p. 239-246, 2004.
MENEZES JÚNIOR, F. O. G.; VIEIRA NETO, J. Produção
da cebola em função da densidade de plantas. Hortic. Bras.,
PALLER, E. C. Jr. et al. Duration of weed competition and
control and yield. II. Transplanted onions. Philippine Agric.,
v. 55, n. 516, p. 221-224, 1971.
PITELLI, R. A. Interferência de plantas daninhas em culturas
agrícolas. Inf. Agropec., v. 11, n. 129, p. 16-27, 1985.
QASEM, J. R. Critical Period of Weed Competition in Onion (Allium cepa L.) in Jordan. Jordan J. Agric. Sci., v. 1, n. 1, p. 32-42, 2005.
RADOSEVICH, S. R.; HOLT, J.; GHERSA, C. Ecology of
weeds and invasive plants: relationship to agriculture and natural resource management. 3.ed. New York: John Wiley and Sons, 2007. 454p.
RESENDE, G. M.; COSTA, N. D. Produtividade e massa fresca de bulbos de cebola sob densidades de plantio no
Vale do São Francisco. Hortic. Bras., v. 24, n. 2, p. 228-232,
2006.
RUMPEL, J.; FELCZYNSKI, K. Effect of plant density on
yield and bulb size of direct sown onions. Acta Hortic.,
v. 533, n. 1, p. 179-186, 2000.
SOARES, D. J. et al. Períodos de interferência das plantas
daninhas na cultura de cebola (Allium cepa) transplantada.
Planta Daninha, v. 21, n. 3, p. 387-396, 2003.
SOARES, D. J. Importância das plantas daninhas na cultura
da cebola. J. ConsHerb, v. 2, n. 7, p. 2-3, 2004.
SOUZA, V. C.; LORENZI, H. Botânica sistemática: guia
ilustrado para identificação das famílias de angiospermas da flora brasileira, baseado em APG II. Nova Odessa: Plantarum, 2005. 640 p.
STOFFELLA, P. J. Planting arrangement and density of transplants influence sweet Spanish onion yields and bulb
size. HortScience, v. 31, n. 7, p. 1129-1130, 1996.
USMAN, K. et al. Integrated weed management in okra.
Pakistan J. Weed Sci. Res., v. 11, n. 1-2, p. 55-60, 2005.
VIEGAS D’ABREU, D. A. Effect of nitrogen and spacing on
bulb splitting in onion cv. Bombay Red. TVIS Newsletter,
v. 1, n. 2, p. 1-26, 1996.
ZANATTA, J. F. et al. Interferência de plantas daninhas em