ABSTRACT
RESUMO
Submitted on 02/25/2014 and approved on 10/21/2015. 1 Extracted from the first author's Masters thesis.
2 Universidade Estadual de Feira de Santana, Departamento de pós-graduação em Recursos Genéticos Vegetais, Feira de Santana, Bahia, Brasil. leonardokoelho@hotmail.com 3 Embrapa Semiárido, Petrolina, Pernambuco, Brasil. carlos-fernandes.santos@embrapa.br
4 Embrapa Semiárido, Petrolina, Pernambuco, Brasil. laertediniz@hotmail.com; layana-alves@hotmail.com; ednad.nunes@hotmail.com * Corresponding author: leonardokoelho@hotmail.com
Phenotypic correlations and path analysis for plant architecture traits
and grain production in three generations of cowpea
1The objective of this study was to analyze the phenotypic correlation and path analysis of traits related to plant architecture, earliness and grain yield in F2, RC1 and RC2 generations, from crosses between cowpea cultivars BRS Carijó and BR14 Mulato. Most phenotypic correlations of the examined traits were concordant in statistical significance, with approximate values among the examined generations. For the trait seed weight, significant and positive phenotypic correlations were observed in the three generations only for the trait number of secondary branches. The values of the direct effects were in agreement with the values of the phenotypic correlations, which indicate true association by the phenotypic correlation among the traits of grain yield examined. Path analysis indicated that the selection of productive plants will result in early plants and an increased number of secondary branches. In F2, plants with shorter length of the main branch and shorter length of secondary branches can be obtained. The causal model explained 15 to 30% of the total variation in grain weight in relation to the traits examined. The analyses indicated the possibility of selecting plants with a higher and early grain yield, shorter length of primary branches and lower number of nodes, which are important variables for mechanical or semi-mechanical harvesting.
Key words: Vigna unguiculata, Mechanical harvesting, Plant habits.
Hugo Leonardo Coelho Ribeiro2*, Carlos Antônio Fernandes Santos3
, Laerte da Silva Diniz 4,
Layana Alves do Nascimento4, Edna Deodato Nunes4
10.1590/0034-737X201663010005
Correlações fenotípicas e análise de trilha para caracteres da arquitetura da planta e
produção de grãos em três gerações de feijão caupi
O objetivo desse trabalho foi analisar correlações fenotípicas e análise de trilha de caracteres relacionados à arqui-tetura da planta, precocidade e produção de grãos em gerações F2, RC1 e RC2, provenientes do cruzamento entre as cultivares de feijão caupi BRS Carijó e BR14 Mulato. A maioria das correlações fenotípicas dos caracteres avaliados foi concordante em significância, com valores aproximados nas gerações avaliadas. Para o caráter peso de grãos, foram observadas correlações fenotípicas significativas e positivas nas três gerações apenas com o caráter número de ramos secundários. Os valores dos efeitos diretos concordaram com os valores das correlações fenotípicas, indicando verda-deira associação entre os caracteres avaliados com peso de grãos. A análise de trilha indicou que a seleção de plantas produtivas resultará em plantas precoces e de maior número de ramos secundários. Em F2, plantas com menor compri-mento de ramo principal e compricompri-mento de ramos secundários poderão ser obtidas. O modelo causal explicou de 15 a 30% da variação total de peso de grãos em relação aos caracteres avaliados. As análises indicaram a possibilidade de selecionar plantas com maior produção de grãos, precoces, com menor comprimento de ramos primários e menor núme-ro nós, que são variáveis importantes para a colheita mecânica ou semi-mecânica.
INTRODUCTION
Cowpea (Vigna unguiculata (L.) Walp.) is one of the most adapted, versatile and nutritious legumes among the cultivated species, constituting an important food stuff and essential production component in dry climate regions of the tropics, covering part of Asia, the United States, the Middle East and Central and South America (Singh et al., 2002). In Brazil, cowpea is grown mainly in the semiarid northeast, where it is adapted to the climatological and soil conditions, contributing to 35.6% of the planted area and 15% of the total bean production (cowpea + common bean) in the country (Silva, 2009).
The cowpea crop, traditionally explored in family farming systems, in rainfed agriculture and with a low level of technology, has been researched more intensively over the past few decades (Xavier, et al., 2005). This has led to an improvement in yield, which, among other factors, has attracted the attention of medium and large producers (Bezerra et al., 2008; Freire Filho et al., 2005), with emphasis in the region of the ‘Cerrados’, to use it in crop rotation with major crops, like corn and soybean. Thus, these facts have generated a demand for cultivars to meet the requirements of management and handling in technified systems.
Plant habits and growth have direct influence on the response of cowpea to population management because of the observed decrease in grain production per plant, as a consequence of the increased plant population per hec-tare, which occurs to a lesser degree in the erect than in the climbing genotypes (Cardoso et al., 1997; Nangju et al., 1975). Bezerra et al. (2005) state that the plant architecture and the production system have an influence in determining the arrangement of more adequate plant number to efficiently take advantage of the production factors and maximize the production potential of the culti-var.
In this sense, the intrinsic characteristics of ideotypes for cowpea that allow mechanized or semi-mechanized harvesting should be incorporated into the plant aiming at obtaining genotypes that resemble the common bean plant (Phaseolus vulgaris L.), facilitating commercial exploitation on a large scale. According to Adams (1982) and Matos Filho et al. (2009) features such as length and number of nodes of the main stem and number of leaves should be taken into account because the size of the plant should allow penetration and light interception, be resistant to damping and lodging, facilitate mechanical harvesting, have length and number of nodes of reasonable business and physiological efficiency in the conversion of metabolic products in grain production.
The estimates of the correlation coefficients permit to foresee the alterations in a specific trait that is caused by
the selection pressure imposed on other traits (Coimbra
et al., 1999). This analysis is of great relevance because in breeding programs, apart from improving a specific trait, other traits of the plant are usually improved (Cruz et al., 2006).
The path analysis method that was developed by Wright (1921) allows the participation of the correlation coefficients in direct and indirect effects. Cruz et al. (2006) define the path coefficient or cause and effect analysis as a standardized regression coefficient because path analysis is composed of an expansion of multiple regression when complex interrelationships are involved. Studies of contrasting populations of cowpea plants and progeny resulting from crossings and backcrossings, using methods such as phenotypic correlation and path analysis, maximize knowledge about the characters involved in the formation of the plant. The use of F2 populations, BC1 and BC2 in these studies help in a positive way the understanding of genetic interactions, its causes and effects in the environment in which these populations were tested.
Some studies have been carried out to examine correlations between traits and path analysis. Brothers and Kelly (1993) observed a negative correlation in common bean in the values obtained for architecture and secondary branch angle. Collicchio et al. (1997) quoted a non-association between the plant habit and the weight of 100 seeds, which makes it possible to select erect common bean plants of any seed size. Oliveira et al. (1990) observed positive correlations in cowpea between the length of the main branch, number of lateral branches and number of nodes with leaves per plant. They also quoted the positive indirect effect between grain production with length and number of nodes of the main branch, foliar area and number of lateral branches by number of pods per plants. Bezerra et al. (2001) observed the negative direct effect of the number of nodes of the main branch on grain yield (-0.52) and a genetic correlation of 0.32.
The goal of this was to analyze the phenotypic correlations and path analysis of three segregating generations of the same cross of cowpea with the objective of developing adequate genotypes for mechanical or semi-mechanical harvesting.
MATERIAL AND METHODS
climbing stature, indeterminate growth and a cycle of 75 days from planting to the first harvest.
Crosses and backcrosses were carried out at flower initiation of the plants, according to Rachie et al. (1975). Backcrosses were carried out between F1(BRS Carijó x BR14 Mulato) x P2, abbreviated as BC1, and F1(BRS Carijó x BR14 Mulato) x P1, abbreviated as BC2. Besides the seeds of the backcrosses, seeds were obtained from the parents and the F2, through self-fertilization of the latter and the F1, respectively.
The F2, BC1 and BC2 generations were planted in the Bebedouro Experimental Field of Embrapa Semiárido, Petrolina, PE. Each row was 30 m long with spacing of 1.5 m x 0.2 m between the lines and the holes, respectively. External lateral borders for the experiment were realized by planting cowpea seeds of the ‘Canapu’ type.
The examined traits were days to maturity of the pod (DPM), which was the number from sowing to maturity of approximately 50% of the pods; length of the main branch (LMB), which consisted of length, in cm, between the stem base and the apex of the main branch; length of the largest secondary branch (LSB), which was measured, in cm, from the beginning to the apex of the largest secondary branch; numbers of secondary branches (NSB), which was the number of secondary branches inserted into the stem of the plant; number of nodes of the main branch (NOD), which was the number of nodes from the insertion node of the unifoliar leaves until the last node of the main branch and the weight of the grains (GW),which consisted of the total weight, in grams (g), of grains with 13% of humidity, produced individually per plant of each examined generation.
The estimates of the phenotypic correlation coefficients between the pairs of traits were calculated based on the estimates of the variances and covariances according to Kempthorne (1973).
V(X + Y) = V(X) + V(Y) + 2COV(X, Y),
so: . In which
V(X + Y): variance of the sum of the traits X and Y; V(X) and V(Y): variance of the traits X and Y, respectively; COV(X,Y): covariance between the traits X and Y.
The phenotypic correlation (rF) is given by .
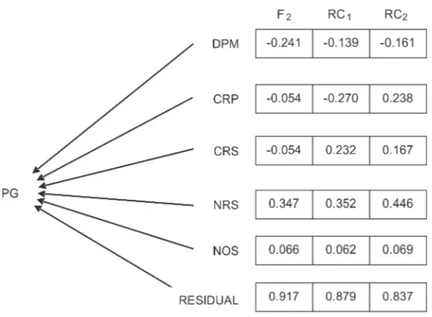
The path analysis was represented by the cause-effect diagram in Figure 1 and shows the interrelationships between PG, dependent variable and the non dependent variables DPM, LMB, LSB, NSB and NOD. In the cause-effect diagram (Figure 1), the unidirectional arrows represent the direct influence of each of the explanatory
traits on the main trait, measured by the path coefficient (Pjn), while the bidirectional arrows indicate correlation between the traits, which is measured by the coefficient (rij). The direct influence is measured by the sum total of the products of the correlation coefficients by the path coefficients. All the analyses were performed with the GENES software (Cruz, 2006).
RESULTS AND DISCUSSION
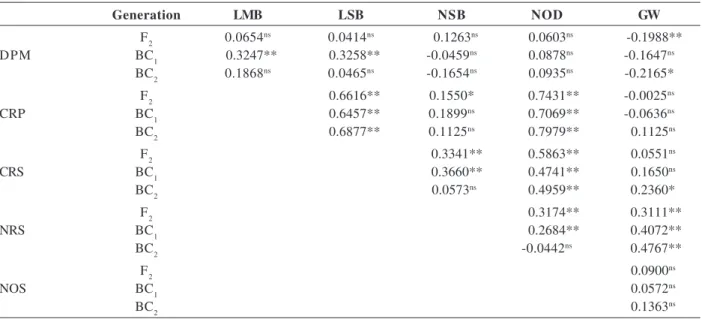
Concordant phenotypic correlations were obtained with statistical significance and approximate values in the three generations analyzed, namely LMB x LSB, LMB x NOD, LSB x NOS and NSB x GW (Table 1). Apart from the correlation between traits being specific to a population (Santos & Gilmara, 2004), not serving as reference relation between two traits for a given species, a large concordance was expected because the three examined generations resulted from the same cross. Kurer (2010) found similar data when evaluating two generations of a cowpea cross and reported a phenotypic correlation of 0.044 (F2) and a significant value of 0.357 (F3) between plant height and weight of 100 grains, and significant and similar correlations of 0.462 and 0.392 in F2 and F3, respectively, between the number of branches and pods per plant.
positive and significant, indicating the possibility of obtaining biased plants to damping (Table 1).
The highest positive values of phenotypic correlations were observed between LMB x NOD, LMB x LSB and LSB x NOD (Table 1) in the examined generations, which indicates that the positive selection of one of these traits will result in increases in the other two traits, in other words, the negative selection should be performed to
obtain plants with an architecture that is suitable for mechanical or semi-mechanical harvesting.
The direct values of the causal effect of the plant architecture traits and days to maturity in the grain production were in agreement in the three generations examined for the majority of the variables studied, except for the length of the main branch and the secondary branches (Figure 2). The values of the direct effects were
Table 1: Estimates of the phenotypic correlation coefficient between the traits days to maturity of the pod (DPM), length of the main branch (LMB), length of the secondary branch (LSB), number of secondary branches (NSB), number of nodes of the main branch (NOD) and grain weight (GW) in the F2, BC1 and BC2 generations of the cross between BRS Carijó x BR14 Mulato
Generation LMB LSB NSB NOD GW
F2 0.0654ns 0.0414ns 0.1263ns 0.0603ns -0.1988**
DPM BC1 0.3247** 0.3258** -0.0459ns 0.0878ns -0.1647ns
BC2 0.1868ns 0.0465ns -0.1654ns 0.0935ns -0.2165*
F2 0.6616** 0.1550* 0.7431** -0.0025ns
CRP BC1 0.6457** 0.1899ns 0.7069** -0.0636ns
BC2 0.6877** 0.1125ns 0.7979** 0.1125ns
F2 0.3341** 0.5863** 0.0551ns
CRS BC1 0.3660** 0.4741** 0.1650ns
BC2 0.0573ns 0.4959** 0.2360*
F2 0.3174** 0.3111**
NRS BC1 0.2684** 0.4072**
BC2 -0.0442ns 0.4767**
F2 0.0900ns
NOS BC1 0.0572ns
BC2 0.1363ns
* and **: Significant at 1 and 5% of probability by t-test, respectively.
ns: non-significant.
in agreement with the values of the estimates of the phenotypic correlations, which indicate that they explain the true association that exists between the traits of plant architecture and earliness of grain production (Table 1 and Figure 2). Bezerra et al. (2001) reported similarities between path analysis and genetic correlations for initial flowering traits and weight of 100 grains in relation to grain yield. On the other hand, Peksen and Artik (2004) reported different values between the direct effect (0.195) and significant simple correlation (0.509) for the trait weight of 100 grains in relation to grain yield.
The path analysis indicates that the selection of productive plants will result in early plants (DPM) and in an increased number of secondary branches (NSB) (Figu-re 2). Plants with a shorter length of the main branch (LMB) in the F2 and BC1 generations and with shorter branches in the F2 generation can be obtained during the selection because they show negative direct values in relation to grain production. Kumari et al. (2010) reported the negative direct effect of days to maturity and number of branches in relation to grain yield, which indicates the possibility of selecting early, productive plants with shorter branches. Bezerra et al. (2001), as well as Peksen and Artik (2004), reported similar negative direct effects (-0.188 and -0.134, respectively) in relation to cowpea grain yield.
The determination coefficients of the causal model, considering the five explanatory variables, were 0.1590, 0.2260 and 0.2992 of the F2, BC1 and BC2 generations, respectively (Figure 2), which indicates that the adopted model explains a small fraction of the primary grain weight variable and that new variables should be included in the
causal model to explain the quasi-totality of the variation of the grain production. This low determination was expected because variables such as number of pods per plant, number of seeds per pod and weight of a grain were not included in the present model. Taking these variables into consideration, Bezerra et al. (2001), who evaluated cowpea and Santos et al. (1995) who evaluated soybean, reported a determination coefficient of 84.32% and 100%, respectively. Gonçalves et al. (2003) showed a determination coefficient of 97.5%, which is similar to that found by Cabral et al. (2011) (R2 = 95.9%), which indicates that the variables almost
completely explained the basic variable in common beans.
CONCLUSION
In general, the information of the phenotypic correlations and of the direct effects of the plant architecture variables and days to maturity indicated that it is possible to select plants with an increased grain production and with a smaller number of days to harvest and with a shorter length of the main branch and shorter length of the secondary branch, which are important characteristics for mechanical or semi-mechanical harvesting.
Similarly, the results show difficulties for the selection of plants with a smaller number of secondary branches, which is an important variable for mechanical or semi-mechanical harvesting.
ACKNOWLEDGMENT
REFERENCES
Adams MW (1982) Plant architecture and yield breeding. Iowa Journal of Research, 56:225-254.
Benvindo RN, Silva JAL da, Freire Filho FR, Almeida ALG de, Oliveira JTS & Bezerra AA de C (2010) Avaliação de genótipos de feijão caupi de porte semi-prostrado em cultivo de sequeiro e irrigado. Comunicata Scientiae, 1:23-28.
Bezerra AA de C (2005) Efeitos de arranjos populacionais na morfologia e produtividade de feijão caupi de crescimento de-terminado e porte ereto. Tese de doutorado. Universidade Fede-ral do Ceará, Fortaleza. 123p.
Bezerra AA de C, Assunção Filho CJ, Freire Filho FR & Ribeiro VQ (2001) Inter-relação entre caracteres de caupi de porte ereto e crescimento determinado. Pesquisa Agropecuária Brasileira, 36:137-142.
Bezerra AA de C, Távora FJAF, Freire Filho FR & Ribeiro VQ (2008) Morfologia e produção de grãos em linhagens modernas de feijão caupi submetidas a diferentes densidades populacionais. Revista de Biologia e Ciências da Terra, 8:85-93.
Brothers ME & Kelly JD (1993) Interrelationship of plant architecture and yield components in pinto bean ideotype. Crop Science,33:1234-1238.
Cabral PDS, Soares TCB, Lima ABP, Soares YJB & Silva JAD de (2011) Análise de trilha do rendimento de grãos de feijoeiro
(Phaseolus vulgaris L.) e seus componentes. Revista Ciência
Agronômica, 42:132-138.
Cardoso MJ, Melo F de B & Andrade Júnior AS de (1997) Densida-de Densida-de plantas Densida-de caupi em regime irrigado. Pesquisa Agropecuária Brasileira, 32:399-405.
Coimbra JLM, Guidolin AF, Meroto Júnior A, Sangoi L, Ender M & Carvalho FIF de (1999) Estabilidade fenotípica em genótipos de canola no planalto catarinense. Ciência Rural,4:74-82.
Collicchio E, Ramalho MAP & Abreu A de FB (1997) Associação entre o porte da planta de feijoeiro e o tamanho dos grãos. Pesquisa Agropecuária Brasileira,32:97-304.
Cruz CD (2006) Programa Genes - Biometria. Viçosa, Editora UFV. 382p.
Cruz CD, Regazzi AJ & Carneiro PCS (2006) Modelos biométricos aplicados ao melhoramento genético. 2ª ed. Viçosa, Editora UFV. 585p.
Freire Filho FR (2005) Melhoramento Genético. In: Freire Filho FR, Lima JA de A & Ribeiro VQ (Eds.) Feijão caupi: avanços tecnológicos. Brasília, Embrapa Informação Tecnológica. p.29-75.
Gonçalves MC, Correa AM, Destro D, Souza LCF de & Sobrinho T (2003) A Correlations and path analysis of common bean grain yield and its primary components. Crop Breeding and Applied Biotechnology, 3:217-222.
Kempthorne O (1973) An introduction to genetic statistics. Ames, The State University Press. 454p.
Kumari RU, Usharani KS, Suguna R & Anandakumar CR (2010) Relationship between the yield contributing characters in cowpea for grain purpose [vigna unguiculata (L). Walp]. Electronic Journal of Plant Breeding,1:882-884.
Kurer S, Gangaprasad S, Uma MS, Shanthakumar G & Salimath PM (2010) Genetic variability studies in F2 and F3 generations of cowpea (Vigna unguiculata (L.) Walp). Electronic Journal of Plant Breeding, 1:1344-1346.
Matos Filho CHA, Gomes RLF, Rocha MM, Freire Filho FR & Lopes AC de A (2009) Potencial produtivo de progênies de feijão-caupi com arquitetura ereta de planta. Ciência Rural, 39:348-354.
Nangju D, Little TM & Anjorinohu A (1975) Effect of plant density and spatial arrangement on seed yield of cowpea (Vigna
unguiculata (L.) Walp). Journal of the American Society for
Horticultural Science, 100:467-470.
Oliveira FJ de, Silva MAV & Gomes MJ (1990) Seleção de caracteres agronômicos do feijão caupi usando coeficientes de caminhamento. Pesquisa Agropecuária Brasileira, 25:1055-1064.
Peksen E & Artik C (2004) Comparison of some Cowpea (Vigna
unguiculata L. Walp) genotypes from Turkey for seed yield
and yield related characters. Journal of Agronomy, 3:137-140.
Rachie KO, Rawal KM & Franckowiak JD (1975) A rapid method for hand crossing cowpea. Ibadan, IITA. 5p. (Techinical Bulletin, 2).
Santos CAF & Gilmara MS (2004) Correlações fenotípicas em dois cruzamentos de feijão caupi nas gerações F2, F3, F4 e F5.
Horticultura Brasileira, 22. CD-ROM.
Santos CAF, Reis MS, Cruz CD, Sediyama CS & Sediyama T (1995) Adequação de Modelos no Estudo do Coeficiente de Trilha dos Componentes Primários e Secundários de Progênies F6 de Soja
(Glycine Max (L.) Merrill). Revista Ceres, 42:111-121.
Silva KJD (2009) Estatística da Produção de feijão caupi. Dispo-nível em: <http://www.portaldoagronegocio.com.br/ conteudo.php?id=34241>. Acessado em: 22 de abril de 2011.
Singh BB, Ehlers JD, Sharma B & Freire Filho FR (2002) Recent progress in cowpea breeding. In: Fatokim CA, Tarawali SA, Singht BB, Kormama PM & Tamo M (Eds.) Challenges and opportunities for enhancing sustainable cowpea production. Ibadan, IITA. p.22-38.
Souza CLC de, Lopes AC de A, Gomes RLF, Rocha M de M & Silva EM (2007) Variability and correlations in cowpea populations for green-grain production. Crop Breeding and Applied Biotechnology, 7:262-269.
Wright S (1921) Correlation and causation. Journal of Agricultural Research, 20:557-585.