UNIVERSIDADE FEDERAL DE UBERLÂNDIA FACULDADE DE ENGENHARIA ELÉTRICA
PROGRAMA DE PÓS-GRADUAÇÃO EM ENGENHARIA BIOMÉDICA
ELLEN PEREIRA ZAMBALDE
SSVEP-BASED BCI WITH VISUAL STIMULI FROM LCD SCREEN
APPLIED FOR WHEELCHAIR CONTROL: OFFLINE AND ONLINE
INVESTIGATIONS
ELLEN PEREIRA ZAMBALDE
SSVEP-BASED BCI WITH VISUAL STIMULI FROM LCD SCREEN
APPLIED FOR WHEELCHAIR CONTROL: OFFLINE AND ONLINE
INVESTIGATIONS
Dissertação submetida ao Programa de Pós-Graduação em Engenharia Biomédica da Universidade Federal de Uberlândia, como parte dos requisitos necessários à obtenção do grau de Mestre em Ciências. Área de Concentração: Engenharia de Reabilitação e Tecnologias Assistivas. Orientador: Prof. Dr. Eduardo Lázaro Martins Naves
Coorientador: Prof. Dr. Marcelo Barros de Almeida
Dados Internacionais de Catalogação na Publicação (CIP) Sistema de Bibliotecas da UFU, MG, Brasil.
Z23s 2018
Zambalde, Ellen Pereira, 1991-
SSVEP-BASED BCI with visual stimuli from lcd screen applied for wheelchair control: offline and online investigations / Ellen Pereira Zambalde. - 2018.
73 f. : il.
Orientador: Eduardo Lázaro Martins Naves. Coorientador: Marcelo Barros de Almeida.
Dissertação (mestrado) - Universidade Federal de Uberlândia, Programa de Pós-Graduação em Engenharia Biomédica.
Disponível em: http://dx.doi.org/10.14393/ufu.di.2018.1166 Inclui bibliografia.
1. Engenharia biomédica - Teses. 2. Cadeiras de rodas - Controle automático - Teses. I. Naves, Eduardo Lázaro Martins, 1970- II. Almeida, Marcelo Barros de. III. Universidade Federal de Uberlândia. Programa de Pós-Graduação em Engenharia Biomédica. IV. Título.
ELLEN PEREIRA ZAMBALDE
SSVEP-BASED BCI WITH VISUAL STIMULI FROM LCD SCREEN
APPLIED FOR WHEELCHAIR CONTROL: OFFLINE AND ONLINE
INVESTIGATIONS
Dissertação submetida ao Programa de Pós-Graduação em Engenharia Biomédica da Universidade Federal de Uberlândia, como parte dos requisitos necessários à obtenção do grau de Mestre em Ciências.
_______________________________________ Prof. Dr. Eduardo Lázaro Martins Naves
Orientador
_______________________________________ Prof. Edgard Afonso Lamounier Júnior, PhD
Coordenador do curso de Pós-graduação em Engenharia Biomédica
ELLEN PEREIRA ZAMBALDE
SSVEP-BASED BCI WITH VISUAL STIMULI FROM LCD SCREEN
APPLIED FOR WHEELCHAIR CONTROL: OFFLINE AND ONLINE
INVESTIGATIONS
Dissertação submetida ao Programa de Pós-Graduação em Engenharia Biomédica da Universidade Federal de Uberlândia, como parte dos requisitos necessários à obtenção do grau de Mestre em Ciências.
Banca Examinadora:
Prof. Dr. Eduardo Lázaro Martins Naves - Orientador (UFU)
Prof. Dr. Marcelo Barros de Almeida - Coorientador (UFU)
Prof. Dr. Adriano Alves Pereira – Interno (UFU)
Prof. Dr. Adriano de Oliveira Andrade – Interno (UFU)
Prof. Dr. Teodiano Freire Bastos Filho – Externo (UFES)
Acknowledgments
I thank God for the gift of life and for always supporting me.
To my parents, Ana and André, who are always by my side and for understanding every choice I make. You are my greatest examples and everything I have become today is grateful to you both. My sister Érika who, even far away, is always supporting and encouraging me.
To all my family, for understanding my absence at many family events. And my long-time friends, who have always sent me messages of encouragement.
To Professor Eduardo, my supervisor, for having welcomed me and always challenged me. I am grateful to you for having made me fell in love with neuroengineering.
To Professor Marcelo, my co-supervisor, who provided me with enriching discussions and
“saved me” when I no longer knew what to do.
To all laboratory colleagues (NTA and NIATS), for the daily living, and for giving me the best moments and learnings. Without the lunches in the RU and relax moments, nothing would make sense. I will miss you all!
To my girlfriends Ludymila, Amanda, Camille and Andressa, for the several hours of the day you shared with me to discuss my research project. Thank you for teaching me so much, I am a better professional and person today thanks to each one of you. Andressa and Camille, thank you for always volunteering for my thousands of experiments. You can always count on me when you need.
To my friend Gabriel, for all the help and dedication during the development of the interface, without you I would not have been able to make everything work.
To Ana Cláudia, for the companionship and friendship, and for these two wonderful years. Thank you for always listening to me and being with me.
“...Tem vez que as coisas pesam mais do que a gente acha que pode aguentar Nessa hora fique firme pois tudo isso logo vai passar Você vai rir, sem perceber Felicidade é só questão de ser Quando chover, deixar molhar Pra receber o sol quando voltar Melhor viver, meu bem pois há um lugar em que o sol brilha pra você Chorar, sorrir também e depois dançar Na chuva quando a chuva vem Dançar na chuva quando a chuva vem...”.
Resumo
As Interfaces Cérebro-Máquina (ICMs) têm se mostrado como tecnologias promissoras
atualmente, especialmente para os usuários de cadeira de rodas afetados por lesões ou
doenças de comprometimento motor. Os sistemas ICM baseados em Potencial Evocado
Visual em Regime Permanente (PEV-RP) são amplamente utilizados para diversas
aplicações, como o controle de um teclado de computador e robôs, devido ao seu baixo
tempo de resposta e facilidade de uso.As ICMs baseadas em PEV-RP utilizam respostas
cerebrais a qualquer estímulo visual piscando à uma frequência específica como comando de
entrada para um dispositivo externo. Embora algumas ICMs baseadas em PEV-RP aplicadas
ao controle de cadeiras de rodas tenham mostrado resultados promissores, existem
características específicas do sistema que devem ser analisadas e discutidas com o objetivo de
aumentar a precisão da classificação. Esta dissertação tem como objetivo desenvolver e
investigar o desempenho de um sistema ICM baseada em PEV-RP utilizando um monitor
LCD como estimulador visual e aplicado ao controle de cadeira de rodas. Dois experimentos
foram realizados (offline e online). Através do experimento offline, realizado por 9
participantes, foi possível identificar os canais significativos do sinal EEG, e o tamanho
adequado da janela para o processamento do sinal, além da localização do alvo no monitor
LCD. No experimento online, 9 canais de EEG (PO3, PO4, PO5, PO6, PO7, PO8, O1, O2 e
Oz) foram usados para registrar o sinal cerebral utilizando uma interface com 5 alvos de
estímulo (15, 12, 6.67, 8.57 e 10 Hz) colocados na parte superior, inferior, direita, esquerda e
centro da tela. Quatro participantes foram posicionados na frente do monitor LCD onde a
interface foi executada. A interface foi desenvolvida em linguagem Python e, após a coleta do
sinal, foi responsável por realizar filtragem, janelamento, extração de características (FFT) e
classificação (SVM). Os resultados mostraram um bom desempenho ao utilizar um
janelamento de 3 segundos com 250 ms de sobreposição. As taxas de precisão de
classificação dos experimentos online foram altas, o que permitiu o controle de uma cadeira
de rodas motorizada. Este sistema foi capaz de fornecer independência e aumentar a
qualidade de vida dos usuários de cadeira de rodas. Trabalhos futuros envolvem adaptações e
melhorias do sistema para aumentar a eficiência e fornecer mais confiabilidade ao usuário.
Abstract
Brain Computer Interfaces (BCIs) have been shown as a promising technology in the current years, especially for those wheelchair users affected by motor injuries or diseases. Steady-State Visual Evoked Potentials (SSVEP)-based BCI systems are widely used for many applications, such as keyboard and robot control, because of its short response time and ease of use. SSVEP-based BCIs use brain responses to any visual stimulus flickering at a specific frequency as input command to an external application or device. Although some SSVEP-based BCI applied to wheelchair control have shown promising results, there are specific features of the system that should be analyzed and discussed aiming to increase classification accuracy. This dissertation aims to develop and investigate the performance a SSVEP-based BCI system using LCD monitor as visual stimulator applied for wheelchair control. Two experiments were performed (offline and online). Through the offline experiment, performed by 9 participants, it was possible to identify EEG optimal channels, adequate window length for signal processing, and target location on the LCD screen. In the online experiment, 9 EEG channels (PO3, PO4, PO5, PO6, PO7, PO8, O1, O2 and Oz) were used to record the brain signal while using an interface with 5 stimuli targets (15, 12, 6.67, 8.57 e 10 Hz) placed on the top, bottom, right, left and center of the screen. Four participants were positioned in front the LCD screen where the interface was executed. The interface was developed in Python language and, after collecting the signal, it was responsible to perform filtering, windowing, feature extraction (FFT), and classification (SVM). The results showed a good performance while using a 3 seconds time-window with 250 ms of overlap. Accuracy rates from online experiments were high, which allowed the control of a powered wheelchair. This system can provide independency and increase quality of life of wheelchair users. Future works involve adaptations and improvements of the system to increase efficiency and provide more reliability to the user.
Table of Contents
Acknowledgments ... 6
Resumo ... 8
Abstract ... 9
List of Figures ... 12
List of Tables ... 14
Abbreviations and Symbols ... 15
1. Introduction and Objectives ... 17
1.1. Overview and Motivation ... 17
1.2. Problem and Objectives ... 19
1.3. Justification and Contributions ... 20
1.4. Outline of the Chapters ... 21
2. Literature Review ... 22
2.1. Assistive Technologies ... 22
2.2. Brain Computer Interface (BCI) ... 26
2.2.1. Brain Signal ... 27
2.2.1.1. Brain Regions... 29
2.2.2. Brain Recording: Electroencephalogram (EEG) ... 30
2.2.3. EEG-based BCI Applications and Paradigms... 32
2.3. Steady-State Visual Evoked Potentials (SSVEP) ... 33
2.3.1. SSVEP Paradigm ... 34
2.3.2. Current State-of-Art of SSVEP-based BCIs using LCD visual stimulator applied for wheelchair control ... 36
3. Material and Methods ... 41
3.1. EEG Acquiring Equipment ... 41
3.1.1. Hardware ... 41
3.1.2. Software ... 42
3.2. Experiment 1: Target Location and Window Length Evaluation ... 43
3.2.1. Visual Stimulator Development ... 43
3.2.2. Participants ... 45
3.2.3. Experimental Procedure ... 46
3.2.4.1. Filtering and Epoching ... 47
3.2.4.2. Feature Extraction and Normalization ... 47
3.2.4.3. Classification... 48
3.3. Experiment 2: Online Application ... 48
3.3.1. Interface Development ... 48
3.3.2. Signal Processing ... 51
3.3.3. Participants ... 51
3.3.4. Experimental Procedure ... 51
4. Results and Discussion ... 53
4.1. Experiment 1: Target Location and Window Length Evaluation ... 53
4.1.1. Participants Opinion... 53
4.1.2. EEG Optimal Channels ... 55
4.1.3. Information Transfer Rate (ITR) ... 56
4.1.4. Classification Results ... 56
4.2. Experiment 2: Online Evaluation... 59
4.2.1. Classification and ITR Results... 59
5. Conclusion ... 62
5.1. Conclusion ... 62
5.2. Future Work ... 63
5.3. Publications ... 63
List of Figures
Figure 1. Percentage of Brazilian population with any type of visual, hearing, motor and mental/intellectual disability. The visual, hearing and motor disability are divided by its level
of impairment (mild, moderate, or severe). ... 18
Figure 2. Example of The Matching Person and Technology conceptual model. Source: Institute for Matching Person and Technology, Inc. ... 24
Figure 3. BCI system stages diagram. ... 26
Figure 4. Neuron cell. Source: Adapted from [32]. ... 27
Figure 5. Action potential. Source: Adapted from [33]. ... 29
Figure 6. Brain regions. Source: Adapted from https://www.macmillan.org.uk/information-and-support/brain-tumours/understanding-cancer/the-brain.html. ... 30
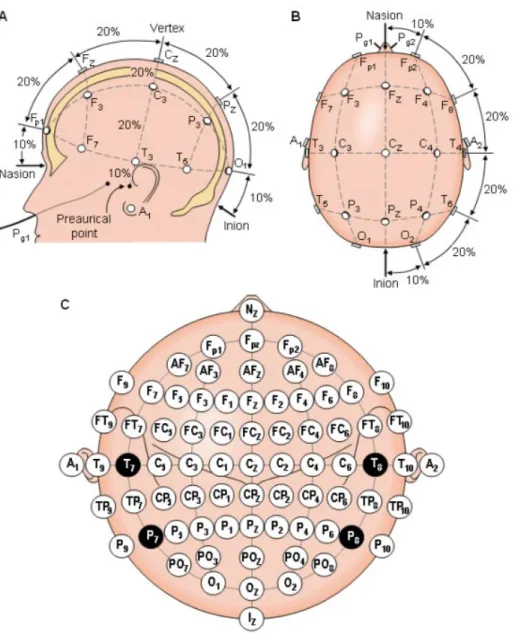
Figure 7. International 10/20 System represented by different perspectives. (A) Sagittal plane, (B) axial plane, and (C) location and nomenclature of 64 electrodes placement which where used in this study. Source: [34].... 31
Figure 8. Eye anatomy. Source: sites.google.com/a/bcssd.com. ... 33
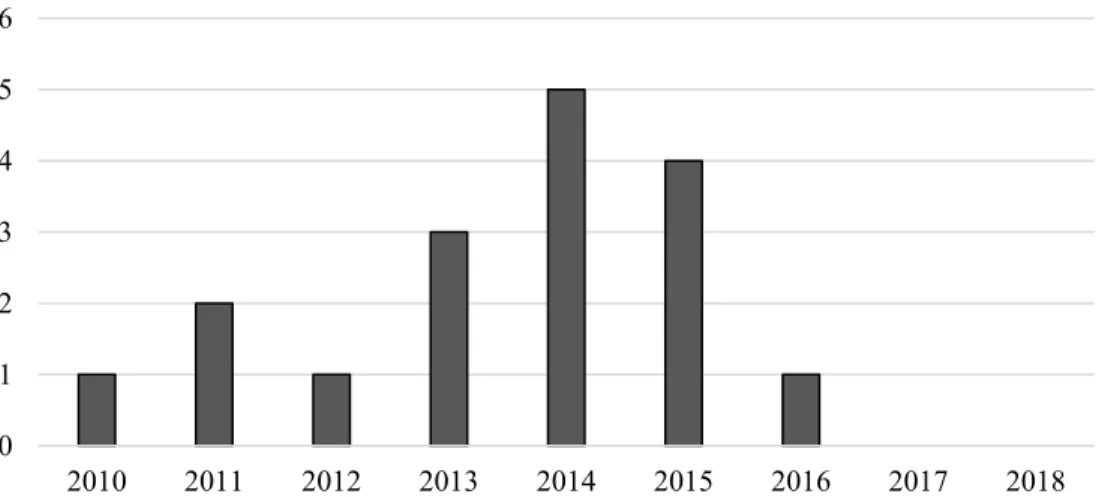
Figure 9. Evolution over the years of studies on SSVEP-based BCIs using LCD as visual stimulator applied for wheelchair control. ... 36
Figure 10. Most used stimulation frequencies in the researched articles related to SSVEP-based BCI using LCD as visual stimulator applied for wheelchair control. ... 37
Figure 11. Box plot of the feature extraction methods and their respective accuracy results. 38 Figure 12. ANT-Neuro EEG amplifier device and the waveguard cap. Source: https://www.ant-neuro.com/products/eego_rt. ... 42
Figure 13. A) Photodiode circuit; B) Oscilloscope results for the frequency of 6.67 Hz. ... 44
Figure 14. Interface “cross” and interface “square” are presented with their respective measurements (in cm) between targets and the target size. ... 45
Figure 15. Participant positioned in front of the LCD screen while performing the experiment... 46
Figure 16. Representation of each trial setup with its respective frequency sequence. ... 47
Figure 17. Online interface design. ... 49
Figure 19. A white border (left) is drawn to alert the user which target he/she has to look at, and a red border (right) represents the EEG signal is been recorded. ... 50 Figure 20. Experimental protocol for the online experiment. ... 52 Figure 21. Participants opinion related to the fastest and slowest flickering frequency for
interface “cross”. ... 54 Figure 22. Participants opinion related to the fastest and slowest flickering frequency for the
List of Tables
Table 1. Information referring to frequency, amplitude and period of different EEG rhythms.
Source: [33]. ... 32 Table 2. Compiled papers with main characteristics referring to the feature extraction method and its respective accuracy rate. ... 39 Table 3. Compiled papers with main characteristics referring to the classification method and its respective accuracy rate. ... 40 Table 4. Stimulating frequencies and their respective flicker time-periods used in the interface... 43 Table 5. Oscilloscope values for each stimulation frequency. ... 44
Table 6. Confusion matrices for both interfaces (“cross” on the right and “square” on the left)
Abbreviations and Symbols
Abbreviations
WHO: World Health Organization
IBGE: Brazilian Institute of Geography and Statistics BCI: Brain Computer Interface
SSVEP: Steady-State Visual Evoked Potential ITR: Information Transfer Rate
LCD: Liquid-Crystal Display AT: Assistive Technologies
ALS: Amyotrophic Lateral Sclerosis MPT: Matching Person and Technology PSD: Power Spectral Density
FFT: Fast Fourier Transform SVM: Support Vector Machines CCA: Canonical Correlation Analysis LDA: Linear Discriminant Analysis ANN: Artificial Neural Network EEG: Electroencephalogram MI: Motor Imagery
SMR: Sensory Motor Rhythm LED: Light-Emitting Diode CRT: Cathode Ray Tube SNR: Signal-to-Noise Ratio
LASSO: Last Absolute Shrinkage and Selection Operator MEC: Minimum Energy Combination
SFT: Spectral F-Test
PCA: Principal Component Analysis CSP: Common Spatial Pattern
EMD: Empirical Mode Decomposition MSI: Multivariate Synchronization Index SDK: Software Development Kit
CAR: Common average reference OAA: One-Against-All
RBF: Radial Basis Function SMB: Seat Mobile do Brasil
Symbols
17
Chapter 1
1. Introduction and Objectives
In this chapter, the contextualization of this document is introduced followed by the objectives, justifications, contributions, and the structure of the dissertation.
1.1. Overview and Motivation
Disability is a human condition that originates from one type on impairment that can be physical, cognitive/intellectual, mental, sensory, or a combination of these [1]. This impairment can be temporarily or permanently, and it may be present from birth or appear
during a person’s lifetime caused by an external injury or pathogens (disease), specially at old age [1, 2].
The disability induces restrictions on person’s body functioning and structures, and it can affect the person’s ability to socialize and interact with the environment and/or other people [1, 3]. A disability can be classified into mild, moderate, or severe [2]. A person with mild disability characterized the one with none or mild difficult to perform a task. The person that has some difficult to perform an action is diagnosed with a moderate disability. In addition, severe disability means the person has a lot of difficult or is unable to perform a task.
There are some environment and technological adaptations and/or new developments that have been done to help improve the quality of life of people with any type of disabilities. For example, sidewalks and transportation with accessible design, assistive technologies, devices aids (wheelchair, hearing aid, etc.), and signage for people with sensory impairments. Specifically, the development of device aids has been growing in recent years, aiming to assist people with disability [2].
According to the World Health Organization (WHO) [2], it is estimated that about 15% of
the world’s population live with some type of disability. Based on 2010 global population estimates, it represents more than a billion people. In Brazil, the Demographic Cense of 2010 performed by the Brazilian Institute of Geography and Statistics (IBGE) [3] expressed that approximate 23.9% (45.6 millions) of the Brazilian population declared experiencing any kind of deficiency. Figure 1 represents data referred to visual, hearing, motor, and
18 The part of the population with severe disability consist of the main target of public policies directed to the population with disabilities [3]. People with severe motor disability are not able to move around by themselves, they represent approximate 0.39% (734 thousand) of the Brazilian population, which are the target users of the developed system in this master dissertation.
Wheelchair is one of the most known and used mobility aid. It promotes empowerment, independency, and overall well-being for those people with difficulty in walking or moving around. According to WHO (2011), there are more than 70 million of people in the world needing a wheelchair; however, only 5 to 15% of them have access to one. Mostly, wheelchair users may be people with motor (physical) or mental disability. A physical or mental impairment restrains the activity of cells (neurons, muscle fibers, etc.) which reduces
the person’s motor skills [1], leading to difficulty in lower and/or upper limb movements. Furthermore, people with restrains in upper and lower limb movements may not be able to walk and operate a manual wheelchair or a joystick on a conventional powered wheelchair [4]. These people should to be dependent from someone for the rest of their lives.
Figure 1. Percentage of Brazilian population with any type of visual, hearing, motor and mental/intellectual
disability. The visual, hearing and motor disability are divided by its level of impairment (mild, moderate, or
severe). 0% 2% 4% 6% 8% 10% 12% 14% 16%
Mild Moderate Severe Mild Moderate Severe Mild Moderate Severe
Visual Hearing Motor Mental /
Intellectual
P
re
va
lenc
e
(%
)
19 However, powered wheelchair control adaptations have been developed aiming to give these people more independence and quality of life. Some alternative control are head joysticks, chin joysticks, speech, and sip-n-puff [5]. An alternative method consists of monitoring specific bio-physiological signals related to user’s body functions, such as brain or muscular activity [4].
Brain Computer Interfaces (BCIs) have been shown a promising technology. In BCIs, brain signals are recorded while reacting to specific stimuli (i.e. auditory or visual) or through a though or intention control (i.e. motor imagery), which are used as input commands to external device control [4]. The main goal of the BCI is to help people with motor impairment to restore the ability to move independently [6].
A BCI paradigm used in many BCI applications is the Steady-State Visual Evoked Potential (SSVEP) [7], which has been widely used for wheelchair control [8]. SSVEP is the brain activity generated in response to a visual flickering stimulus at a particular frequency, and the response signal is at or close to the same frequency of the stimulus [7]. SSVEP-based BCIs offer short response time, high Information Transfer Rate (ITR), ease of use with no or minimal training [6, 8-12]. However, there are still some specifications related to the interface design and signal processing that need to be discussed and improved for better
system responses and increase of users’ confidence while using the system, specially for BCIs applicable to wheelchair control.
1.2. Problem and Objectives
Interface design and signal processing steps of SSVEP-based BCI systems are not yet well-define in the literature. Interface design includes the characteristics of the visual stimuli and stimulator. SSVEP signal processing are related to signal pre-processing, feature extraction, and classification methods [13].
Overall, different authors have used different perspectives and parameters to develop SSVEP-based BCIs; some are complex, and others are straight-forward. In the review executed by Liu et al. (2014), these oscillations are confirmed, since different types of signal processing were exposed, and yet there is no strategy judged as the best one, as it is possible to get efficient results from different types of algorithms, which may be suitable for use in specific applications [13].
20 existing systems were not tested with people with disabilities. The goals of an efficient and practical SSVEP-based BCI systems should be lower preparation time, faster time responses, user-friendly interface, and user’s comfort [13].
In this context, the aim objective of this study is to develop and investigate the offline and online performance of a SSVEP-based BCI applied to wheelchair control using Liquid-Crystal Display (LCD) monitor as visual stimulator.
The secondary objectives are the following:
1) Perform a literature review regarding SSVEP-based BCI using LCD screen to generate visual stimuli, and apply it to wheelchair control;
2) Develop and evaluate an offline interface to test different visual stimuli location emitted from an LCD screen, with different window length for the signal processing; and
3) Develop and evaluate an online interface with different modes for calibration, testing and online use.
1.3. Justification and Contributions
People with disability deserve new technology development and/or adaptations to help them socially interact, have easier access to information and education, facilitate activities of daily living, improve therapy/rehabilitation, and live with more independency.
For powered wheelchair users, SSVEP-based BCI systems can be an alternative to control them, which consists of brain activity interpretation while being stimulated by a visual cue (i.e.: light source or LCD). It is very important to prove the efficiency of this type of BCI system in order to satisfy users needs’ and offer them autonomy.
However, to develop an efficient SSVEP-based BCI system, in order to provide faster responses, accurate classification results, and enhance the user’s experience, all properties related to the interface design and signal processing should be better understood [13]. Essentially, the SSVEP-based BCI should be easy to use and minimize users’ frustrations and/or fatigue. In addition, SSVEP-based BCI systems to control wheelchairs should improve quality of life and provide independency for those which disabilities but cognitively preserved.
21 we develop and evaluate the performance of an offline and online approach. Besides it, this study details the development and test of an accessible and low-cost visual stimulator, which consists of an LCD screen associated with its hardware and software.
1.4. Outline of the Chapters
This master dissertation was organized in 5 Chapters. Chapter 2 reviews existing literature related to basic concepts of (1) assistive technologies (AT); (2) BCI anatomy, physiology, parameters, and applications; (3) SSVEP characteristics and applications. The Materials and Methods section is presented in Chapter 3, where offline and online experiments are
22
Chapter 2
2. Literature Review
The literature review presented in this chapter is related to the development, applicability and use of assistive technologies and brain computer interfaces. Aspects related to the brain anatomy and physiology and signal recording are also discussed. An overview related to the SSVEP paradigm are introduced with details about the anatomy and physiology of the human eye where the stimuli are received, and, finally, the state of art of the SSVEP-based BCI systems using LCD screen as visual stimulator and applied to wheelchair control are presented.
2.1. Assistive Technologies
Physical and mental disabilities, such as spinal cord injuries and amyotrophic lateral sclerosis (ALS), can causes limitations of movements. Most of the people with this type of disability need help from others or from technology aids to communicate, move, learn, hear, and/or see. Technologies that assist people with disabilities allowed them to perform activities of daily living are known as Assistive Technologies (AT) devices [1]. An AT
device can be defined as “any item, piece of equipment, or system, whether it is acquired
commercially, modified, or customized, that is used to increase, maintain, or improve the
functional capabilities of individuals with disabilities” [14]. Examples of AT devices include: crutches, orthoses, wheelchairs, hearing aids, cochlear implants, ocular devices, talking books, speech synthesizers. These devices have been shown as powerful tools to increase independence, improve learning and social interaction, and perform rehabilitation. In some countries, the national health care system includes the AT devices as an integral part of health care [1, 2].
AT devices need to be adjusted and adaptable to the user and the user’s environment. It ranges from highly complex technologies to simple adjustments that can turn life more honorable and change lives; according to Able Data website [15], that consists of an information source related to products, solutions and resources of AT.
23 skills, such as speech and writing aids; (4) computers: products that allow people with disabilities to use the computer and any type of information technology; (5) controls: products that provide people with disabilities control over devices, such as stop, start or adjust an electronic device; (6) deaf and hard of hearing: products developed for people with hearing disabilities; (7) deaf blind: products developed for people with both hearing and visual disabilities; (8) education: products that provide people with disabilities access to education and knowledge, such as materials and school instructions; (9) environmental adaptations: products that provide more accessibility to the environment; (10) housekeeping: products that assist in cooking, cleaning, and other activities as well as adapted appliances; (11) orthotics: products that support or supplement joints or limbs; (12) prosthetics: products developed for amputees; (13) recreation: products that assist people with disabilities while performing their athletic and leisure activities; (14) safety and security: products that protect health and home; (15) seating: products that turn seating more comfortable and safe; (16) therapeutic aids: products that assist health treatment, therapy, and training for certain disabilities; (17) transportation: products that allow people with disabilities to drive or ride in any type of vehicle; (18) walking: products that help people with disabilities to walk and/or stand; (19) wheeled mobility: products and accessories that enable people with mobility disabilities to move freely indoors and outdoors; (20) workplace: products that help people with disabilities at work.
This categorization helps health professionals, family members, caregivers, organizations and the user by himself/herself to learn and understand the AT options and programs available.
However, there are yet high abandonment rates related to AT devices because of the difficulties of interaction between users, their AT device and the environment [16]. According to Phillips and Zhao (1993), four factors that characterized the AT abandonment are highly related to the lack of consideration to the users’ opinion, poor device performance, easy device acquisition, and change in users needs and/or priorities. For that reason, it is important to perform an evaluation regarding the appropriate match of user and AT device
reducing the user’s dissatisfaction and AT abandonment.
24 The MPT Model (Figure 2) targets people with disabilities and consists of three primary rings that represent the levels of influences regarding user’s personal factors, environments characteristics, and features and functions of the AT device itself [18].
Figure 2. Example of The Matching Person and Technology conceptual model. Source: Institute for Matching
Person and Technology, Inc.
The first ring of the MPT model is related to the user’s individual characteristics and resources, and it consists of the five following items: (1) Functional needs question about the
user’s capability to performance and participation in desired area; (2) Adjustment item reports situations related to the benefit that the device or aid can provide to the user and
questions about if this AT is really necessary to achieve the user’s goal; (3) Prior use item
lists the current and past AT devices the user used and question about why the actual devices are not sufficient and what is user’s receptivity and predisposition to the use of the technology; (4) Mood arc represents the user’s dreams, goals and biggest issues, it relates the current mood of the users if his/hers capacity to learn how to use the technology, and it analyses the reaction of the users when faced with life challenges; (5) Lifestyle item question
about the importance and effectiveness of the technology in the user’s life, and the interests
and priorities of the user [18].
25 following items: (1) Cultural arc represents the support and encouragement the family, caregivers and others will express for the use of the technology; (2) Attitudinal item refers to
the difference between the user’s family and caregivers expectations and the own user’s
expectations, and it also analyses the interference the AT can cause to others life; (3) Physical item lists the necessary support and environmental adaptations the user should need to use the technology; (4) Legislative/Political arc represents the legislation related to the technology use and the resources the user can get from the community to legally use the device; (5) Economic item question about the possible funding, and available and affordable assistance the user can considerate in case he/she needs it [18].
The last and third ring report the technology features which must be adaptable to user’s
needs and preferences; it highlights five items which are: (1) Availability item expresses the time that will take for the technology be available to the user and the need for adjustments or setup; (2) Appearance arc questions about the technology physical aspect and the affect of it on social interactions; (3) Comfort arc is related to the security and comfort while using the technology, and it also questions about fatigue, strain, or pain that the technology can cause; (4) Performance item regards the technology functioning, setup, maintenance, durability, portability, and resistance; (5) Cost item refers to the cost of acquiring and maintain the technology as well as its cost-benefit in a long term period [18].
The cycle that covers all rings is represented by four integrating approaches that should be performed in order to evaluate and measure the technology outcomes. The first step is the
Technology Selection that decides for the most empowering choice for the user based on the collected information. After, on the Use step, it is necessary to verify if the technology had been assembled and set up correctly and if there were any changes in user’s needs or the environment. The Evaluation step performs an evaluation of the use of the technology. Lastly, the Accommodations step refers to possible adaptations or customizations that can be performed to the technology to better match user’s needs and goals.
The MPT process can contribute to clarifying the influences the AT use can cause to the user in a positive or negative way. If there are many positive influences, the chance of technology abandonment can be increased. However, if only a few negative items appear, this technology can be successfully accepted and used.
26 technology was adopted in this study to be apply for wheelchair control and will be studied in the next sections.
2.2. Brain Computer Interface (BCI)
BCI is a technology that allows direct interaction between user’s brain activity and specific devices which do not depend on the peripheral muscles and nerves [19]. BCIs translates intention, thought, and responses to external stimuli into input control commands, allowing the user to operate external devices or applications [20, 21].
A BCI is designed based on different stages which involves the user, the brain signal acquisition, the signal processing, and the final device (Figure 3) [22]. At the end of the signal processing stage, a output signal should be generated and it corresponds to a different intention or command of the user for the BCI control [23].
Figure 3. BCI system stages diagram.
The arrangement of the user and the acquisition server represents the first stage of the BCI system setup. More details related to the brain signal acquisition will be reported in the next section. After acquiring the signal, it should be processed, and the signal processing stage includes three main steps: preprocessing, feature extraction and classification.
The first one involves the signal preprocessing which filters the signal from artifacts and electrical noise. At this step the signal can also be divided into windows (epochs) that separate the signal in parts determined by amount of time or samples, improving the effectiveness of the next steps.
The second step refers to feature extraction, which is performed over a pre-define window signal. The chosen features should be able to best distinguish different classes and reduce signal dimensionality which increases the amplitude of the brain response and facilitates detection [24]. To perform an efficient feature extraction, it is crucial to transform the data to the appropriate domain [25]. Usually, features can be divided into two categories: features in
Signal Processing
Brain Signal
User Brain Signal
Acquisition Server
Inpu t Feature Extraction
Preprocessing Classification
Output
27 time domain and features in frequency domain [26]. There are many types of feature extraction methods, such as Power Spectral Density (PSD) [10] and Fast Fourier Transform (FFT) [6], and its choice depends on the BCI application. Still, there is no feature extraction method applied to BCIs systems defined as an outstanding choice in the literature.
The last step of the signal processing is the classification. From this step, an output should be emitted and then control the final device. The classifier translates the input commands provided by the feature extraction step to perform a user’s desired output [26]. There are many classification techniques, such as Support Vector Machines (SVM) [27], Canonical Correlation Analysis (CCA) [28], Linear Discriminant Analysis (LDA) [29], and Artificial Neural Network (ANN) [30]. There are both advantages and disadvantages for all classification methods. For example, SVMs are easier to configure in comparison to the ANNs, and it does not need a big amount of data for training [26].
2.2.1. Brain Signal
The nervous system consists of more than 100 billion neurons cells. It receives information from all the human organs and sensory nerves, processes them, and establishes responses to be executed by the body [31]. The brain functioning is manifested through electric activity. The neurons cells are specialized in reception, integration, and transmission of electrical impulses [32].
The main parts of a neurons cells are the cell body, dendrites and axon (Figure 4). Briefly, the cell body, also named soma, contains the cell nucleus, mitochondria, endoplasmic reticulum, microtubules, and neurofilaments. Dendrites conduct afferent impulses toward the cell body. Axon conducts efferent impulses away from the cell body to another neuron or organ [32].
28 Both dendrites and axon have terminals that work as information receiver and transmitter, respectively. Synapses are the gap between presynaptic (axon) and postsynaptic (dendrites, cell body or another axon) neuron where information is being transfer [32]. This information refers to nervous impulses that propagate by succession of neurons, one after another [31]. Dendrites can receive impulses from one or many axons; this input can be either excitatory or inhibitory. If the impulse is excitatory, the presynaptic neuron secretes a transmitting substance to stimulate the postsynaptic neuron; if inhibitory, the secreted substance provokes an inhibit action. These transmitting substances are called neurotransmitters; some examples of neurotransmitters are acetylcholine, dopamine, serotonin [32].
The neuron cell membrane is composed of proteins and lipids. The resting membrane potential is negatively polarized because there is ion difference, mostly sodium (Na+) and potassium (K+) ions, between the inside and outside of the cell, where the negative ion concentration is higher in the inner surface of the cell opposing to the higher positive ion concentration in the outer surface [33].
The electrical potential of the resting membrane ranges from -60 to -90 mV. However, this potential can be rapidly changed in response to an incoming impulse or stimulus. This change represents variations on the ion permeability across the cell membrane sustained by the selective permeability of the membrane and the active mechanisms of ion exchange, such as the sodium and potassium pump. When there is a stimulation, the membrane potential increases to +20 to +50 mV due to the opening of the sodium channels [32].
29
Figure 5. Action potential. Source: Adapted from [33].
2.2.1.1. Brain Regions
The human brain is divided into three main parts: (1) the cerebrum, (2) the cerebellum, and (3) the brain stem. The cerebrum is the largest part of the brain, and it is responsible for processing of the functions, such as memory and language. It is divided into two hemispheres, left and right, which are separated by a fissure and connected by the corpus callosum [34]. These hemispheres are divided into four lobes as shown in Figure 6: (1) frontal lobe, (2) parietal lobe, (3) occipital lobe, and (4) temporal lobe. The frontal lobe controls the higher brain functions related to motor control and planning. The parietal lobe is responsible for sensory perception, language and body orientation. The visual center is located in the occipital lobe. And, the temporal lobe controls the hearing, memory and feelings.
30
Figure 6. Brain regions. Source: Adapted from
https://www.macmillan.org.uk/information-and-support/brain-tumours/understanding-cancer/the-brain.html.
2.2.2. Brain Recording: Electroencephalogram (EEG)
There are many techniques to record the physiological signal, which can be invasive (intracranial) or non-invasive. A non-invasive technique is the superficial electroencephalogram (EEG).
EEG is a simple method which places electrodes on the surface of the human scalp that detects the spatially averaged electrical activity over a cortical area [19, 23]. It is a widely used approach due to its temporal resolution, portability, ease of use, and relative low cost [13]. Some challenges associated with EEG signal recording are related to the physiological, environmental, and electronic noise sources [35]. Physiological sources arise from motion artifact (for example, eye blinking, head movement) and muscle noise. The environmental interference is related to external noise (for example, people talking, noise devices). Electrical sources include 50-60 Hz power line noise, radio frequencies (RF), and other electrically or magnetically interference. To solve these problems, measuring techniques and efficient design projects should be applied.
EEG electrodes can be dry or wet. The wet electrode needs an electrolytic gel to decrease the skin-electrode impedance in order to record high quality signals [35]. These electrodes are positioned at the scalp following the International 10/20 system, which places electrodes based on measurements that are performed in relation to the size of the head and location of the external cranial landmarks [36].
31 follows the 10% and 20% of the distance between the Nasion and Inion in order to position the electrodes in their correct location; this represents the configuration for 21 electrodes, where 19 are positioned in the scalp and 2 are in the hears lobes. And Figure 7C represent 64 electrodes positioning configuration where electrodes are placed 10% of distance from each other. The electrodes are numbered based on the side of the brain they are located, right hemisphere uses even numbers and left hemisphere are the odd numbers. They are also labeled by their location on the scalp which are F for frontal, C for central, T for temporal, P for parietal, and O for occipital.
Figure 7. International 10/20 System represented by different perspectives. (A) Sagittal plane, (B) axial plane,
32 EEG signals have extremely small amplitudes (in the microvolt range) [35], around 20 to 100 µV and frequency bandwidth ranging from 0.5 to 70 Hz [33]. These frequency bandwidth range can be divided into different band frequencies named rhythms [33].
The most important rhythms are delta, theta, alpha, beta and gamma [33], and their characteristics are expressed in Table 1.
Table 1. Information referring to frequency, amplitude and period of different EEG rhythms. Source: [33].
Rhythm Frequency (Hz) Amplitude (µV) Period (ms)
Delta (δ) 0.5 – 3.5 0 to 100 – 200 2000 – 286
Theta (θ) 4 – 7.5 30 250 – 133
Alpha (α) 8 – 13 30 – 50 125 – 77
Beta (β) 14 – 30 20 -
Gamma (γ) > 30 10 -
Delta rhythm are associated with signal during the deep or slow wave sleep, and it is more predominate in newborns [37]. Theta waves are very difficult to detect, increasing in response to memory demands and during sleep at any age [33, 37]. Alpha activity is the most prominent in the EEG of a mature brain (older than three years). It is mostly located on the posterior-occipital region, and it is more accentuated in vigil with closed eyes and attenuates with eyes opening, attention increasing or mental exertion [33, 37]. Moreover, the amplitude of the alpha band is usually higher in the non-dominant hemisphere [33]. Beta waves are enhanced by states of increased alertness and focused attention and it is detected in the frontal-central regions depending on the performed task [33, 37]. Finally, the gamma band appears during active information processing, these are difficult to detect through superficial EEG [37].
2.2.3. EEG-based BCI Applications and Paradigms
EEG-based BCI systems can be used to various applications such as controlling a mouse cursor [38, 39] or a virtual keyboard [40], playing games [41, 42], control a robot [43, 44], browsing in the internet [45]. In the present study, we will be focusing on EEG-based BCI for wheelchair control.
EEG-based BCI systems can be categorized into two groups depending on the type of brain potential used, which are: endogenous and exogenous [46]. Endogenous signals are
33 perform. By its turn, exogenous signals are evoked by external stimuli presentation [21], such as P300 evoked potentials, Sensory Motor Rhythm (SMR) and SSVEPs [9]. For the present study, the SSVEP paradigm is adopted and it is explained in the next section.
2.3. Steady-State Visual Evoked Potentials (SSVEP)
To understand the EEG signal recording during a visual stimulation, it is important to learn the anatomy and physiology of the eye and how the visual stimuli affects the brain signal.
The eye is an organ whose function is to detect and interpret the electromagnetic waves with wavelengths ranging from 400 (high energy, violet color) to 750 nm (low energy, red color), which consist of the visual light spectrum [47].
Basically, the eye can be divided into two segments: the anterior and the posterior (Figure 8) [48]. The anterior segment consists of cornea, aqueous humor, iris, pupil, ciliary body and crystalline lens. The posterior segment presents the sclera, choroid, retina, fovea, macula, optic nerve (or disc), and vitreous humor.
Figure 8. Eye anatomy. Source: sites.google.com/a/bcssd.com.
The eye globe consists of three layers: the external, medium and intern [47]. The external layer (or fibrous layer) is directly exposed to the external environment. It contains the cornea, which is transparent, with its epithelium (the conjunctive) and the sclera, which is opaque. The aqueous humor is an optically clear ocular fluid that maintains the cornea vitality by supplying glucose and oxygen [48].
34 front of the lens that regulate the amount of light is admitted on the retina. Other important anatomic structure at this point is the ciliary body. It is responsible for secreting and draining the aqueous humor, and it contains muscular fibers that help to adjust the focus on the crystalline lens. The crystalline lens are transparent and biconvex, it is located behind the
pupil and iris with the support of the ciliary body’s fibers. It controls light entry and its refraction. The other part of the medium layer is the choroid which is highly vascularized and contribute to the vascularization of the retina. Other humor that fills the space between the lens and the retina is the vitreous humor which is a gel composed by extracellular fluid containing collagen and hyaluronic acid [47].
Finally, the most intern layer contains the retina. The fovea is the center of the macula, small region on the back of the eye in the retina, and it is an import region of visual acuity [48]. Photoreceptor cells are located in the fovea, and they consist of rods and cones that are capable to capture and convert the light photons into a nerve signal. Essentially, the light enters the eye and reaches the photoreceptors. The rods have high sensibility in detecting the low intensity light, but there do not contribute to the visual image or color vision. On the other hand, the cones are not sensitive to the light, which means they are more effective in day light. The cones are responsible for the visual acuity and color vision. Thus, the retina is responsible for transforming the received image or visual stimuli, by the photoreceptor cells, to electric signals which are transmitted through the nervous cells (axons) presented at the optic nerve to the visual cortex of the brain where it will be interpreted.
2.3.1. SSVEP Paradigm
One of the most used BCI paradigms is the SSVEP [7]. SSVEPs are generated by neuro activities in response of a repetitive or flickering at a particular frequency. Usually, these potentials are more prominent in the visual cortex (occipital lobe) since it is stimulating the vision [21, 49]. The brain signal obtained during the stimulation is synchronized with the stimuli. The amplitude of the recorded signal should increase at the same place or closer to the fundamental and harmonics frequencies of the visual stimulus [24, 27].
SSVEP-based BCIs have been used for many applications due to its short response time, high ITR, and ease of use with minimal or no training [9–11].
35 reliable choice for visual stimulator, which can produce higher potentials as compared to the others [52].
However, to develop LEDs visual stimulators, it is necessary additional hardware and software which can demand time and increase cost of the system [52]. On the other hand, LCDs have been shown as promising visual stimulators due to its low cost and ease access, and it can achieve satisfactory performance for SSVEP-based BCI applications [51, 53]. However, the LCD screen has a restriction related to its limited refresh rate which results in a lack of frequency modulation, which should be considered by the developer while choosing the stimulating frequencies [53–55]. The present study uses LCD screen as visual stimulator.
Other characteristics that should be considerate are related to the interface design and signal processing. The interface design, besides the visual stimulator choice, involves the distance between the user and the stimulus, the distance inter-stimulus, the color of the stimulus as well as its size and shape, and the stimulation frequencies. The viewing distance can influence directly in the properties of the generated signal, such as time-locked and phase-locked to visual stimuli [56]. On the other hand, the distance inter-stimulus is important because a stimulus can influence another stimulus depending on the spacing between them [24]. When the distance increases, the classification accuracy improves [57].
The shape and size of the visual stimulus can induce differences on the signal power at the fundamental and harmonics frequency [58]. It is known that higher contrast between the background color and the stimulus color as well as larger size as possible invokes higher potentials and increase visibility and brightness [9, 24, 59]. The most used background color is black; however, the color of the stimulus varies between studies. Some authors chose the white color as the most efficient one [60, 61], and other reported that the violet color generates the most accentuated brain responses as compared to green, blue and red [62].
Finally, the stimulation frequency is also a significant parameter to the system. SSVEPs can be evoked by frequencies in three different bands: (1) high-frequency (30 to 60 Hz); (2) middle-frequency (12 to 30 Hz); and (3) low- frequency (5 to 12 Hz) [54, 63]. In addition, the band between 10 to 30 Hz evokes stronger potentials and higher Signal-to-Noise Ratio (SNR) [9].
36 Combination (MEC), and FFT. In addition, referring to the classification methods, they found that LDA and SVM have been mainly used.
2.3.2. Current State-of-Art of SSVEP-based BCIs using LCD visual stimulator applied for wheelchair control
Since this present study will be investigating the performance of a system designed with SSVEP-based BCI with visual stimuli generated by LCD screen and applied for wheelchair control, it is important to understand the current state-of-art of this topic.
In parallel to this master dissertation, a literature review was performed with bibliometric and systematic analysis on this specific topic which obtained 17 articles that were analyzed. In this section, the following information will be reported: (1) evolution over the years of this area; (2) visual stimulus location on the screen; (3) stimulating frequencies adopted by the authors; (4) used feature extraction with its respective accuracy result; (5) used classification method with its respective accuracy result.
The investigation through bibliometric review showed the evolution over the years of this area of study, in which most of the articles were published in 2014 (Figure 9). Through the systematic review, it was possible to understand about the visual stimuli location, where most of the found articles revealed 4 targets (top, right, bottom and left of the screen), resulting in an arrangement as intuitive as possible for wheelchair control, which indicates “forward”,
“turn right”, “turn left”, and “stop” or “backward”. However, none of them adopted five stimulation frequencies at the same time as in this master dissertation. When adopting just 4 targets, the backward movement is, normally, not included, but we think it is relevant to have it, since we want to provide the user more independency and freedom to move around.
Figure 9. Evolution over the years of studies on SSVEP-based BCIs using LCD as visual stimulator applied for
wheelchair control. 0 1 2 3 4 5 6
37 The systematic review also showed the most adopted stimulation frequencies for SSVEP-based BCI for wheelchair control (Figure 10). The most used one was 8 Hz followed by 11 and 13 Hz. However, authors normally do not discuss clearly how these frequencies are generated and if they are reliable. In this master dissertation, we provide the validation of the visual stimulation through a photodiode.
Figure 10. Most used stimulation frequencies in the researched articles related to SSVEP-based BCI using LCD
as visual stimulator applied for wheelchair control.
Other important information regarding the development of this specific SSVEP-based BCI system is the feature extraction and classification method. Among the included studies, the feature extraction methods were heterogeneous (Table 2). The Spectra F-Test (SFT), PSD, FFT, and CCA were the highlighted methods used by the studies, where the study that used PSD [10] and other that used CCA [64] obtained the best classification accuracies.
Figure 11 shows the box plot of different feature extraction methods used in the experiments performed by the 17 selected articles. The methods involving PSD + SFT, PCA + PSD, and CSP + CCA represent hybrid systems, which used more than one BCI paradigm at the same system. The plots for these methods are represented for only a line because there were only one accuracy results for each one of them, making it difficult to analyze in this chart. On the other hand, the FFT shows as a promising choice, since its distribution is the smallest one, and it can produce satisfactory classification results. For that reason, this master dissertation adopted this method.
38
Figure 11. Box plot of the feature extraction methods and their respective accuracy results.
On the other hand, regarding the classification methods, the most used one among the studies was a decision tree method created by the own authors followed by SVM, threshold method, CCA coefficient analysis, statistical classifiers, LDA, and ANN, as shown in Table 3. The classification method that obtained the highest average of accuracy was the threshold method associated with statistics, followed by CCA.
Overall, the best classification result obtained among the 17 selected articles in the review was from Fan et al. (2015), that adopted a hybrid system using SSVEP and P300 paradigms. They obtained an accuracy of 99.07% in laboratory tests using PCA for P300 feature extraction, PSD for SSVEP feature extraction, and using LDA classifier.
39
Table 2. Compiled papers with main characteristics referring to the feature extraction method and its respective accuracy rate.
1 Results for 1, 2, 4, 5, 10 seconds windows, respectively, using stimulation by LCD. 2 Results for experiments performed in laboratory driving conditions.
3 Results for experiments performed in real driving conditions. 4 Results for blue, green, red, and violet colors, respectively.
Studies Feature Extraction Approximated Accuracy
[8] peaks of SFT 73%
[65] peaks of SFT -
[66] peaks of SFT 83.33%
[67] peaks of SFT 54%
[43] PSD (Welch) -
[10] PSD of fundamental, second, and third harmonics frequencies
2D: 93%
Virtual environment: 96%
[8] PSD and peaks of SFT 91.17%
[29] PCA (P300) and PSD of fundamental and second harmonic frequencies (SSVEP)
P300: 90.68%2 and 88.99%3
SSVEP: 93.55%2 and 90.48%3
Both: 99.07%2 and 98.93%3
[68] statistical average (P300) and MEC and PSD (SSVEP)
Not clear
[62] FFT coefficients of fundamental and second harmonic frequencies
ANN-FFBP: 77.71%, 79.27%, 79.69%, 83.76%4
ANN-CFBP: 80.94%, 81.46%, 81.58%, 86.26%4
SVM: 86.15%, 86.35%, 85.83%, 89.17%4
[69] FFT -
[6] FFT 50%
[70] FFT coefficients of fundamental and second harmonic frequencies
ANN-FFBP: 80.63% ANN-CFBP: 83.33% SVM: 90.42%
[71] CCA (fundamental and second harmonic frequencies)
checkerboard target: 82% uniform target: 69%
[64] CCA 95.25%
[72] CSP (MI) and CCA (SSVEP) MI: 98.77%
SSVEP: 93.73% Both: 90.63%
[73] PSD, SFT, MEC, EMD, CCA, LASSO e MSI (fundamental, second, and third harmonics frequencies)
PSD: 29%, 32%, 52%, 52%, 61%1
SFT: 26%, 39%, 50%, 52%, 56%1
MEC: 58%, 65%, 75%, 77%, 82%1
EMD: 24%, 28%, 27%, 31%, 33%1
CCA: 50%, 61%, 71%, 73%, 80%1
LASSO: 50%, 61%, 71%, 73%, 80%1
40
Table 3. Compiled papers with main characteristics referring to the classification method and its respective accuracy rate.
1 Results for 1, 2, 4, 5, 10 seconds windows, respectively, using stimulation by LCD 2 Results for experiments performed in laboratory driving conditions.
3 Results for experiments performed in real driving conditions. 4 Results for blue, green, red, and violet colors, respectively.
Studies Classifier Approximated Accuracy
[8] decision tree method 73%
[65] decision tree method -
[66] decision tree method 83.33%
[67] decision tree method 54%
[43] - -
[10] threshold method not specified and statistics 2D: 93%
Virtual environment: 96%
[8] threshold method and decision tree 91.17%
[29] LDA P300: 90.68%2 and 88.99%3
SSVEP: 93.55%2 and 90.48%3
Both: 99.07%2 and 98.93%3
[68] SVM and decision-making strategy Not clear
[62] ANN and SVM ANN-FFBP: 77.71%, 79.27%, 79.69%,
83.76%4
ANN-CFBP: 80.94%, 81.46%, 81.58%, 86.26%4
SVM: 86.15%, 86.35%, 85.83%, 89.17%4
[69] - -
[6] threshold method not specified 50%
[70] ANN and SVM ANN-FFBP: 80.63%
ANN-CFBP: 83.33% SVM: 90.42%
[71] statistics and LDA checkerboard target: 82%
uniform target: 69%
[64] CCA coefficient 95.25%
[72] SVM (MI) and CCA coefficient (SSVEP) MI: 98.77% SSVEP: 93.73% Both: 90.63%
[73] PSD: PSD value
SFT: decision tree method MEC: MEC coefficient EMD: decision tree method CCA: CCA coefficient LASSO: LASSO coefficient MSI: MSI coefficient
PSD: 29%, 32%, 52%, 52%, 61%1
SFT: 26%, 39%, 50%, 52%, 56%1
MEC: 58%, 65%, 75%, 77%, 82%1
EMD: 24%, 28%, 27%, 31%, 33%1
CCA: 50%, 61%, 71%, 73%, 80%1
LASSO: 50%, 61%, 71%, 73%, 80%1
41
Chapter 3
3. Material and Methods
The objective of this section is to describe the materials and methods used in the experiments. These were performed during February to July 2018 at the Assistive Technology Centre (NTA) of the Federal University of Uberlândia (MG-Brazil), which was approved by the local ethics committee and by the National Commission of Ethics in Research of the National Council of Health (CAAE: 37756614.0.0000.5152).
Details related to the EEG acquiring equipment are described in first place. In sequence, the first experiment is presented, which involves offline evaluation related to the visual stimuli emitted from the LCD screen. Two different arrangements (cross and square) were tested in order to identify the most effective one that provokes less interference inter-stimulus on the brain signals. After, a second experiment was performed. The developed interface design in the second experiment was based on the results obtained from the first experiment. The aim of the second experiment was to execute online tests of the developed SSVEP-based BCI system. In other words, in this experiment the EEG signals were collected, and the signal processing was performed, resulting in an output control, was used to control a wheelchair.
3.1. EEG Acquiring Equipment
In this section, the hardware and software associated with the performed experiments will be presented.
3.1.1. Hardware
The amplifier device used to record the EEG signals was the EEGO™ rt, with a
42
Figure 12. ANT-Neuro EEG amplifier device and the waveguard cap. Source:
https://www.ant-neuro.com/products/eego_rt.
3.1.2. Software
Through the Software Development Kit (SDK), it was possible to get direct access to the EEGO amplifier. The ANT-Neuro is compatible to all major open source BCI platforms. Thus, we connected to this device through the OpenViBE platform to acquire the signal. The OpenViBE is an open-source software platform for BCI and real time neurosciences. It is dedicated to acquiring, filtering, processing, classifying and saving or visualizing brain signals in real time.
43
3.2. Experiment 1: Target Location and Window Length Evaluation
This section describes the development and details of the offline experiment structures, which are related to the visual stimulation generation, involved participants, experimental proceedings and signal processing.
3.2.1. Visual Stimulator Development
To guarantee reliable visual stimuli, a visual interface was designed using a video editor and played on a 14-inches LCD monitor with resolution of 1366 by 768 pixels. Since the LCD screen used in this experiment has 60 Hz refresh rate, the stimulating frequencies chosen were 6.67, 8.57, 10, 12 and 15 Hz, which are usually used in the literature [74, 75]. In addition, when choosing the stimulation frequency it is important that a frequency is not harmonic of another chosen frequency [76]. The video was developed setting the information of time-period calculated by the Equation (1),
𝑇 = 1 𝑓
2 ∗ 1000 (𝑚𝑠), (1)
where T represents the period of one flicker in milliseconds, and f is the value in Hz of the flickering frequency. Thus, each frequency has its specific time-period for the correct flickering to the white squares (Table 4).
Table 4. Stimulating frequencies and their respective flicker time-periods used in the interface.
Frequency (Hz) Flicker On (ms) Flicker Off (ms)
6.67 75 75
8.57 58 59
10 50 50
12 41 42
15 33 34
44
Figure 13. A) Photodiode circuit; B) Oscilloscope results for the frequency of 6.67 Hz.
Two different interfaces were developed with different visual stimuli arrangements using the five frequencies. These interfaces are referred to as “cross” and “square”, where the first interface reminds a cross image where the targets are located on the top, right, bottom, left and center of the screen, and the second interface creates a square shape due the location of the corner targets, which are located on the top-left, top-right, bottom-right, bottom-left and center (Figure 14). In all interfaces the stimulus had white color with black background and size of 155 x 155 pixels.
Table 5. Oscilloscope values for each stimulation frequency.
Frequency (Hz)
Oscilloscope Frequency (Hz)
Interface “cross” Interface “square”
6.67 6.67 6.67
8.57 8.33 8.33
10 9.90 10.10
12 11.79 11.74
45
Figure 14. Interface “cross” and interface “square” are presented with their respective measurements (in cm) between targets and the target size.
3.2.2. Participants
Nine participants (2 males and 7 females, 24.11±3.07 years) were asked to participate in this study. All of them signed the informed consent form. To be included in the study, the participants had to:
• not present any type of cognitive or physical deficit;
• have normal or correct-to-normal vision;
• be over 18 years old;
• be able to arrive by themselves at the university’ facility where the experiment took
place;
46
• have their hair washed without conditioner and dried.
3.2.3. Experimental Procedure
The participants were positioned in a comfortable chair at 60 cm away of the LCD monitor
where the visual stimulation was presented. The EEG cap was placed at the participant’s head
and a conductor gel was applied to reduce electrode-skin impedance. Figure 15 shows a participant performing the experiment.
Figure 15. Participant positioned in front of the LCD screen while performing the experiment.
Each experiment was conducted for approximately two hours, from the placement of the electrode cap to the end of the entire protocol for each participant. All participants experienced both interfaces, and a random order for interface use was established between participants, which means some of them started the experiment using the interface “cross” and others the “square”. Thus, the experiment was divided into two similar parts, where in each one of them a type of interface was used.


![Figure 5. Action potential. Source: Adapted from [33].](https://thumb-eu.123doks.com/thumbv2/123dok_br/16821431.751469/30.893.224.672.119.431/figure-action-potential-source-adapted.webp)