M. de Freitas et alii, Frattura ed Integrità Strutturale, 38 (2016) 121-127; DOI: 10.3221/IGF-ESIS.38.16
121
Focussed on Multiaxial Fatigue and Fracture
Comparison between SSF and Critical-Plane models to predict
fatigue lives under multiaxial proportional load histories
Manuel de Freitas, Luis Reis
IDMEC, Instituto Superior Técnico, Av. Rovisco Pais, 1049-001 Lisboa, Portugal [email protected], [email protected]
Marco Antonio Meggiolaro, Jaime Tupiassú Pinho de Castro
Pontifical Catholic University of Rio de Janeiro, PUC-Rio, R. Marquês de São Vicente 225, Rio de Janeiro, 22451-900, Brazil [email protected], [email protected]
ABSTRACT. Materials can be classified as shear or tensile sensitive, depending on the main fatigue microcrack initiation process under multiaxial loadings. The nature of the initiating microcrack can be evaluated from a stress scale factor (SSF), which usually multiplies the hydrostatic or the normal stress term from the adopted multiaxial fatigue damage parameter. Low SSF values are associated with a shear-sensitive material, while a large SSF indicates that a tensile-based multiaxial fatigue damage model should be used instead. For tension-torsion histories, a recent published approach combines the shear and normal stress amplitudes using a SSF polynomial function that depends on the stress amplitude ratio (SAR) between the shear and the normal components. Alternatively, critical-plane models calculate damage on the plane where damage is maximized, adopting a SSF value that is assumed constant for a given material, sometimes varying with the fatigue life (in cycles), but not with the SAR, the stress amplitude level, or the loading path shape. In this work, in-phase proportional tension-torsion tests in 42CrMo4 steel specimens for several values of the SAR are presented. The SSF approach is then compared with critical-plane models, based on their predicted fatigue lives and the observed values for these tension-torsion histories.
KEYWORDS. Multiaxial fatigue life prediction; Critical-plane approach; Polynomial stress scale factor approach.
Citation: de Freitas, M., Reis, L., Meggiolaro, M. A., de Castro, J.T.P., Comparison between SSF and Critical-Plane models to predict fatigue lives under multiaxial proportional load histories, Frattura ed Integrità Strutturale, 38 (2016) 121-127.
Received: 11.05.2016
Accepted: 10.06.2016
Published: 01.10.2016
Copyright: © 2016 This is an open access article under the terms of the CC-BY 4.0, which permits unrestricted use, distribution, and reproduction in any medium, provided the original author and source are credited.
INTRODUCTION
nitiating microcracks under multiaxial fatigue loadings can be sub-divided into shear or tensile types [1]. The dominant fatigue mechanism in so-called shear-sensitive materials is Mode II microcrack nucleation in shear, so the cracks initiate in directions that maximize the ranges of the shear components, with the normal components only
M. de Freitas et alii, Frattura ed Integrità Strutturale, 38 (2016) 121-127; DOI: 10.3221/IGF-ESIS.38.16
122
playing a secondary role. However, other materials may initiate fatigue cracks on planes of maximum tensile strain or stress ranges, e.g. 304 stainless steel under certain load histories and cast irons [2]. In this case, even if the microcrack nucleates in shear, its so-called initiation life (which always includes some microcrack propagation) is controlled by its growth in a direction perpendicular to the maximum principal stress or strain. Moreover, a material can be shear-sensitive for short, but tensile-sensitive for long fatigue lives, a behavior that can depend as well on the loading type.
The shear or tensile nature of the initiating microcrack can be evaluated from a stress scale factor (SSF), which usually multiplies the hydrostatic or the normal stress term from the adopted multiaxial fatigue damage parameter. Low values of the SSF indicate a shear-sensitive material, which should be described by shear-based multiaxial fatigue damage models such as Findley’s [3] or Fatemi-Socie’s [4]. On the other hand, large SSF values indicate that a tensile-based model like Smith-Watson-Topper’s [5] should be used instead to describe the crack initiation process.
The approach proposed by Anes et al. [6] for tension-torsion histories combines the shear and normal stress amplitudes
applied on the specimen cross section, using a SSF polynomial function that depends on the stress amplitude ratio(SAR)
between the shear and normal components. Alternatively, models based on the critical-plane approach calculate multiaxial fatigue damage on the plane where it is maximized (not on the plane where the load is applied), while adopting a SSF value that is assumed constant for a given material, sometimes varying with the fatigue life (in cycles), but not with the SAR, stress amplitude level, or loading path shape.
In this work, in-phase proportional tension-torsion tests are conducted in 42CrMo4 steel specimens for several values of the SAR. The SSF and two critical-plane approaches are then compared, based on their predicted fatigue lives and the experimentally measured ones.
SSFEQUIVALENT SHEAR STRESS APPROACH
he SSF equivalent shear stress approach proposed in [6] considers that both the SAR and the stress loading level significantly influence the material fatigue strength in tension-torsion tests. Such effects are accounted for through a polynomial SSF function, which is assumed to transform an axial damage into a shear one. With this equivalent stress, it is also possible to estimate fatigue lives Nf, using the uniaxial shear stress SN curve represented as
bf
block ssf A N
max (1)
a
a a assf , a b c 2 d 3 f 2 g 3 h 4 i 5 (2)
where a and a are respectively the amplitude of the axial and of the shear components of the tension-torsion loading, and λ tan1(a/ a) is the SAR. The constants a to i from the polynomial (2) should be fitted to a suitable data set, therefore
the SSF function is assumed to be a material fatigue property that must be determined experimentally.
CRITICAL PLANE APPROACH
he critical-plane approach assumes that fatigue lives can be calculated from the damage accumulated at the critical plane of the critical point according to some multiaxial fatigue damage model, which is supposed to properly account for the effect of the driving forces that initiate the fatigue crack in the given material. It also assumes that the damage accumulated on all other planes do not influence the initiation of the microcrack, based on the idea that although many intrusions and extrusions may be formed, usually only one fatigue crack usually initiates and grows from the critical point. The main calculation challenge when applying models based on this approach is to compute the accumulated damage in many candidate planes at the critical point, to find the direction of the critical one where it is maximized (and thus where the crack is expected to initiate). This search is very much simplified for in-phase proportional constant amplitude load histories, such as the ones studied in this work. Two pressure-insensitive stress-based critical damage models are briefly reviewed following, one in principle applicable to materials that are shear-sensitive (for which the main cyclic driving force for fatigue damage is ) and the other to tensile sensitive materials.
Findley's shear model
Findley explicitly introduced the critical plane idea in 1959 [3], proposing a stress-based multiaxial fatigue damage model that can be applied to proportional or non-proportional loads (recall that the principal stress directions remain invariant
T
M. de Freitas et alii, Frattura ed Integrità Strutturale, 38 (2016) 121-127; DOI: 10.3221/IGF-ESIS.38.16
123
under proportional but vary under non-proportional loads). Findley's pioneer model, like all subsequent critical-damage models, assumes that fatigue cracks initiate on the critical plane of the component’s critical point, where a suitable damage parameter is maximized. This is a physically sensible idea, which considers in a very reasonable way how the fatigue cracking process works in directional-damage materials, which tend to develop a single dominant fatigue crack, like most metallic alloys. Critical plane models assume that fatigue damage can be properly evaluated based only on the normal and shear stress and/or strain histories acting on the critical plane, and neglects fatigue damage eventually induced on other planes, assuming they do not interact and so do not affect the microcrack initiation process on the critical plane.
Findley assumed fatigue damage is caused by a parameter [/2 Fmax], which combines the shear stress range /2
acting on the critical plane with the peak of the normal stress perpendicular () to that plane max, during the considered
load event. In this way, fatigue cracking is assumed to take place at the critical point in directions where this (reasonable) damage parameter is maximized.
For a Case A candidate plane, which is perpendicular to the free surface and makes an angle θ with the in-plane x axis,
Findley’s infinite-life criterion (for multiaxial fatigue under any type of loading) is given by the maximization problem
A F max
Fmax ( ) 2 ( )
(3)
where Findley’s coefficient F and shear fatigue limit F must be calibrated from measurements in at least two types of
fatigue tests, e.g. under rotatory bending and cyclic torsion, or else under push-pull pulsating tests with R min/max 0
and fully reversed push-pull tests under R 1.
Findley’s infinite-life model from Eq. 3 can be extended to finite-life calculations using a shear version of Wöhler’s curve, equating Findley’s fatigue limit F with the torsional fatigue limit L, resulting in
b A F F c L N max ( )
max ( ) (2 )
2
(4)
where cand b are the torsional strength coefficient and exponent, respectively, calibrated under pure torsion. For the
studied in-phase tension-torsion histories, Findley’s predicted fatigue life NF (in cycles) becomes after some algebraic
manipulation
b
F F
a a a c F
F L F
N
2 2
2 2
2
4 (2 )
1 1
(5)
Therefore,NF can be obtained as a function of a and a.
Smith-Watson-Topper's tensile model
Findley’s shear model is not appropriate to account for fatigue damage in tensile-sensitive materials, in which Case A tensile instead of shear cracks are likely to initiate. In these materials, the fatigue initiation life N of such cracks must be
correlated with a damage parameter based on a normal stress or strain range (not on a shear range ), combined
with the peak stress max parallel to to account for mean/maximum stress effects.
The multiaxial version of Smith-Watson-Topper’s (SWT) model [5] is particularly useful for calculating fatigue damage on such materials, especially if the propagation phase of the microcracks (still within the so-called crack initiation stage), which is more sensitive to the normal stresses, is dominant over its shear-controlled initiation. The multiaxial version of SWT’s equation for Case A tensile cracks can be written as
b b c
c c c N N E 2 2 max ( )
max ( ) (2 ) (2 )
2
(6)
where c,εc,b,andc are Coffin-Manson’s material-dependent parameters.
M. de Freitas et alii, Frattura ed Integrità Strutturale, 38 (2016) 121-127; DOI: 10.3221/IGF-ESIS.38.16
124
b c
ESWT 2 N 2
max
( )
max ( ) (2 )
2
(7)
This equation can be simplified in the studied proportional history (which has zero mean stresses), because in this fully-alternate case the peak normal stress max() perpendicular to a Case A plane along θ is equal to the normal amplitude
()/2. Therefore, the ESWT equation becomes Wöhler’s curve using Basquin’s formulation:
b b
c N c N
2
2 2
max
( ) ( ) ( )
max ( ) max (2 ) max (2 )
2 2 2
(8)
Thus, the damage parameter to be maximized in the ESWT model simply becomes ( ) / 2 | acos2 asin 2 | for a fully-alternate cyclic loading. Deriving this expression and equating it to zero, the critical-plane angle θESWT with
respect to the x-axis, represented in the first quadrant 0º ≤ θ ≤ 90º, is obtained from
a
a a ESWT p
a 2
2 cos sin 2 cos 2 0 tan 2 tan 2 2 tan
(9)
where λ is the SAR from the SSF model [6], and θp is the principal direction from the first quadrant. Not surprisingly, θESWT is one of the fixed principal directions θp of such proportional tension-torsion loadings. On this principal plane, the
damage parameter is maximized, resulting in the principal stress equation for the normal and shear amplitudes aand a:
a a a
ESWT ESWT
a a ESWT
2 4 2
( ) 1 cos 2
sin 2
2 2 2
(10)
From the definition λ tan1(
a/ a), it follows that a atan(λ); thus this maximized damage parameter on the θESWT plane
can be expressed as a function of a and λ:
a a a
ESWT
a
2 2 2
2
4 tan
( )
0.5 0.25 tan
2 2
(11)
Assuming ESWT’s model is able to predict crack initiation, the above expression would explain why the SSF can be
represented as a function of a and λ, however requiring a fifth-order polynomial function to approximately reproduce
such a non-linear expression. Finally, from the ESWT equation it follows that the predicted fatigue life NESWT (in cycles) is
b
b b
a a a
ESWT a
ESWT
c c c
N
1/
1/ 2 2 1/
2
4
( )
0.5 0.5 0.5 0.5 0.25 tan
2 2
(12)
RESULTS AND DISCUSSIONS
Material and loading paths
he reasoning derived in the previous sections is applied to the experimental results published by Anes et al. [6] for proportional tension-torsion multiaxial fatigue tests carried out in low-alloy steel 42CrMo4, heat-treated by austenitizing, quenching, and tempering to improve its mechanical properties. The chemical composition and the monotonic and cyclic properties of 42CrMo4 are available in [6, 7].
Fatigue tests are carried out through a servo-hydraulic tension-torsion machine under stress control at room temperature, applying proportional loading paths. In order to perform the SSF mapping, five different proportional loading paths are
M. de Freitas et alii, Frattura ed Integrità Strutturale, 38 (2016) 121-127; DOI: 10.3221/IGF-ESIS.38.16
125
selected with different SAR λ. Although the SAR is an important fatigue variable, the stress level also has a high influence on the fatigue damage mechanisms. These two variables will be used in the SSF mapping.
Fatigue life predictions
The tested 42CrMo4 steel has Young’s modulus, Manson’s fatigue strength coefficient and exponent, and Coffin-Manson’s fatigue ductility coefficient and exponent presented in Freitas et al [6]. However, the ESWT model adopts an elastic version of Coffin-Manson’s equation, which neglects its plastic term. Therefore, the resulting purely-elastic calibration requires a better fit of the experimental data to also account for longer fatigue lives. From the normal and shear fittings, it is possible to write:
b
a c (2N) 1654 (2N) 0.0934
and a c (2N)b 911 (2 N)0.0623 (13)
Then, from Findley’s calibration for Case A fatigue cracks, its constants can be determined using Eq. (3): F 0.668 and F
420.9MPa.
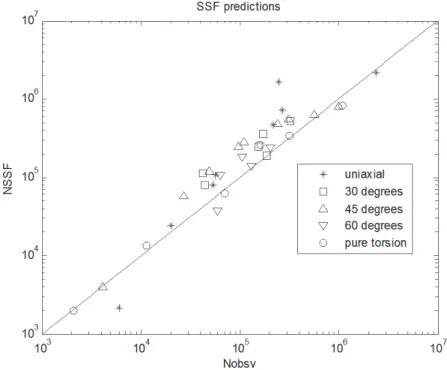
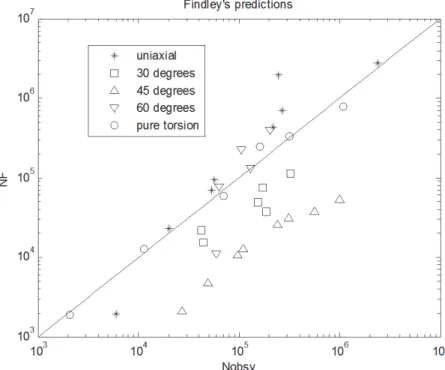
Figs. 1-3 present a comparison between the observed fatigue lives Nobsv and the NSSF, NESWT and NF predicted by the SSF,
ESWT and Findley’s models, respectively, for SAR λ = 0º (uniaxial), 30º, 45º, 60º and 90º (pure torsion). As observed in Fig. 1, the SSF polynomial fitting performs satisfactorily, allowing a reasonable match between Nobsv and NSSF for all cases.
However, since all load histories are proportional, this performance should not be generalized for other cases.
Figure 1: Comparison between the observedfatigue lives Nobsvand the fitted NSSF.
As shown in Fig. 2, the ESWT’s critical-plane method results as well in reasonable, albeit a bit more disperse, fatigue life predictions, except for the pure torsion (λ 90º) case. This exception is not a surprise, since the pure torsion history involves significant shear damage, whereas the ESWT’s model only accounts for tensile damage.
Findley’s critical-plane method also results in reasonable fatigue life predictions, except for the λ 30º and λ 45º cases, as shown in Fig. 3. These exceptions suggest that such multiaxial load histories probably involve significant tensile damage,
whereas Findley’s model only accounts for shear damage. Indeed, the maximum normal stress max influences Findley’s
shear damage parameter, however no measure of the normal range perpendicular to the critical plane is considered.
M. de Freitas et alii, Frattura ed Integrità Strutturale, 38 (2016) 121-127; DOI: 10.3221/IGF-ESIS.38.16
126
Fig. 4 shows critical-plane predictions based on ESWT’s tensile model applied to the predominantly tensile cases λ 0º
(uniaxial), 30º, and 45º; and on Findley’s shear model to the shear-dominated cases λ 60º and 90º (pure torsion). Notice that the prediction scatter is similar to the one from the SSF method.
However, it must be noted that such critical-plane method calculations have a greater prediction potential, because they are only based on curve fittings of the uniaxial and pure-torsion experiments, while the polynomial fitting from the SSF method requires data calibration from all five tension-torsion tests.
Figure 2: Comparison between the observed fatigue lives Nobsv and the predicted NESWT.
M. de Freitas et alii, Frattura ed Integrità Strutturale, 38 (2016) 121-127; DOI: 10.3221/IGF-ESIS.38.16
127 Figure 4: Comparison between the observed lives Nobsv and the lives NESWTor NF predicted by critical-plane methods, according to the
dominance of normal or shear applied loads.
CONCLUSIONS
n this work, it was shown that both critical-plane and SSF approaches have the potential to predict multiaxial fatigue lives, at least for in-phase proportional loadings. Findley’s model neglects tensile damage, while the ESWT model neglects shear damage, which explains why their performance was not very good for all considered load histories. In its current form, the SSF method does not include mean/maximum stress effects, therefore experiments with zero mean loads were chosen to evaluate its performance. The SSF method resulted in a better fit of the experimental data, however it requires more calibration tests (to fit its 5th-degree polynomial) than the critical plane approach.
REFERENCES
[1] Castro, J.T.P., Meggiolaro, M.A., Fatigue Design Techniques (in 3 volumes), CreateSpace, Scotts Valley, CA, USA
(2016).
[2] Socie, D., Marquis G., Multiaxial Fatigue, SAE International, Warrendale, PA, USA (2000).
[3] Findley, W.N., A theory for the effect of mean stress on fatigue of metals under combined torsion and axial load or
bending, J. Eng. Industry, 81 (1959) 301-306.
[4] Fatemi, A., Socie, D., A critical plane approach to multiaxial damage including out-of-phase loading, Fatigue Fract.
Eng. Mater. Struct., 11 (1988) 149-166.
[5] Smith, R.N. Watson, P., Topper, T.H., A stress-strain parameter for the fatigue of metals, J. Mater., 5 (1970) 767-778. [6] Anes,V., Reis, L. Li, B., Fonte, M., de Freitas, M., New approach for analysis of complex multiaxial loading paths, Int.
J. Fatigue, 62 (2014) 21-33.
[7] de Freitas, M., Reis, L., Li, B., Comparative study on biaxial low-cycle fatigue behaviour of three structural steels, Fatigue Fract. Eng. Mater. Struct.,29 (2006) 992-999.