ASSOCIAÇÃO DE POLITÉCNICOS DO NORTE
(APNOR)
INSTITUTO POLITÉCNICO DE BRAGANÇA
The development ways of renewable energy: the economic and
financial performance of firms in this sector in Armenia and OECD
countries.
Siranush Tarakhchyan
Final Dissertation submitted to
Instituto
Politécnico de Bragança
To obtain the Master Degree in Management, Specialisation in Business
Management
Supervisors:
Ana Paula Monte
Â
ngela Ferreira
Sargis Manukyan
ASSOCIAÇÃO DE POLITÉCNICOS DO NORTE
(APNOR)
INSTITUTO POLITÉCNICO DE BRAGANÇA
The development ways of renewable energy: the economic and
financial performance of firms in this sector in Armenia and OECD
countries.
Siranush Tarakhchyan
Supervisors:
Ana Paula Monte
Â
ngela Ferreira
Sargis Manukyan
i
Abstract
In this research is intended to analyse the expansion of the economic sector related to the development ways of renewable energy and the economic and financial performance of companies operating in this field.
The electricity requirements are increasing at alarming rate and the power demand has been running ahead of supply. The renewable energy industry remains one of the most vibrant, fast-changing, and transformative sectors of the global economy. Technology improvements, cost declines, and the catalytic influence of new financing structures, have turned the sector into a driver of economic growth around the world (IEA, 2012; New energy market, 2015). The recent severe energy crisis has forced the world to develop new and alternative methods of power generation. The non-conventional methods of power generation are solar energy, fuel cells, wind power generation, geo-thermal energy generation, etc. (Riva & Foppapedretti, 2014; Twidelland & Weir, 2006).
The goals of the research project are i) to analyse the available ways of alternative (renewable) energies, their markets and evolution; ii) to analyse the profitability (financial performance) based the analysis of stock returns and on financial ratios of renewable energy companies. The main research question is that renewal energy companies are profitable and do not have negative effect in environment when compared with non-renewable energy companies (Dickson, 2016; Beiter, 2014). To test it and answer to the goals of the research, it will be collected secondary data, namely financial and non-financial data of renewal energy industry's market and companies’ stock prices for companies in Armenia, EU countries and other OECD countries. The time horizon for the data simple is from year 2000 until now.
ii
Resumo
Esta investigação pretende analisar a expansão do setor económico relacionado com o desenvolvimento das energias renováveis e os desempenhos económico e financeiro das empresas que operam nesse setor.
Os requerimentos de energia elétrica estão a aumentar a uma taxa alarmante e a procura de energia tem crescido mais que os meios de produção. A indústria da energia associada a fontes renováveis apresenta-se como uma das mais vibrantes e com mudanças consideráveis no setor de transformação da economia global. As evoluções tecnológicas, a redução dos custos e a influência catalítica de novas estruturas de financiamento, tem posicionado o setor numa posição dominante no crescimento económico a nível global (IEA,2012; New energy market, 2015). As recentes crises no setor dos combustíveis fósseis têm forçado os diversos países a desenvolverem alternativas e novos métodos de produção de energia elétrica. Estes métodos não convencionais são baseados em energia solar, células de combustível, energia eólica, energia geotérmica, etc. (Riva & Foppapedretti, 2014; Twidelland & Weir, 2006).
Os objetivos deste projeto de investigação são i) analisar os meios disponíveis para a produção de energia a partir de fontes renováveis, os seus mercados e respetiva evolução; ii) analisar a rentabilidade (desempenho financeiro) baseada nos preços de mercado e em rácios financeiros de empresas que operam no mercado das renováveis. A principal hipótese de investigação é que as empresas que operam no setor das energias renováveis são lucrativas e contribuem mais para a redução da pegada ecológica quando comparadas com aquelas que operam no setor das energias ditas convencionais [Dickson, 2016; Beiter, 2014].
Para testar esta hipótese e responder aos objetivos desta investigação, será recolhida informação secundária, nomeadamente informação financeira e não financeira e cotações de empresas que operam no setor das energias renováveis na Arménia, países da União Europeia e outros países da OCDE. A amostra temporal dos dados em análise reporta ao ano 2000, até à presente data.
iii
Համառոտագիր
Այս ավարտական հետազոտական աշխատանքում նախատեսված է վերլուծել վերականգնվող էներգիայի զարգացման ուղղիները, նրանց տնտեսական սեկտորի ընդլայնումը։ Նույնպես ներկայացվելու են վերականգնվող էներգիա արտադրող կազմակերպությունների տնտեսագիտական և ֆինանսական ցուցանիշներըֈ
Էլեկտրաթներգիայի պահանջարկն ահռելի արագությամբ աճում է։ Վերականգնվող էներգիայի արդյունաբերությունը ներկայումս հանդիսանում է շատ դինամիկ, արագ փոփոխվող և ձևափոխվող ճյուղերից մեկը միջազգային տնտեսական սեկտրումֈ Տեխնոլոգիաների բալերավում, գների իջեցումը, նոր ֆինանսական կառուցվածքների կատալիկ ազդեցությունը այս արդյունաբերության ճյուղը դարձել են ամբողջ աշխարհում տնտեսական աճի պատճառներ (IEA,
2012; New energy market, 2015)։ Վերջերս տեղի ունեցած էներգետիկ ճգնաժամը պատճառ հանդիսացավ նոր այլընտրանքային էներգիաներ բացահայտելու համարֈ Վերականգնվող էներգիա արյի տեսակներից են՝ արևային էներգիան, թերմո-էլեկտրական գեներատորները, գեոթերմալ էներգիան, հողմային էներգիայի գեներատորները և այլն (Riva & Foppapedretti, 2014; Twidelland &
Weir, 2006)։
Հետազոտական աշխատանքի հիմնական նպատակներն են i) վերլուծել վերականգնվող էներգիայի հասանելի ճյուղերի շուկաները և դրանց էվոլուցիան, ii) վերլուծել վերականգնվող էներգիա արտադրող կազմակերպությունների շահութաբերությունը (ֆինանսական հաշվետվությունների) հիմնվելովֆինանսականհարաբերակցություններիևֆոնդայինշրջապտույտիվրա։
Ատենախոսության նպատակն այն է, որ վերականգնվող էներգիա արտադրող կազմակեր-պությունների շահութաբերությունն ավելին է և նրանց ազդեցությունը շրջակա միջավայրի վրա ավելի քիչ են քան չվերականգնվող էներգիա արտադրողներինը (Dickson, 2016; Beiter, 2014)։ Որպեսզի կարողանանք պատասխանել հետազոտական աշխատանքի դիմաց դրված հիպոթեզերին պետք է հավաքագրել երկրորդական տվյալներ, հիմնականում ֆինանսական և ոչ ֆինանսական տվյալներ վերականգնվող էներգիայի ոլորտից, շուկաների և կազմակերպությունների ֆոնդային արժեքները Հայաստանի, Եվրոպական Միության և այլ ՏՀԶԿ երկրների համարֈ Տվյալների հավաքագրման ժամանակահատվածը 2000 թվականից մինչև 2016 թվականն էֈ
v
Acknowledgements
During the accomplishment of the master's thesis, I got a great support from my supervisors Ana Paula Monte, Angela Ferreira and Sargis Manukyan.
0
Acronyms
CSP - Concentrated Solar Power
EBIT - Earnings Before Interest and Taxes EU - European Union
GHG - Greenhouse Gas GW - Gigawatt
IAENA - International Atomic Energy Agency INDC - Intended National Determined Contribution IRENA - The International Renewable Energy Agency KWh - Kilowatt
MW - Megawatt
NOPAT - Net Income and Net Operating Profit After Tax
OECD - The Organization for Economic Co-operation and Development PPA - Power Purchase Agreement
PV - Photovoltaic
R2E2 - Renewable Resources and Energy Efficiency RA - Republic of Armenia
RE - Renewable Energy
RES - Renewable Energy Source RESh - Renewable Energy Shares RH - Research Questions
ROA - Return on Assets ROE - Return on Equity
SHPP - Small Hydropower Plant
viii
Table of Contents
List of Figures ... ix
List of Tables ... x
Introduction ... 1
PART I: The development trend of renewable energy in the World and in Republic of Armenia ... 3
1.1 Main types of renewable energy and assesment of current state of art in the World ... 3
1.1.1 Solar energy ... 7
1.1.2 Wind Energy ... 9
1.1.3 Geothermal Energy ... 10
1.1.4 Hydropower ... 12
1.2 Assessment of the actual state of art of renewable energy in Republic of Armenia ... 14
1.2.1 Solar energy in Armenia ... 16
1.2.2 Wind Energy Program in Armenia ... 16
1.2.3 Hydropower in Armenia ... 17
1.3 The impact of renewable energy on the environment ... 19
1.4 Solutions for developing renewable energy sector in Republic of Armenia ... 21
PART II: Economic and Financial Performance of Companies of Renewable Energy Sector ... 23
2.1 Literature review on financial performance of renewable energy industries ... 23
2.2 Research design ... 24
2.2.1 Objectives, research questions and sample ... 25
2.2.2 Data, Variables and analysis methods ... 26
2.3 Data Analysis Results ... 31
2.3.1 Short profile of the companies in the sample ... 31
2.3.1.1. About the EDF group ... 31
2.3.1.2. About the EDP – Energias de Portugal, S.A. ... 32
2.3.1.3. About Iberdrola Company ... 33
2.3.1.4. About Enel Group SpA ... 33
2.3.1.5. About E.ON SE ... 34
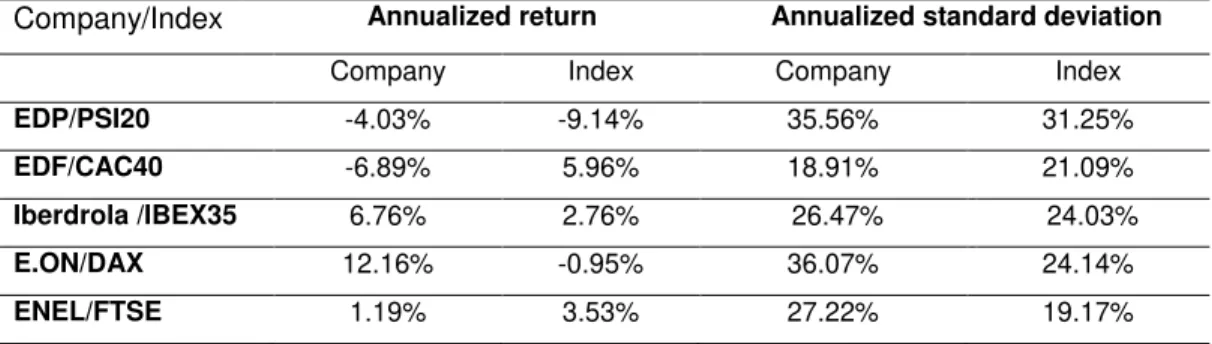
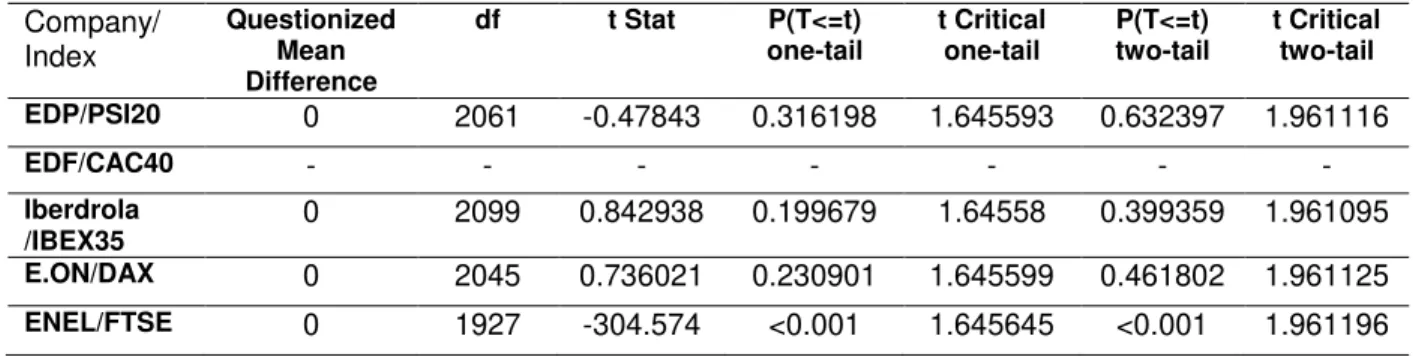
2.3.2 Analysis of companies’ stock prices return ... 34
2.3.3 Analysis of profitability based on Financial Ratio ... 37
Conclusions, Limitations and Future Research Lines ... 46
References ... 47
ix
List of Figures
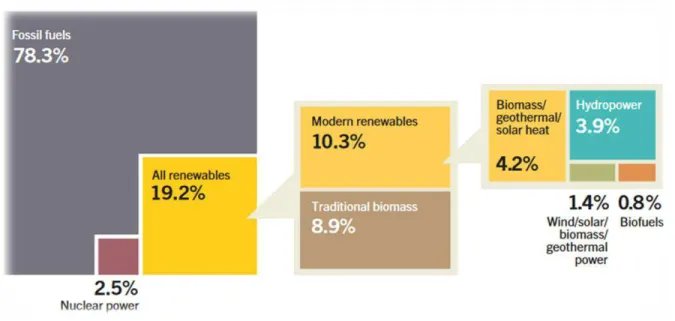
Figure 1: Estimated Renewable Energy Share of Global Final Energy Consumption, 2014. ... 5
Figure 2: Solar PV Global Capacity, by Country/Region, 2005–2015. ... 7
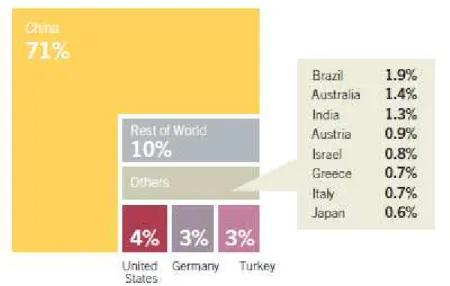
Figure 3: Solar Water Heating Collectors Global Capacity, Shares of Top 12 Countries and Rest of World, 2014. ... 8
Figure 4: Wind Power Global Capacity and Annual Additions, 2005–2015. ... 10
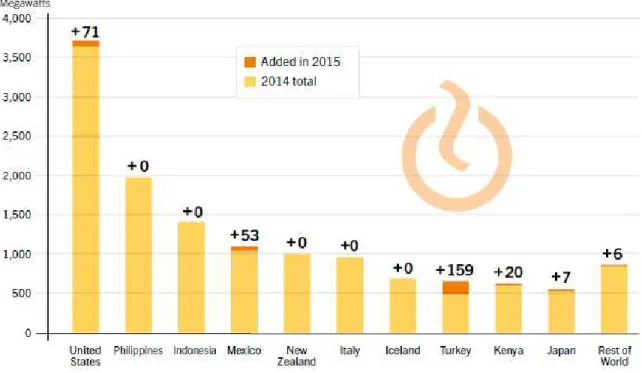
Figure 5: Geothermal Power Capacity and Additions, Top 10 Countries and Rest of World, 2015. ... 12
Figure 6: Hydropower Capacity and Additions, Top Nine Countries for Capacity Added, 2015. ... 13
Figure 7: Renewable energy total in Armenia, Thousand toe, 2000 – 2015. ... 15
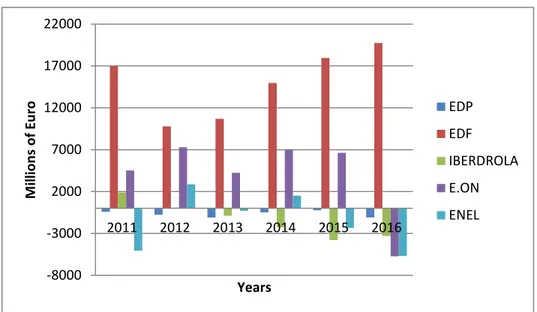
Figure 8: Working Capital for EDP, EDF, Iberdrola, E.ON and ENEL companies in millions of euros (2011-2016). ... 38
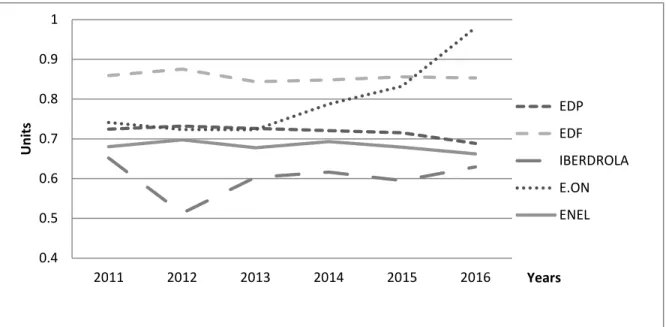
Figure 9: Current Ratio for EDP, EDF, Iberdrola, E.ON and ENEL companies (2011-2016). ... 38
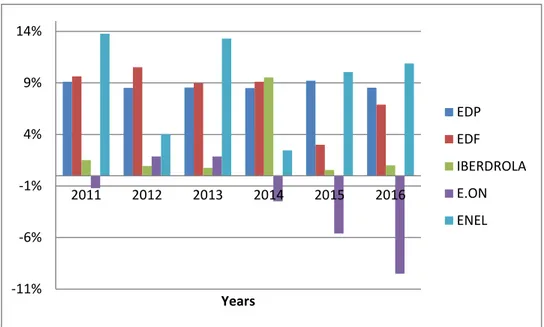
Figure 10: Return on Equity for EDP, EDF, Iberdrola, E.ON and ENEL companies (2011-2016). ... 39
Figure 11: Debt Ratio for EDP, EDF, Iberdrola, E.ON and ENEL companies (2011-2016). ... 40
Figure 12: Cash turnover for EDP, EDF, Iberdrola, E.ON and ENEL companies (2011-2016). ... 41
Figure 13: Assets Turnover Ratio for EDP, EDF, Iberdrola, E.ON and ENEL companies (2011-2016).41 Figure 14: Current to Non-Current Liabilities for EDP, EDF, Iberdrola, E.ON and ENEL companies (2011-2016). ... 42
Figure 15: Equity Ratio for EDP, EDF, Iberdrola, E.ON and ENEL companies (2011-2016). ... 43
Figure 16: Rate of return on net sales, as %, for EDP, EDF, Iberdrola, E.ON and ENEL companies (2011-2016). ... 44
x
List of Tables
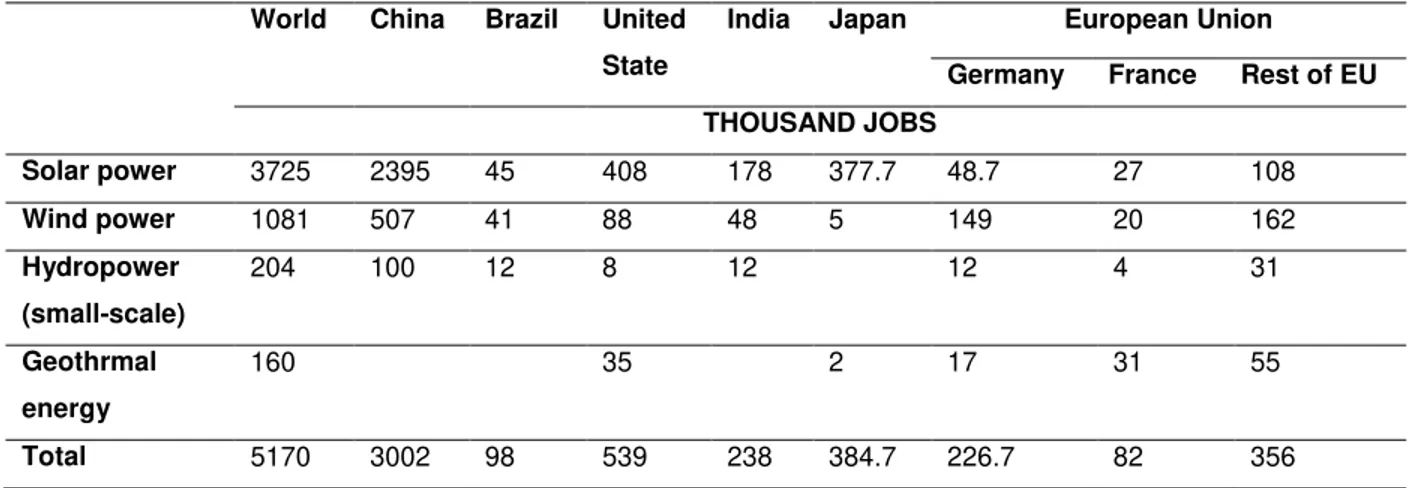
Table 1: Estimated Direct and Indirect Jobs in Renewable Energy Worldwide, by Industry (2015) ... 6
Table 2: Feed-in-tariffs for renewable energy system from SHPPs, 2016 (excluding VAT) ... 18
Table 3: Common used ratios to measure firms’ performance. ... 28
Table 4: Common used ratios to measure firms’ efficiency, leverage and liquidity. ... 29
Table 5: Daily standard deviation for every company and all period. ... 35
Table 6: Annualized return and standard deviation for all companies during all period. ... 35
Table 7: Systematic risk for all companies in all period. ... 36
1
Introduction
We use energy every day of our live, and energy is the important part of our life. Nowadays, we need more and more energy, but the energy from fossil fuels are not forever, it is going to finish someday. Moreover, the fossil fuels energies are becoming too expensive or too environmentally damaging to retrieve. Renewable energy requirements are increasing a lot because of some of these reasons. The other advantage using renewable resources is that they are distributed over a wide geographical area, ensuring that developing regions have access to electricity generation at a stable cost for the long-term future.
This dissertation is constituted by two parts. The first part describes more about renewable energy. The renewable energy’s power sector evolution over the last 15 years in OECD countries and in Armenia. The main renewable energies what is present in first part is solar energy, wind energy, hydropower and geothermal power. The renewable energy has not fewer impacts in the environment that non-renewable energy, but this not mean that renewable energy’s impacts are equal zero. In this part of dissertation is also presented the renewable energy in Republic of Armenia, how it has been developed since year 2000 and which kind of renewable energy have more development.
The second part of the thesis has two main objectives: the first (i) analyse the market indicators such as average stock prices and second (ii) analyse financial ratios on these companies. To achieve these objectives the first step consist on to find companies that are from different OCED countries (Portugal, France, Germany, Spain and Italy). These companies are producing renewable and non-renewable energies and have publicly data, namely financial statements and reports. Nevertheless, unfortunately not all companies on their official websites have published financial statements for renewable energy more than 3 years. That is why the sample in the dissertation considers companies are producing both kinds of energy: from fossil fuel and renewable energy. All five companies are listed in stock exchange and have publicly data. From these data it will be computed the daily return on companies’ market price and then annualised it in order to check if the companies’ annualized average return positive for the period under analysis. Also related to market prices it will be computed and compared companies’ market risk of their stocks. It is intended to test if the renewable (an non-renewable) energy companies have more market risk than the underlying stock index (the benchmark for market). In this regard, to answer to the objective of the study and the research questions it will apply a t-test, descriptive and regression analysis.
2
3
PART I: The development trend of renewable energy in the World
and in Republic of Armenia
1.1. Main types of renewable energy and assessment of current state of art in
the World
The world engenery demand currently relies on fossil fuel (coal, oil and natural gas) and this kind of energy; together with nuclear energy are the main sources to produce electricity. Fossil fuels are non-renewable because they are used at a higher rate than they are naturally regenerated, which translates in finite resources. These resources will not be forever. Fossil fuels are becoming too expensive or environmentally damaging, mainly due to increased concerns about climate change. Additionallym fossil fuel energy prices are unstable due to continues social and political instability in many source countries in the oil trade chain. That is why renewable energies will have to replace traditional energy sources (Alrikabi; 2014).
4
Hydrogen can also be found in many organic mixtures. It is the most important element on the Earth. But it doesn't appear naturally. It's always joint with other elements, such as oxygen i the water. Once separated from others elements, hydrogen can be burned as a fuel or converted into electricity.
Nowadays renewable energies are recognized around the world such as main-stream sources of energy. Quick growth, special in the power sector, is driven by several factors, including the improving renewable technologies's cost-competiveness, loyal policy initiatives, better access to financing, energy security and environmental concerns, growing demand for energy in developing and emerging economies, and the need for access to modern energy sector. Therefore, new markets for both centralized and distributed renewable energy are appearing in all regions. The year’s events culminated in December at the United Nations Framework Convention on Climate Change’s (UNFCCC) 21st Conference of the Parties (COP21) in Paris, where 195 countries agreed to limit global warming to well below 2 degrees Celsius. A majority of countries committed to scaling up renewable energy and energy efficiency through their Intended Nationally Determined Contributions (INDCs). Out of the 189 countries that submitted INDCs, 147 countries mentioned renewable energy, and 167 countries mentioned energy efficiency; in addition, some countries committed to reforming their subsidies for fossil fuels.
During 2015, the total number of countries which is using renewable energy policies increased again. As of year-end 2015, at least 173 countries had renewable energy targets (not considering INDCs), and an estimated 146 countries had renewable energy support policies, at the national or state/provincial level.
As of 2014, renewable energy provided an estimated 19.2% of global final energy consumption. Of this total share, modern renewables (not including traditional biomass) increased their share slightly over 2013 to approximately 10.3%. In 2014, hydropower accounted for an estimated 3.9% of final energy consumption, other renewable power sources comprised 1.4%, and renewable heat energy accounted for approximately 4.2% (Ren21, Global Status Report, 2016).
The overall development of renewable energy is not homogeneous among the different parts of the world. For a majority of the world's population, traditional biomass energy is still an important energy source. Although in recent years this traditional use has started to level off due to increasing urbanization and the uptake of modern energy sources, it still dominates national energy statistics in many developing countries, with a large share of the population in these countries lacking access to modern energy services (Ren21, Global Status Report, 2015).
5
during the period if its energy consumption from non-renewable fuels increased by more than its grow in RES energy consumption. Global new investment in renewable power and fuels climbed to a record USD 285.9 billion in 2015 (not including hydropower projects >50 MW). This represents a rise of 5% compared to 2014 and exceeds the previous record (USD 278.5 billion) achieved in 2011. Including investments in hydropower projects larger than 50 MW, total new investment during 2015 in renewable power and fuels (not including renewable heating and cooling) was at least USD 328.9 billion. Investment in renewable energy has been weighted increasingly towards wind and solar power. Solar power was again the leading sector by far in terms of money committed during 2015, accounting for USD 161 billion, which is increase over 12% related to 2014, or more than 56% of total new investment in renewable power and fuels. Wind power followed with USD 109.6 billion, or 38.3% of the total energy and it is increase 4%.
As of 2014, renewable energy provided an estimated 19.2% of global final energy consumption. Of this total share and modern renewables (not including traditional biomass) increased their share slightly over 2013 to approximately 10.3%. (Figure 1) In 2014, hydropower accounted for an estimated 3.9% of final energy consumption, other renewable energy power sources comprised 1.4%, and renewable heat and energy accounted for approximately 4.2%.
Although the use of renewable energy is rising rapidly, the share of renewables n total final energy consumption is not growing as quickly. In developed countries, energy's growth is slow, and displacing the big stock of existing infrastructure and fuels field takes time.
6
Renewables accounted for the majority (77%) of new European Union countries generating capacity for the last eighth consecutive year, and the region continued to decommission more capacity from conventional sources than it installed. Between 2000 and 2015, the share of renewables in the EU’s total power capacity increased 20% and become 44%, and, as of 2015, renewable sourses were Europe’s largest source of electricity. In Scotland, renewables met over half of electricity demand, a year ahead of an established target; throughout the United Kingdom, output from renewables hit a record high, passing coal for the first time in the fourth quarter of 2015. In Germany, renewable power output increased by 20% in 2015, and the share of renewables in electricity consumption was 32.6% this is hiher 27.4% in 2014. Even so, in most European countries' markets have slowed, due to diminished levels of financial support and to a growed focus on the integration of renewable energy sourses generation.
In world, the largest employers are the wind, solar photovoltaic (PV) and solid biomass industries. In 2014, a total of 7.7 million jobs (direct and indirect ones) were related to renewable energies globally (Renewable Energy in Europe 2016).
Employment in the renewable energy sector increased by 5% in 2015, to 8.1 million jobs (direct and indirect), as estimated by The International Renewable Energy Agency (IRENA). (Table 1) Solar PV and wind power remained the most dynamic markets, while solar PV and biofuels provided the largest numbers of jobs. In addition, large-scale hydropower accounted for another 1.3 million direct jobs in 2015.
Renewable energy markets and employment were characterized by favorable policy frameworks in several countries, regional shifts in investment and increased labor productivity.
Table 1: Estimated Direct and Indirect Jobs in Renewable Energy Worldwide, by Industry (2015)
World China Brazil United
State
India Japan European Union
Germany France Rest of EU
THOUSAND JOBS
Solar power 3725 2395 45 408 178 377.7 48.7 27 108
Wind power 1081 507 41 88 48 5 149 20 162
Hydropower
(small-scale)
204 100 12 8 12 12 4 31
Geothrmal
energy
160 35 2 17 31 55
Total 5170 3002 98 539 238 384.7 226.7 82 356
7
1.1.1 Solar energy
Solar enegy can be converted in thermal energy or photovoltic energy, to be used as electric energy. Solar energy has the highest potential in order to keep clean, safe and reliable the usage of energy.The solar radiation that reaches on the Earth is estimated to be 200 times more then the total energy constuption which humans are using at the present (New and Renewable Energy Resources, 1998).
Solar systems has may be based in two types of energy conversion; photovoltaic (PV) and solar thermal technology system.
Solar photovoltaics energy market expansion in most of the world is due largely to the increasing competitiveness of the conversion systems. In addition, the rising demand for electricity has been improving the awareness of solar PV’s potential, because countries are searchingthe ways to minimize pollution and greenhouse gas emissions.
Until recently, demand was concentrated in rich countries, but now, emerging countries' markets have begun to increase significantly their consumption, with solar PV taking off.
8
Asia eclipsed all other markets since 2012 year, accounting for about 60% of global additions. In the top three of solar PV markets are China, Japan and the United States (Figure 2). Other countries which are after in the top 10 for additions were India, Germany, the Republic of Korea, Australia, France and Canada. By the end of 2015 year, every continent (except Antarctica) had installed at least 1 GW, and at least 22 countries had 1 GW or more of capacity. The leaders for solar PV per inhabitant were Germany, Italy, Belgium, Japan and Greece.
Regarding solar thermal technology, it is used widely in all regions of the world for affordable hot water, to heat and cool spaces, and to provide higher-temperature heat for industrial processes.
In 2015 global capacity of glazed and unglazed solar thermal collectors continued to rise .For the same year the 18 largest markets are spread across all continents and present 93–94% of total the year's global additions. Their newly installed capacity totalled decreas 14% from the 43.4 GW to 37.2 GW installed by these countries in 2014.The continued slowdown in 2015 was due primarily to shrinking markets in China and Europe.
The top countries for new installations in 2015 were China, Turkey, Brazil, India and the United States, and the top five for cumulative capacity at year-end were China, the United States, Germany, Turkey and Brazil (Figure 3). Of the top 18 installers, the leading countries for average market growth between 2010 and 2015 were Denmark (34%), Poland (14%) and Brazil (8%); the most significant market decline over this period was seen in France (-17%), Austria (-14%) and Italy (-14%).
China again was the largest market by far in 2015, with gross additions of 30.45 GW.
Figure 3: Solar Water Heating Collectors Global Capacity, Shares of Top 12 Countries and Rest of World, 2014.
9
1.1.2 Wind Energy
Wind speed has a significant role in the wind power generation cost, If the wind speed doubles, the wind power increases eight times. This means that, the higher the wind's speed is more easily and cheep is the captured energy (Environmental Impacts of Wind power, 2013).
Unlike solar energy, wind energy works well on cloudy days and rainy season also but, in the other hard, it has an intermittent characteristic.. The location of wind turbines is a very important factor, which influences the performance of the overall conversion system. The windmills are generally located at heights of approximately 30 m.
Wind passing over the blades is converted in to mechanical power, which is fed through transmission to an electrical generator. Wind turbines will not work in winds below 13 km per hour. When wind speed average is 22 km per hour conversion system are able to work the point of maximum effeciency. Wind power was the leading source of new power generating capacity in Europe and the United States in 2015, and the second largest in China. Globally, a record of 63 GW was added to a total of about 433 GW. Non-OECD countries were responsible for the majority of installations, led by China, and new markets emerged across Africa, Asia and Latin America. Corporations and other private entities continued turning wind energy reliable and low-cost power.
In some of the largest markets increase was driven by uncertainty about future policy changes; however, wind deployment also was driven by wind power's cost-competitiveness and by environmental and other factors.
10
Figure 4: Wind Power Global Capacity and Annual Additions, 2005–2015. Source: Renewables 2016 Global Status Report (2016, p. 77)
Wind power is playing a major role in power supply in an increasing number of countries. In the EU, capacity in operation at the end of 2015 was enough to cover an estimated 11.4% of electricity consumption in a normal wind year.
During 2015 year here was a strong increase in the offshore sector with an estimated 3.4 GW connected to grids, mostly in Europe, for a world total exceeding 12 GW. Wind power is playing a major role in meeting electricity demand in an increasing number of countries, including Denmark (42% of demand in 2015), Germany (more than 60% in four states) and Uruguay (15.5%) (REN21, global status report, 2016).
Most wind turbine manufacturing takes place in China, the EU and the United States, and the majority is concentrated among relatively few players. In 2015, by some estimates, Goldwind (China) surpassed Vestas (Denmark) to become the world’s largest supplier of wind turbines.
1.1.3 Geothermal Energy
11
Almost everywhere, the small ground or upper 3 meters of the Earth's surface, there is a nearly invariable temperature between 10°C and 16°C. Geothermal heat pumps can tap into this resource to heat and cool buildings. A geothermal heat pump system consists of a heat pump, an air delivery system, and a heat exchanger, a system of pipes buried in the shallow ground near the building. In the winter time, the heat pump removes heat from the heat exchanger and pumps it into the indoor air supply system. In the summer, the process is reversed, and the heat pump moves heat from the indoor air into the heat exchanger. The heat removed from the indoor air during the summer can also be used to provide a free source of hot water (Renewable energy news and information: Geothermal energy, 2017).
In Europe, renewed calls were made to policy makers to support geothermal energy development, primarily through technology-neutral policy measures such as improved data collection in the heat sector; the provision of financing that is directed towards renewable heat and cooling; and a formal examination of the potential for dispatch able renewable energy resources to complement rising shares of intermittent renewables. Another requirement that is specific to geothermal energy is public risk insurance to mitigate geologic risk. In that context, the French government announced a new USD 54.6 million (EUR 50 million) geothermal risk fund in 2015 that will facilitate the initiation of new exploration efforts that carry the greatest risk profiles (REN21. Global status report, 2017).
At the end of 2015, the countries with the largest amounts of geothermal power generating capacity were the United States (3.6 GW), the Philippines (1.9 GW), Indonesia (1.4 GW), Mexico (1.1 GW), New Zealand (1.0 GW), Italy (0.9 GW), Iceland (0.7 GW), Turkey (0.6 GW), Kenya (0.6 GW) and Japan (0.5 GW).
Turkey continued its relatively rapid build-up of geothermal power capacity, with 10 units completed in 2015, adding 159 MW for a total of at least 624 MW. Turkey is on its right way to meeting its goal of having 1 GW of geothermal power capacity in place by 2023.9 In 2015, the country generated 3.37 TW with geothermal energy, up 50% over 2014.
12
Figure 5: Geothermal Power Capacity and Additions, Top 10 Countries and Rest of World, 2015. Source: Renewables 2016 Global Status Report (2016, p. 51)
1.1.4 Hydropower
Hydropower became a source for generating electric power in the end of 19th century. Hydropower uses the energy of kinetic and/or potential energy of water. Rain or melted snow, usually originating in mountains, create streams and rivers that finnaly run to the ocean. The energy of that moving water can be substantial (IEA, 2017).
Hydropower is a versatile, flexible technology that can be used to power a single home, as pico or micro power plants, or, as the largest hydropower station which can supply power in the range of giga watts with renewable electricity on a national and even regional scale (Hydropower status report, 2017). Hydropower plants can be constructed in a variety of sizes and with different characteristics. In addition to the importance of the head and flow rate, hydropower schemes can be put into the following categories
13
Reservoir (storage) hydropower schemes, which have the ability to store water behind the dam in a reservoir in order to de-couple generation from hydro inflows;
Pumped storage hydropower schemes, using off-peak electricity to pump water from a reservoir located after the tailrace to the top of the reservoir, so that the pumped storage plant can generate at peak times and provide grid stability, balancing the production and the consumption (Dolf, 2012).
As in the past several years, the most significant share of new hydropower capacity was commissioned in China, which accounted for about one-half of the global total. Other countries with substantial additions in 2015 included Brazil, Turkey, India, Vietnam, Malaysia, Canada, Colombia and Lao PDR (Figure 6).
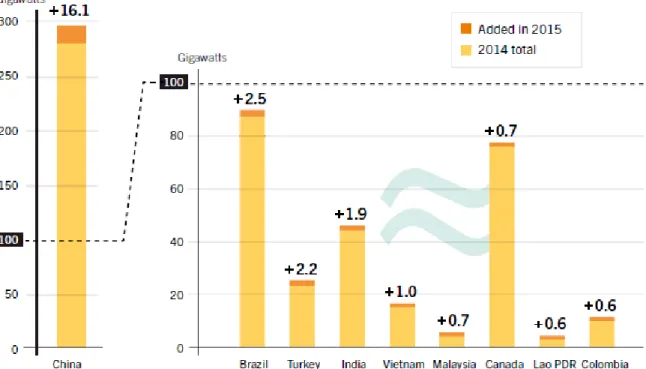
Figure 6: Hydropower Capacity and Additions, Top Nine Countries for Capacity Added, 2015. Source: Renewables 2016 Global Status Report (2016, p. 55)
14
Hydropower capacity in Brazil increased in 2015 by 2.5 GW (2.8%), including 2.3 GW of large-scalei hydro (>30 MW) capacity, for a year-end total of 91.7 GW. Despite the increase in capacity, hydropower output, at 382 TW, dropped again (2.7% relative to 2014) due to continuing drought conditions. Between 2011 and 2015, Brazil’s hydropower output declined about 15%, even as capacity expanded by about 11%.
1.2. Assessment of the actual state of art of renewable energy in Republic of
Armenia
Armenia does not have any fossil fuel or coal reserves, and is therefore entirely dependent on imported fuel for transportation, electricity generation, and heat production. While surrounded by countries that possess significant hydrocarbon reserves, Armenia’s fossil fuel reserves are limited to a small number of lignite or brown coal mines located in the vicinity of Gyumri and Spitak. Oil drilling results have shown that while some oil reserves exist, they are located too deep to be economically viable for extraction (R2E2, 2011).
The energy industry of Armenia is based on three components: nuclear, natural gas, and water resources. In Armenia energy are traditional sub atomic energy (because in Armenia has atomic station) and thermal energy which are problematic and stable operation due to various external factors. Too many inhibiting factors for the development of hydropower are coming here and everything is clear (Maruhyan & Hovhannisyan, 2009).
Renewable energy in Armenia is not the most developed, but it is the most promising direction for the development of the energy industry.
Despite the great potential, the share of renewable energy in the energy sector is still small and does not play a major role, exept the energy from small hydroelectric power plants [Manukyan, 2013]. Renewable energy development has been slow in the past, but its application throughout the world is accelerating. Policies to stimulate a faster deployment of clean energy technologies are necessary and will, in turn, create a level playing field by addressing market barriers, creating transparent pricing structures, and facilitating access to infrastructure financing. Because the renewable energy industry is not yet at the same level of development as the more traditional energy industries, it needs a more favorable regulatory environment in the near term for its development, survival, and transformation to a mainstream energy resource. In particular, small hydropower plant (SHPP) have been a major renewable energy deployment success story in Armenia over the last decade
.
15
technologies exhibit promising potential, they are less mature and require long-term vision, government encouragement, and favorable regulations to flourish. The U.S. and European Union have implemented effective support policies for renewable energy development, which have resulted in the acceleration of renewable energy technology deployments in recent years, which should also be implemented in Armenia (Simonyan, 2011).
The main body for all energy policy matters and issues in Armenia resides with the Ministry of Energy and Natural Resources (2016), which is responsible for overseeing and managing all aspects of the energy sector. The main quasi-governmental organization that is heavily involved in renewable energy research and financing is the Renewable Resources and Energy Efficiency Fund (R2E2, 2013) of Armenia.
General energy-related issues in Armenia are regulated by the Energy Law, and specific issues related to renewable energy are regulated by the Law on Energy Saving and Renewable Energy. The main purpose of the latter is to define the state policy on the development of energy saving and renewable energy. The idea is to strengthen the economic situation and energy independence of Armenia by increasing the level of indigenous renewable energy production (Babayan & al, 2011). Figure 7 presents the penetration of renewable energy in Republic of Armenia in thousands toe from 2000 till 2015.
Figure 7: Renewable energy total in Armenia, Thousand toe, 2000 – 2015. Source: Adapted from OECD Data (2017)
0 50 100 150 200 250
Th
o
u
san
d
to
16
1.2.1 Solar energy in Armenia
The Sun is the most widely used source of clean and inexhaustible energy. Over the past years the companies developing solar energy have become profitable, competing with those dealing with conventional energy both in terms of economic returns and in terms of safety. Solar energy has been broadly used both in water heating systems to generate thermal energy and electric power through photoelectric converters.
Armenia has a significant advantage in terms of solar energy: the country is situated in the proximity of subtropical zone; most provinces have favorable climatic conditions that make wide use of solar energy possible (21-st century, 2008).
Armenia has a significant solar energy potential. The average annual amount of solar energy flow per square meter of horizontal surface is about 1720 kWh (the average European is 1000 kWh). One fourth of the country’s territory is endowed with solar energy resources of 1850 kWh/m2
/year.
In Armenia solar thermal energy is rapidly developing. In fact, the private sector is importing parts for solar water-heating systems, with a view to their subsequent assembly, as complete sets. Currently, the use of solar water-heating systems in Armenia is not only to ensure energy savings, but also has become cost-effective. In the framework of deferent charitable programs of International financial companies, solar water heating systems have been installed in many settlements such as nurseries, residential houses and medical facilities.
In Armenia solar water heating collectors with total surface area of 1,38 - 4,12m2 are produced. The collector with 2, 75 m2 total surface area produces 120-160 liters hot water per day (Ministry of energy infrastructures and natural resources of RA, 2017).
1.2.2 Wind Energy Program in Armenia
In 2003, the Wind Energy Resource Atlas of Armenia was drawn. According to it, economically reasonable wind power potential is estimated at 450 MW total installed capacity and at electric power output of 1.26 billion kWh/year. The main promising locations are the Zod (Sotk) Pass, Bazum Range, Pushkin and Qarakhach Passes, Jajur Pass, Geghama Range, Sevan Pass, Aparan Region, Sisian-Goris Hills and Meghri Area (Maqur Energia, 2013) .
17
Within the European Union program a monitoring in the Semenovka Pass in Sevan region was organized and a preliminary feasibility study for the construction of a wind power plant with a total installed capacity of 35 MW was compiled.
Within the framework of wind energy program of Armenian - Italian private company ―Ar Energy‖, a monitoring was completed at Qarakhach Pass in Shirak region, for the construction of 140 MW wind power plant.
The company "Zod Wind" has completed the monitoring within the framework of wind energy program near Zod Pass in Gegharkunik region, for the construction of 20 MW wind power plant.
The private companies ―Ar Energy‖ and ―Zod Wind‖ are negotiating with various companies to attract investments for the construction of ―Qarakhach-1‖ and ―Zod‖ wind power plants.
Summarizing the legislative acts, it should be mentioned that the Republic of Armenia has created numerous mechanisms, promoting the use of renewable energy sources, for example:
With the ―Law on Energy‖ of RA, it is guaranteed the purchase of the whole electricity generated by renewable energy sources according to the established order -15 years for SHPPs, and 20 years for solar, wind, biomass and geothermal.
In accordance with the above-mentioned procedure, in the end of every year the tariff for the wind energy is indexed due to the fluctuations in the national currency of Armenia against the USD for a certain period of time and due to the changes of consumer prices in the Republic of Armenia (Ministry of Energy Infrastructures and Natural Resources of RA, 2017).
1.2.3 Hydropower in Armenia
The most advanced use of renewable energy technology application in Armenia today is hydropower, both in the use of large-scale power (e.g.- waters of Lake Sevan) and the more recent installation of small, run-of–the-river hydropower plants (SHPPs) throughout the country.
Utilization of the whole hydro potential will be obtained by using the existing two major HPPs cascades (Sevan-Hrazdan HPPs Cascade and Vorotan HPPs Cascade), construction of three new middle size HPPs and utilization of small HPPs potential (Manukyan, 2013).
Sevan-Hrazdan Cascade
18
placed on the River Hrazdan and at present they use irrigation water flow from Lake Sevan and streams waters of the Hrazdan River.
Vorotan HPPs Cascadе
Vorotan HPPs cascade consists of 3 hydro power plants, placed on the River Vorotan in the territory of Syunik region, and they use both the river and streams waters. HPPs Cascade consists of Spandaryan (76 MW), Shamb (171 MW) and Tatev (157 MW) HPPs with 404 MW total installed capacity and 1.16 billions.kWth annual generation of electricity.
Small HPPs in Armenia
Construction of SHPP in Armenia is a leading course of action towards development of renewable energy sector and securing of energy independence in Armenia. The majority of SHPPs designed; under construction and/or operation in RA are derivational stations on natural water flows. As of the 1st of January 2017, electricity was generated by 178 SHPPs, with about total 328 MW installed capacity and 880 million kWh annual average electricity actual supplies. In 2016 the generation of the electricity from small HPPs was around 957 million kWh, which is about 13% of the total generated electricity in Armenia (7315 million kWh). As of the 1st of January, 2017 and according to the provided licenses, 39 additional SHPPs are under construction, with about total projected 74 MW capacities and 260 million kWh electricity annual supplies.
By the decision of the Public Services Regulatory Commission the procedure for determining the electricity tariff produced by the power plants using the renewable energy sources was approved. According to it, the tariff for the hydro energy is set on an annual basis. According to the decision of the Public Services Regulatory Commission N 128-N dated 25 May, 2016 the tariffs for electricity are presented in Table 2.
Table 2: Feed-in-tariffs for renewable energy system from SHPPs, 2016 (excluding VAT) Feed-in Tariff
Renewable energy technology AMD/kWh Euro/kWh
Small hydro-power built on “Natural water system” 23.753 0.05
Small hydro-power built on irrigation systems 15.832 0.03
Small hydro-power built on ”drinking water supply systems” 10.556 0.02
19
In accordance with the above-mentioned procedure, in the end of every year the tariff for the hydro energy is indexed due to the fluctuations in the national currency of Armenia against the Euro for a certain period of time and due to the changes of consumer prices in the Republic of Armenia (Ministry of Infrastructures and Natural Resources of the RA, 2016).
1.3. The impact of renewable energy on the environment
Nowadays, fossil fuels are the main energy sources from which electric power has been produced. These resources are not renewable, that is, primary sources will end, which means they should be replaced by renewable energies. But all kind of energy sources have some impact on the environment. Fossil fuels (coal, oil, and natural gas) present more damage than renewable energy sources. However the renewable sources types and quantity of environmental effects are different from fossil fuel sources. Using renewable resources does not mean that their impacts are equal zero. An understanding of the relative environmental impacts of the different energy power sources is important to the development of rational energy policy (Environmental impacts of RE technologies, 2014).
Intensity of environmental impact of renewable energy sources is different depending on the technology in use, the geographic location, and a number of other factors. Renewable energy sources' impact can be analyzed by air and water emissions, waste generations, noise generation, and global warming emissions. For instance, a wind farm, when installed on agricultural land, has one of the lowest environmental impacts of all energy sources: it occupies less land area per kilowatt hour (kW) of electric power generated than any other energy conversion system, separately from rooftop solar energy. Wind farm generates the energy used in its construction in just 3 months of operation, yet its operational lifetime is 20–25 years. Additionally greenhouse gas emissions and air pollution produced by its construction are very declining.
There are no emissions produced by its operation. In substituting for base-load (mostly coal power) wind power produces a net decrease in greenhouse gas emissions and air contamination, and a net increase in biodiversity; modern wind turbines are almost silent and rotate so slowly that they are rarely a hazard to birds (Wind Farms, The facts and the fallacies, 2006). Wind turbines may create shadow flicker on nearby residences when the sun passes behind the turbine.
Birds can directly break up into moving or even stationary turbine blades, crash into towers, and collide with local distribution lines. These risks are exacerbated when turbines are placed on ridges and upwind slopes or built close to migration routes. Some species, such as bats, face additional risks from the rapid reduction in air pressure near turbine blades. (Environmental impacts of RE technologies, 2014).
20
The potential of solar power environmental impacts associated with land use and water use, and the use of dangerous materials in manufacturing and can vary much depending on the technology, which includes two broad categories: photovoltaic (PV) solar cells or concentrating solar thermal plants (CSP). The scale of the system, ranging from small, apportioned rooftop PV arrays to large utility-scale PV and CSP projects, also plays a big role in the level of environmental impact.
Depending on their location, larger utility-scale solar facilities can raise trusts about land degradation and land loss. Unlike wind facilities, there is less opportunity for solar projects to share land with agricultural uses. However, land impacts from utility-scale solar systems can be minimized by siting them at lower-quality locations such as brownfields, abandoned mining land, or existing transportation and transmission corridors (www.ucsusa.org, 2017).
Geothermal power is a relatively good source of energy. For the most part, the geothermal power's impacts are positive. Worldwide geothermal energy utilization yearly increases because it is an attractive alternative to burning imported and domestic fossil fuels.
Electric power generation from geothermal resources include much lower greenhouse gas (GHG) emission rates than that from fossil fuels. In the International Atomic Energy Agency (IAEA), replacing one kilowatt hour of fossil power with a kilowatt hour of geothermal power reduces the estimated global warming impact by approximately 95% [Five lectures on environmental effects of geothermal utilization, 2001].
However, geothermal development could have certain negative impacts if appropriate softening actions and monitoring plants are not in place. Any large-scale construction and drilling operation will produce visual impacts on the landscape, create noise and wastes and affect local economies. Some countries have strong environmental regulations regarding some of the impacts related with geothermal development. Environmental issues are usually addressed during the development of geothermal fields including air quality, water quality, waste disposal, geologic hazards, noise, biological resources and land use issues (Environmental Effects of Geothermal Power, 2012).
Although hydropower has no air quality impacts, construction and operation of hydropower emission can significantly affect natural river systems as well as fish and wildlife populations. Assessment of the environmental impacts of a specific hydropower facility requires a case-by-case review. Negative impact of dams are as follows:
- In flat basins, large dams cause flooding of large tracts of land, destroying local animals and habitats; people have to be displaced causing change in life style and customs.
- Large numbers of plant life are submerged and decay anaerobically; the migratory template of river animals like salmon and trout are affected; dams restrict sediments that are responsible for the fertile lands downstream.
21
- Large dams are breeding grounds for mosquitoes and cause the spread of disease; dams serve as a heat sink, and the water is hotter than the normal river water, and this warm water when emitted into the river downstream can affect animal life (Sanguri, 2013).
1.4. Solutions for developing renewable energy sector in Republic of Armenia
Armenia faces a number of barriers to the further development of renewable energy. Scaling up the renewable energy program (SREP) funding can be instrumental in helping to remove or at least weaken a number of these barriers.
One of the most significant barriers to renewable energy in Armenia is the high cost of investment relative to the currently low cost electricity generation mix in the country. Tariffs are low because many of the thermal power plants generating electricity are fully depreciated and need only to recover variable costs. This will change as new generation plants are brought online and tariffs are raised to reflect their capital costs. In the meantime, however, the low cost of generation makes it difficult for consumers to understand the need for higher-cost renewable energy generation which will satisfy –at least initially only a small portion of demand. This is a barrier of perception which, as described below, Government can overcome with SREP’s assistance.
There are also legitimate concerns about affordability. The global economic crisis increased the already high incidence of poverty in Armenia. Between 2008 and 2010, the poverty incidence increased from 27.6 % to 35.8 % of the population, and severe poverty grew from 12.6 % to 21.3 % of the total population. Energy poverty, in which households spend more than 10 % of their budgets on energy, affects nearly 30 % of Armenian households. The poorest quintiles of the population allocate a relatively higher share of their budgets to electricity than rural households. These households are likely to experience more significant pressures on their budgets as a result of increased energy tariffs. A recent World Bank study has estimated that, when a new thermal plant is built, tariff increases could result in increases in poverty of 1-8 %, depending on the sources of financing used, the gas price, and the technology (nuclear or gas) built first (Manukyan, 2013). Higher tariffs also have environmental consequences in Armenia. The historical experience in Armenia is that poorer, rural households have switched, at least temporarily, to traditional fuels (mostly firewood, collected illegally) when electricity and gas tariffs increase. Armenia’s forests shrunk by roughly half during the years of energy crisis, and now the forests cover only roughly 10 % of total area of the country.
22
- The absence of regulatory incentives for certain technologies. The Law on Energy guarantees cost recovery through tariffs, but feed-in tariffs were never set for some renewable energy technologies because of perceptions about cost and the absence of long-term financing opportunities. Solar PV, for example, was not initially thought to be commercially viable, and so was not, until recent years, a priority in Armenia.
- Limited capacity for equipment acquisition and installation. Limited experience with certain technologies limits the expansion of solar PV and large scale geothermal. It also substantially raises the costs of doing first projects in these technologies.
- A lack of technical capacity among local financiers. The success of the SHPP program is owed, in part, to the good quality of technical assessments completed by local commercial banks in programs supported by the World Bank, European Bank for Reconstruction and Development (EBRD) and Germany’s Kreditanstalt für Wiederaufbau (KfW). Local commercial banks do not, however, currently have capacity to assess other types of RE projects.
- A lack of confidence in certain technologies. The lack of experience with RE technologies makes potential developers, property owners and energy users skeptical of these technologies and inclined to take the risk of being the first to use them.
- Underdeveloped local markets for certain technologies. The lack of experience in certain technologies also means that there are no markets for services or expertise required to develop projects using certain technologies. Whereas the technologies themselves are typically imported, project development requires local expertise in engineering design, procurement and installation. The market for such services is extremely thin in Armenia. These barriers do not exist for all technologies, nor do all of the barriers listed above affect any single technology. There is some experience, for example, with small hydro, wind, and biomass (SREP, 2014).
23
PART II: Economic and Financial Performance of Companies of
Renewable Energy Sector
2.1. Literature review on financial performance of renewable energy
industries
Electric power industry is under pressure for increase clean energy production. However, the renewable energy can improve the utilities' environmental performance for every company, not only the companies that are making renewable energies (IRENA; Rethinking energy, 2014). Electric utilities play a main role in energy provision system to renewable energy process of change, because they represent the backbone of the power supply infrastructure. On the other hand, even though the adoption of renewable energy can be seen as a way to improve environmental efficiency, a main question is if it also pays in economic terms.
24
performance over time. Annual ROI, ROE and operating margin for large OECD countries' firms identified (Shin et al; 2016).
Our research advances current knowledge about the influence of RE utilization by demonstrating that top RE user firms consistently generated superior financial performance compared to their industry competitors. As such, the study findings lend credence to the existence of a business case that complements the societal and environmental benefits of using RE (Shin et al; 2016).
The discussion about if an increase of renewable energy capacity may affect the financial performance of electric utility industry can be seen as a part of the large discussion about corporate environmentalism and its profitability. Indeed, despite the studies that exist for more than two decades, the question of, if renewable energy capacity pays to be green is far from being settled. A slight majority of the researches present a positive relationship between environmental performance and financial performance while the rest show either a negative or neutral relationship. Some authors supporting a natural-resource-based view of the company have reason that companies can attain a competitive advantage or superior performance by implementing proactive environmental strategies. This kind of strategies lead to the development of capabilities that have implications for a firm's performance in terms of lower costs, improved reputation, and strategic alignment with ongoing changes in the business environment (Deloitte, 2015).
Over the last 15 years, the power sector has been privatized in numerous developed and developing countries though it remains highly regulated. The growth of renewable energy production in the industry has been mainly driven by policy mechanisms such as feed-in tariffs and renewable quota obligation (Seng & Vithessonthi, 2017). The new reality is that the cost of generating power from renewable energy sources has reached parity or dropped below the cost of fossil fuels for many technologies in many parts of the world. Biomass, hydropower, geothermal and onshore wind are all competitive with or cheaper than coal, oil and gas-fired power stations, even without financial support and despite falling oil prices. These low prices are making the business case for renewable energy stronger than ever (RE Global Status Report, 2016). Renewable energy is not just about saving the environment any more. It is now also about stimulating the economy, creating jobs, generating new sources for growth, increasing income and improving trade balances (RE thinking energy, 2017).
2.2. Research design
25
2.2.1 Objectives, research questions and sample
After describing some of renewable energy sources and analysed the evolution of this market in the last decade (one of the objectives of this dissertation), this part of dissertation has two main objectives. First objective is to analyse the behaviour of the market in terms of stock prices, stock returns and volatility of those companies comparing them. The second one is to analyse the profitability (financial performance) based on financial ratios for these renewable energy companies.
Related to the objective of first part of dissertation it is postulated that the renewal energy market is increasing along time in the OECD countries and all over the world. In line with the first objective of 2nd part, the research questions (RQ) are as follow:
RQ1a – Are the renewable energy companies profitable (that is, do they have positive return based on stock prices)?
RQ1b – Are the beta of these companies lower than one (that is, are these companies less risky than the market, using the beta coefficient as indicator of market risk)?
Related to second objective, the research questions (RQ) are as follow:
RQ2a: Have Renewable Energy companies in OECD countries increased the return on assets in the last five years?
RQ2b: Have Renewable Energy companies in OECD countries increased the return on equity in the last five years?
RQ2c: Have Renewable Energy companies in OECD countries increased sales return in the last five years?
To test the research questions of second main objective, because of the short time was selected only five companies, from different OCDE countries (Portugal, France, Spain, Italy and Germany). The companies are from different countries for seeing their evolution and financial changes not only for one country. All companies are listed in stock exchanges and have publicly data, namely their financial statements and reports. These companies produce both kind of energy, using renewable and no-renewable sources. The companies in the sample are:
EDF group, listed in Paris Euronext Stock Exchange (France);
EDP- Energia de Portugal, listed in Lisbon Euronext Stock Exchange (Portugal); Iberdrola, listed in Madrid Stock Exchange (Spain);
ENEL, listed in Milan Stock Exchange (Italy):
26
2.2.2 Data, Variables and analysis methods
For the companies in the sample, it was collected financial and non-financial data for period of 2011 to 2016. Therefore, from their official websites, it was gathered the financial reports and compiled these data in an excel file to compute some ratios that are commonly used to analyse the financial position of the company. It was compiled the Balance Sheet and Income Statement for each year from 2011 to 2016. These data will allow calculating the variables, and therefore, the most used ratios (such as return on equity (ROE) , return on assets (ROA), net sales return, current ratio, debt ratio, debt to equity ratio etc.) to validate the research questions.
It was also collected historical market prices of companies’ stocks under analysis, as well as historical prices of major indexes of these markets. For each company, market data were collected for the year 2000 (or since the year of inception) until 2017. These data were gathered from the website Yahoo!Finance. Common stock is a residual income security. The stockholders have a claim on any income remaining after the payment of al obligations, including interest on debt. If the company prospers, stockholders are the chief beneficiaries; if it fails, they are the chief losers. The amount of money a stockholder receives annually debts on the dividends the company choses to pay, and the board of directs, which make this decision quarterly, is under no obligation to pay any dividend at all (Higgins; 2007). Therefore it will be analysed the stock return over this period.
To analyse the performance of these companies it will be applied the ratio analysis, using financial data collected from its annual financial reports. A ratio can be computed from any couple of numbers. Given the large quantity of variables included in financial statements, a very long list of meaningful ratios can be derived. A standard list of ratios or standard computation of them does not exist (Brealey, Myears & Allen, 2011). Ratio analysis becomes a very personal or driven by company's process. Ratios "are just a convenient way to summarize large quantities of financial data and to compare firms’ performance‖ (Brealey, et al., 2011, p.704). Brealy et al (2011), as Ross, Westerfield and Jordan (2010), suggest some ratios based on accounting data (reported in firm’s financial statements) to measure the performance, the efficiency, leverage and liquidity.
27
and Total Long-term Capital or just Total Capital. These are obtained from Balance Sheet. The Table 3. (below) presents the most common ratios used to measure firm´s performance or profitability.
28
Table 3: Common used ratios to measure firms’ performance.
Ratio Computation Interpretation (information
Provided) Source Economic Added Value (EVA) (1) where,
ROC is return on capital;
WACC is the average cost of capital IC is total invested capital (long-term debt plus equity)
It is the profit after deducting all costs, including the cost of capital.The firm creates value for investors only if it can earn more than its cost of capital, that is, more than its investors can earn by investing on their own.
Brealey et al (2011)
Return on capital (or ROC )
(2) where,
It measures the total profits that the company has earned for its debt and equity holders, divided by the amount of money that they have contributed.
Brealey et al (2011)
Return on Equity (ROE) (3) Or (4)
Note: some authors uses the average Equity
Measures income to shareholders per dollar invested.Because benefiting shareholders is Firm’s goal, ROE is, in an accounting sense, the true bottom-line measure of performance. It is a measure of the efficiency with which a company employs owners’ capital.
Brealey et al (2011); Higgins (2012); Ross et al (2010);
Return on Assets (ROA)
(5) Measures the income available to debt and equity investors per dollar of the firm’s total assets. Total assets (which equal total liabilities plus shareholders’ equity) are greater than total capital because total capital does not include current liabilities. It measures a company’s success in using assets to earn a profit. ROA is a basic measure of the efficiency with which a company allocates and manages its resources.
Brealey et al (2011); Higgins (2012); Horngren, Harrison & Oliver (2012)
(Net) Profit Margin
(6) Measures the proportion of sales that finds its way into Profits.It reflects
companies’ pricing strategy and operating managers’ ability to control operating costs. Brealey et al (2011); Higgins (2012) Operational Profit Margin