49
CLEANER PRODUCTION: A GROWING MOVEMENT IN BRAZILIAN
COMPANIES
PRODUÇÃO MAIS LIMPA: UM MOVIMENTO CRESCENTE EM
EMPRESAS BRASILEIRAS
Oduvaldo Vendrametto, Doutor, tel. 01138712550,oduvaldov@uol.com.br1 Nivaldo Palmeri, Mestre, tel. 01191552710, nivaldoluiz@uol.com.br1 Geraldo Cardoso O. Neto, Mestre, tel. 01176127859, geraldo.prod@ig.com.br1 Osvaldo D’Angelo Perretti, Mestre, tel. 01192644541, osvaldo.dp@uol.com.br1
1 Post Graduate Studies Program in Industrial Engineering. Paulista University, Rua Bacelar, 1212-ZIP Code 04026-002, São Paulo, Brazil.
ABSTRACT
Cleaner Production is gaining emphasis in both the world and Brazilian production sectors. Nature’s ending capability of absorbing and regenerating waste, stricter legislation regarding pollution emitters, and the market competitiveness associated with environmental and social responsibility are leading to actions for reducing environmental impacts. This paper reviews the concepts and presents three study cases in which two are in a large manufacturing automobile industry, and one in a small manufacturing company of medical supplies, with their suppliers promoting the change in the way they deliver their products, by either eliminating or reusing large volume of cardboard, plastic and wood packaging. For the environmental evaluation analysis the methodology of Material Intensity Factor was applied. The benefits of Cleaner Production implementation were evaluated by confronting environmental and financial assessment. Results showed that the companies reached financial, spatial and productivity gains. The important fact the paper reveals is the existence of a still fuzzy, yet incremental and growing movement within the companies, in order to reduce or eliminate either products or activities’ which do not aggregate values to the product, damage the environment or spoil the company’s image towards the market.
Key words: improvement in productivity, waste disposal, Material Intensity Factor.
RESUMO
A Produção Mais Limpa ganha ênfase nos setores produtivos, mundial e brasileiro. O esgotamento da capacidade do meio ambiente de absorver e regenerar resíduos, a legislação
50
mais rígida sobre os emissores de resíduos e a competitividade do mercado associada à responsabilidade socioambiental provocam preocupações e ações para reduzir a agressão à natureza. Este artigo revê conceitos e apresenta três estudos de caso, em que dois são em uma grande montadora de veículos, e um em uma pequena empresa de equipamentos médicos, com seus fornecedores promovendo mudança na forma de entrega de produtos, eliminando ou reusando volumosa quantidade de embalagens de papelão, plástico e madeira. Para a análise da avaliação ambiental, a metodologia de Fator de Intensidade de Material foi utilizada. Os benefícios da implementação da Produção Mais Limpa foram avaliados confrontando as medidas ambientais e financeiras. Os resultados mostraram que as empresas obtiveram ganhos financeiros, de espaço e de produtividade. O fato importante que o artigo revela é a existência de um movimento ainda difuso, mas crescente e incremental entre as empresas, para reduzir ou eliminar produtos e atividades que não agregam valores, agridem o ambiente e desgastam as imagens das empresas frente ao mercado.
Palavras-chave: melhoria de produtividade, eliminação de resíduos, Fator de Intensidade de
Material.
1. Introduction
The increasing number of consumers as a result of population growth and global economic policy, regulated by the market and by aggressive competition, reduced nature's ability to handle waste to its maximum limit. This incentive for consumption promoted by competitors for the sale of their products makes use of powerful communication and persuasion instruments, and facilitates credit triggering large consumption of products. Excessive comsumption leads to the continuous disposal of used products due to their replacement with more innovative ones. This production-consumption-disposal cycle usually result in excessive use of natural misuse of raw material, energy and water supplies, as well as the soucers to absorb pollutants and to promote waste degradation.
The disproportionate variations between population growth and the needs for natural resources may result in environmental degradation (Table 1). In the case of paper use, as population and consumption increased it also increased the production and use of paper leading to the destruction of native forests and planting of artificial wood forests in order to obtain wood for cellulose paste and later paper will be produced. This disrupture of the environmental balance often leads to contamination of springs and desertification of agricultural (Giannetti and Almeida, 2006).
Table 1: Evolution of world and Brazilian population and paper and packaging production from 1950 until 2000.
51
Year
1950 2000 Expansion Factor
World population (billions) 2.5 6.0 2.4
Brazilian population (millions) 51 170 3.3
Paper production (x1000 tons) 248 6,589 * 26.5
Package production (x1000 tons) 112 2,709 * 24.1
Source: IBGE (1999) and (*) BNDES (1999)
Sustainability requires that industrial output be within the source and sink capacities of the environment (Daly, 1990). Previous studies have shown that externalities create a subsidy for the externalizing industry but at a cost to those receiving the externality that can lead to income distribution disparities, poverty and a loss of public welfare (Templet, 1995). In addition, industries that create large impact in producing goods are inefficient, resource intensive, wasteful (Templet, 1990; 2001), and are likely to suffer a competitive disadvantage (Porter and Van Der Linde, 1995) because their resource supply and waste costs per unit of goods are higher than those of more efficient producers. Mining industry is an example, as well as jewelery manufacture (Giannetti et al., 2008) and wood and paper production.
Most of excess of lost and waste in packaging is due to lack of planning and management. According to Ching (2006), supply chain management is an integrated way to plan and control the flow of merchandise, information and resources from vendors to the final client, seeking to administer relations in the logistics chain in a cooperative manner and on behalf of all those involved. Ohno’s lean concept (Lean Production, LP) indicates ways of producing more using less input (Womack, 2004), and it has been used in manufacturing strategies (Womack et al., 1992; Monden, 1997; Simpson and Power, 2005). This concept was stepwise modified into the Cleaner Production and applied in industrial processes (Rothemberg, 2003; Bicheno, 2004; Vais et al., 2006). The importance of material delivery by suppliers is underscored by Womack et al. (1992) who considers the difference to be in the way these components are delivered to an automotive industry.
The old concept of productivity did not take into account environmental losses from a production system. The productivity of a production system (a company, a sector of the economy, or even a nation) has been defined as the ratio of what was produced and the inputs
52
used for such over an interval of time (Moreira, 1991). Environmental loss is considered amongst the inputs. This concept, which is in a stage of evolution, begins to be introduced in the industrial process of productivity assessment. The first sign of this change is the conception of “carbon credit”. Companies with LP management need to receive and deliver components and products at the right time and in a just-in-time regime (JIT). According to Taylor (2005), the JIT supply program aims at eliminating excess of stock in the production process, and coordinating the movement of materials from each workstation in a way that they arrive at the precise moment needed to begin operations. Under this scenario, productivity is seen as being the ratio of what is produced and consumed resources over a specific period of time, and provides the means to reduce prices, increase profits, have safety at work and increases salaries (Martins and Laugeni, 2002).
According to Bowersox (2006) the Returnable Containers (RC) are most appropriate for integrated environments where there is reasonable control between shippers and clients. The automobile industry makes extensive use of racks and returnable packaging between the part supplier and their assembly lines. The decision to invest in a returnable packaging system involves explicit considerations about the number of shipping cycles. Return transportation costs versus purchase and disposal costs are what guide the decision. It is important to underscore that relationship management with the lean supplier should encourage supplier associations where the manufacturer’s top management gathers to share new findings on how to improve part production or new ways to perform the task (Womack et al., 1992).
In this research we looked upon the possibility of reducing waste in packaging based on Cleaner Production (CP) principles, in two production processes, , for improving the company productivity. The studied principle was to make better use of time through the elimination of the need to pack and unpack products. The present study aimed to improve the process of wooden, cardboard and plastic packaging using the Lean and Clean Production concepts in two distinct scenarios: a large automobile manufacturing (case study 1), and a small medical supplies industry (case study 2). The relevance of this study relies in the fact that specific concern with the environment seems to be the next step between the diverse production management methodologies, such as Total Quality Control (TQC) and Lean Production, which are expanded with the Cleaner Production concepts.
53
2. Metodology
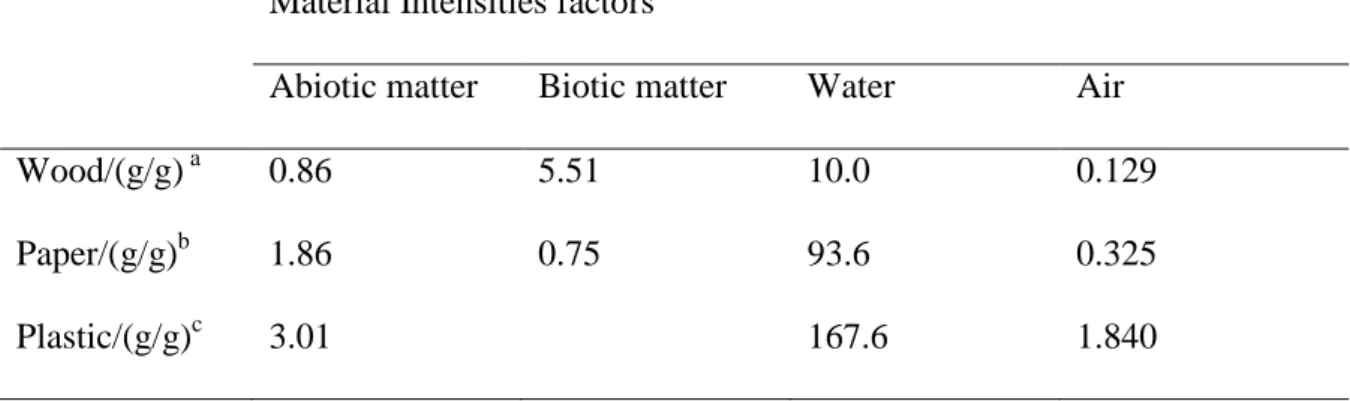
In order to evaluate environmental gains as a consequence of Clean Production program implementation, the material evaluation tools was used, as suggested by Rithooff et al. (2008). This method developed by the Wuppertal Institute, in Germany, evaluates the environmental disturbance associated with extraction of resources from their natural ecosystems. In this way, in order to supply a flow of matter as an input to a chosen system, a larger amount is previously processed in various environmental partitions, which is classified as: abiotic, biotic, water and air. The total amount of matter from each partition that is processed on the global scale to provide a given material is named as Material Intensity Factors (MIF, g/unit). To determine the total MIF, the mass input (expressed in proper units) is multiplied by the individual mass intensity factors, which corresponds to the amount of matter that was needed to produce and deliver one unit of input. The MIF values used in the present work are listed in Table 2. In the present case, only benefits due to cleaner production implementation were evaluated. The calculation includes only benefits related to mass savings. In order to compare to financial benefits, the financial savings were considered in each company.
Table 2: Material intensity factors of materials used in the present work (Wuppertal Institute, 2008).
Material Intensities factors
Abiotic matter Biotic matter Water Air
Wood/(g/g) a 0.86 5.51 10.0 0.129
Paper/(g/g)b 1.86 0.75 93.6 0.325
Plastic/(g/g)c 3.01 167.6 1.840
a Pine Wood, Germany data
b Corrugated cadboard paper, European data c
Polyethylene foil, European data
2.1. Description of the companies and the studied processes
2.1.1. Case study 1: A large automobile manufacturing located in São Paulo state, Brazil,
54
Ecological awareness is always present in the company, aligned to a culture of continuous improvement and leadership in technological innovation were fundamental elements for the company's participation in the Brazilian Cleaner Production Information System (INFOREDE) project, carried out in partnership with the Centro Nacional de Tecnologia Limpa (CNTL), SENAI-RS/UNIDO/UNEP. The company has adopted a Cleaner Production program in partnership with Senai since 2006. The project consists of the continuous application of environmental strategy that permits a reduction in natural resource consumption, waste generation and improvement in industrial processes. The phases of this project involve obtaining managerial commitment, identifying barriers to implementation and the search for solutions, establishing the range of the CP Program at the company and “organization of the Ecoteam (multifunctional groups)’’ (Nevens et al. , 2008), comprised of company professionals who have the objective of conducting CP programs.
The Cleaner Production Project Implementation Phases are:
a) To study the production process flowchart, carrying out the environmental and process diagnosis, and selecting the evaluation focus permit visualization and definition of the qualitative flow of raw materials, water and energy in the production process, and visualization of waste generation during the process. This acts like a tool to obtain necessary data to elaborate a strategy to minimize waste, effluent and emission generation. After developing the company’s production process flowchart, the Ecoteam will raise existing quantitative data for production and the environment. With the environmental diagnosis information in hand, as well as the spreadsheet for the main environmental aspects, the job’s focus is selected from among company activities and operations. This information is analyzed taking into account legal regulations, quantity of generated waste, waste toxicity and involved costs.
b) The elaboration of material balance and establishment of indicators by raising more detailed quantitative data in the process phases permit a qualitative comparison between existing data, before implementing the Cleaner Production program, and data from the program.
• Raw Materials – the use of lower cost raw materials; being below quality standards; without quality specifications; supply deficiencies; inappropriate purchasing management system, and inappropriate storage.
55 • Products – inappropriate proportion between waste and products; impractical product design, inappropriate packaging; product made of dangerous raw materials; product is difficult to assemble and recycle; shortage of capital for investment in technological and process changes; excessive focus on profit; no concern for waste and emission generations, and low working capital.
• Waste-related causes – no separation of waste; no consideration for the potential to reuse certain wastes; no recovery of energy in waste products, and emissions and inappropriate handling.
• Human resources – unskilled human resources; lack of occupational safety; quality demands – nonexistent or inappropriate training; work under pressure; growing dependence on temporary and outsourced labor.
• Commercial vendors/partners – purchases of raw materials from vendors without
standardization; lack of exchange with commercial partners and only looking for profits in negotiations; no concern for the final product.
• Know-how/process – poor use of process parameters and use of outdated process technologies.
c) Identification of Cleaner Production options:
• Modification in the process, involves process modification strategies. Process is understood as the entire production system in the company.
• Good operating practices, operational care or good housekeeping, implies the adoption of procedure, technical, administrative or institutional measures a company can implement to minimize waste, effluents and emissions. Good operating practices are frequently implemented with a low cost.
• Replacement of raw materials and auxiliary materials.
• Internal Recycling refers to every recovery process for raw materials, auxiliary materials and inputs made inside the industrial plant.
d) Technical, economic and environmental evaluation.
• In the technical evaluation, the impact of the proposed measure on the process, productivity, safety, etc.
56 • In the environmental evaluation, the quantity of waste, effluents and emissions that will be reduced, the quality of waste, effluents and emissions that have been eliminated and the reduction in the natural resource use.
• In the economic evaluation, the investments needed, existing operating costs and process revenues and projected operating costs and revenues from actions to be implemented and company savings with the reduction/elimination of fines.
e) Implementation and monitoring plan
Implementation of detailed technical specifications, appropriate plan to reduce installation time, expenditures to avoid exceeding the projected budget, careful installation of equipment, appropriate control of installation and preparation of the team and installation to start up operations.
Monitoring of the procedures to be implemented; when specific activities are expected to occur; who is responsible for these activities; when are results expected; when and for how long to monitor changes; when to evaluate progress; when should financial resources be ensured; when should management make a decision; when the option should be implemented; how long the test period should last and when is the implementation conclusion date.
f) Continuity plan
After the Cleaner Production Program is considered implemented it is important to not only evaluate obtained results, but most of all, to create conditions for the Program to have ensured continuity through the application of work methodology and the establishment of tools that permit maintaining the recognized culture, as well as its evolution, together with the company’s future activities.
This case study was divided in two parts: first the reuse of pallets was investigates, and then the reduction of the use of plastic in packaging of the bus exhaust system was studied.
a. Reuse of pallets
The used pallets were made of hard raw wood, equivalent to 415 ton, and they were used to separate in storage pieces of automobile during the manufacturing process. Those pallets were redesigned to be used in export of the company’s product. In order to make it feasible to reuse the wood, a specialized company was found to adapt the pallets received at import, into
57
pallets to be used to export products. Significant rework was necessary to adapt these pallets, such as: cutting of dents and edges; reverse boards at the base; clean the wood by removing nails and staples; phytosanitary treatment (chemical product NINF 15); complementing the pallet; and handling and storage of materials.
b. Reduction of plastic and cardboard use in packaging
Current production was about 8000 bus chassis per year, distributed over seven different models. Each vehicle uses an exhaust system (Figure 1) and depending on the model can range between 5 and 12 meters in length. Annual consumption need was 60,000 parts, divided into 33 different kits that comprise seven basic models of the exhaust system. On average, five parts were used per assembly. The exhaust system is comprised of components with a high probability of damage at finishing because they receive a high temperature “cure” paint job which was only performed after the vehicle had been fully assembled and effective use began. These components were manufactured by five suppliers, certified as “guaranteed quality suppliers” which deliver raw materials directly to storerooms and/or production lines with inspection upon receiving.
Figure 1: Example of bus exhaust system
In order to avoid damage to components during transportation or handling, the vendors pack the parts individually in plastic blister and/or cardboard, generating a large volume of waste. There is no single individual protection standard, and vendors deliver the pieces in lots of 40 buckets of various sizes. The area used to receive stock and prepare the items for sending them to the assembly line measured 100 m2.
At this site, one employee per shift, or two employees per day, worked to receive, organize and stock the parts. After receiving the daily production schedule, the items were located, unpacked and the waste was disposed in the appropriate location. The parts were placed in carts and transported to the assembly station. A gas-powered forklift and manual forklifts were used in this process.
58
2.1.2. Case study 2: A small medical supplies industry that produced equipments for use in
hemodialysis with 50 workers.
This company had a peculiar characteristic which the main concern was to supply basic needs, with the limitation of employees and centralization of strategic decisions with the owner. The production occurred according to specific demands, without planning or using significant financial investments, which aim at corporate objectives for competitiveness and sustainability, such as implementation of cleaner production. The demand for process improvements and increase in productive capacity indirectly brought beneficial financial, process and environmental management results.
2.2. Calculation of the environmental gain (EG)
In both studied companies previous modifications were carried out in order to reduce environmental impact through reducing waste. The new process adopted by them; however, did not include the calculation of the environmental gain in using it.
Both companies informed the total of mass material (MM) which was saved in the modified process. Using the MIF values (Table 2) the total environmental gain (EG), which is related to the impact that was not used in nature by saving the products, involved in both cases was calculated such as:
EG = MM * MIF Eq. 1
3. Results and discussion
CP implementation is limited in this study to three applications considered incremental. The first two refer to application at a large automotive industry in Brazil, and the other to a small Brazilian company that manufactures medical products. Both seek to reduce or eliminate waste at the source. The companies’ vendors deliver their products with excess packaging due to the difficulty in devices to allocate parts and components in custom-made packages, or to promote a study in dimensions and format to organize the products in boxes.
3.1. Case study 1
59
With implementation of the Cleaner Production Program, multifunctional groups were formed (ecoteams), and by studying the environmental diagnosis and production process flowchart, it was possible to identify the potential for gains, with the optimization of pallets in the import and export process.
In this project, we studied the annual receiving of nearly 45,000 wooden pallets, weighing 1,700 tons. These packages were used to protect imported parts and components used in vehicle manufacturing. Of this total, 25% (425 tons of wood) was thrown out at a cost of R$ 50,000.00 (US$ 23,255.00 in 2006).
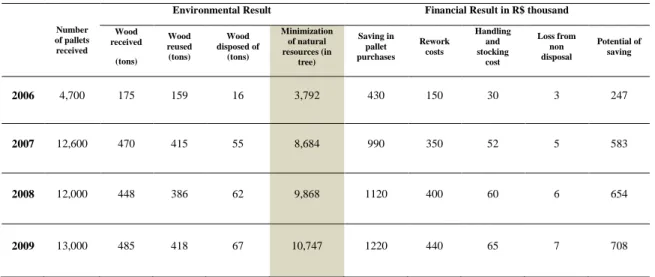
Results show that during 2007, the company’s wooden pallets use was reduced, corresponding to 8.684 trees (Table 3). In changing the waste management the company showed more efficiency in the waste management, agreeing with Templet (1990 and 2001), and meeting the concepts of Clean Production. The environmental gain led to a competitve advantage for the company, as demonstrated by Porter and Van Der Linde (1995).
Table 3: Reuse of wooden palletsin the case study 1.
Number of pallets received
Environmental Result Financial Result in R$ thousand
Wood received (tons) Wood reused (tons) Wood disposed of (tons) Minimization of natural resources (in tree) Saving in pallet purchases Rework costs Handling and stocking cost Loss from non disposal Potential of saving 2006 4,700 175 159 16 3,792 430 150 30 3 247 2007 12,600 470 415 55 8,684 990 350 52 5 583 2008 12,000 448 386 62 9,868 1120 400 60 6 654 2009 13,000 485 418 67 10,747 1220 440 65 7 708
Obs: 2008 and 2009 are estimated based on production volume
b. Reduction of the use of plastic and cardboard use in packaging
This project made possible to identify the potential for gains with the development of environmentally appropriate packaging, and changing the supply model for items that comprise the bus exhaust system. Results show that environmental gains s were equivalent to 2,300 kg/year reduction in waste at the source (cardboard: 380 kg and plastic 1920 kg), reduction in part acquisition costs, improved product quality, optimization of the physical
60
space, reduced from 100m2 to 50m2 for a gain of R$ 31.200,00 (US$ 14,512.00) per year, increased productivity, reduction in stock, organization and cleanness and improved occupational safety.
In order to achieve these objectives, the following steps were carried out: to testing the efficiency of new packages; to negotiate the development cost of packages with suppliers; to agree to sequenced supply with suppliers; to make physical arrangements to permit sequenced supply; to create a systematic to control receiving and return packages/kits; and to train and make employees awareness.
According to Bowersox (2006) supply chains imply multi-company relationship management inserted in a structure characterized by capacity limitations, information, essential skills, capital and restriction of human resources. A strategy to operationally connect a company to its clients, as well as to distribution support networks and vendors is a means to gain competitive advantage through integration from the acquisition of raw materials to product delivery to the client. CP enriches the supply chain (Harrison and Hoek, 2003) and the chain management is due to the alignment of skills both upstream and downstream of partners to deliver greater value to the final client, with a minimum cost for the entire chain (Ching, 2006).
Working with sequenced supply requires suppliers who meet objectives proposed by the receiver. By introducing the designed devices, the proposed changes eliminate packaging waste at both companies, and at the large one, they condition part uniformity for assembling buses.
The next step for improving production was to change supply that currently came in lots to sequenced supply (JIS). These proposals were adjusted with CP since they reduce space, movement and work without value; and they also reduce energy consumption, the need to build and maintain equipment and the need for physical space. According to Taylor (2005) it is imperative for the company to work in a JIT regime, so vendors can transform large shipments of materials in lots that are sent to receiving centers into just-in-time shipments arriving directly from the factory. This management demands optimization of the order-delivery-payment cycle and clearly demonstrates how basic flows can be simplified.It is important to emphasize that there is no gain in reducing packaging that has a negative intervention on the environment for condensed, smaller and more frequent deliveries, because it be harming the environment in greater intensity, due to the burning of fuels and greater
61
carbon dioxide (CO2) emissions into the air. A closer relationship with suppliers can shorten
distances and take better advantage of truck space in deliveries.
Ching (2006) indicates that a different focus on material flow (continuous flow) provides an efficient response to clients. This method began at Toyota with the JIT concept and is commonly called the “Pull” method. Harrison and Hoek (2003) calls this movement agile and lean, and it reinforces demands on total invested time, defined as the time it takes from the moment the client places an order for a product, to the moment it is delivered. Total invested time needs to be minimized to permit agility since demand is volatile and hard to predict. Therefore, besides favoring the environment, packaging reductions also led to improvements in the supply chain. These gains made it possible to change lot supply to sequenced supply, which made the flow more agile. The implementation of a device to make bus assembly items uniform, and in the case of improved packaging dimensions for roll size at the small company, made the flow more agile, leaner and implemented by the client.
The positive reflexes seen in the supply chain improved production, making it leaner, and therefore more economical and sustainable. Workers no longer needed to unpack supplied parts and separated produced waste due to the lack of better dimensioning of the supplied product, and it enabled process automation, increasing productivity by reducing production time. According to Towill (1996), an effective reduction in invested time always leads to significant improvements in financial results and manufacturing and productivity costs.
Social responsibility is an important ingredient of CP. It appears in the cited examples and finds theoretical support in several authors. Fernandes (1996) reports on the organization of work as a key factor for quality of life at work (QLW), which depends on innovations, methods and processes in the work environment that favor work groups with a variety of work tasks and rhythms. As cited by Limong-França (2003), quality of life at work is a set of actions that involve diagnoses and the implementation of managerial, technological and structural improvements and innovations both inside and outside the work environment aimed at providing optimal conditions for human development throughout work life. According to Fernandes (1996), the conditions that improve work and bring satisfaction to employees are environmental and physical (cleanliness, orderliness, safety and healthfulness) at the sites where the workers perform their functions.
Therefore, along with the awareness to implement CP, it is also necessary to improve workplace organization and offer good work conditions to employees. This aspect was taken
62
into consideration in the case under study involving the elimination of waste from packaging. Devices were introduced called returnable containers for filling parts.
3.2. Case study 2.
Based on the CP concept, we call attention to the implementation example applied at a small national industry, a manufacturer of medical products for use in hemodialysis processes. The company had forty-five employees including administrative and productive areas. It has an LP structure and ISO 9001 quality system certification with reduced production areas. It works with a manufacturing cell system, trained and multifunctional employees and small production lots.
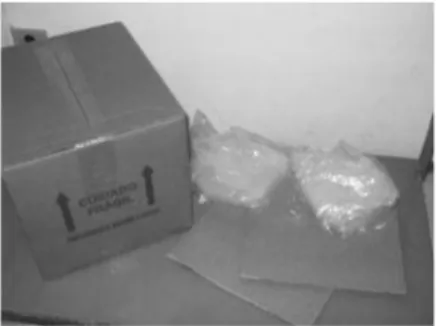
Raw material and in-process material stock areas were restricted and vertical, which makes in-process material flow and storage between phases more difficult. Plastic waste resulting from the production process was disposed of in common garbage, contributing towards pollution of the environment. The company had a production line with fifty types of products, all with their basic plastic composition, using flexible PVC tubes as their main raw material. It is supplied in rolls, packed in plastic bags and placed in a final undulated cardboard package (Figure 2). Figure 3 shows the result of the changes and the waste from excess packaging in the previous system.
Implementation of the cleaner production process emerged from the operational need and shaped a link to CP. The process was carried out by an operator who would unwind the PVC tube and introduce it into a cutting device that activated a pneumatic knife. This activity was unproductive, generated employee’s stress, and in some cases led to occupational illness,
Figure 3: Final optimized box next to excess packaging Figure 2: Internal view
after reduction in packaging
63
resulting from repetitive tasks. The adopted solution was to design and manufacture automated cutting equipment, adjusting it to production, quality and human capacity needs. No thought was given to reducing raw material waste or to the environmental impact caused by it. During the new equipment testing phase, we observed that due to the automation’s high speed, it rapidly consumed a 100-meter roll of tube. So the industry choosed to increase roll size to 300 meters. Besides reducing machine feeding and set-up cycles, this decision unexpectedly provided a reduction in packaging inputs used in the previous configuration, that is, before a box of tube contained three 100-meter rolls, with each roll packed in a polyethylene bag.
There were two undulated cardboard dividers between the three rolls in the package, and the entire set was wrapped in a fourth bag and placed in a final cardboard box. Altogether, this resulted in four polyethylene bags, two dividers and a cardboard box. In order to adjust to this new supply, the existing excesses were eliminated (Figure 3).
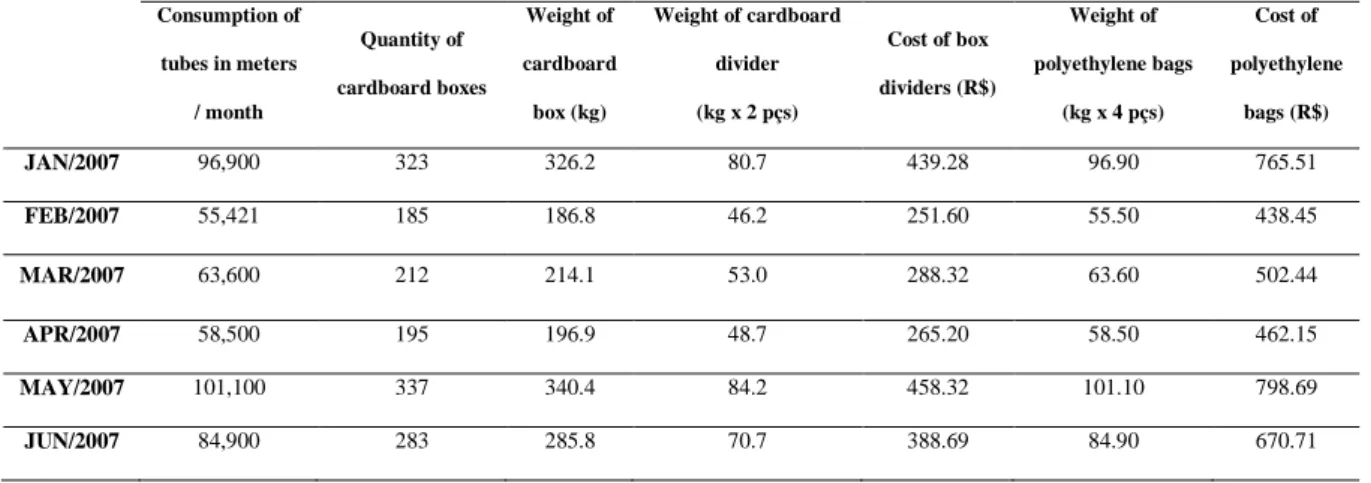
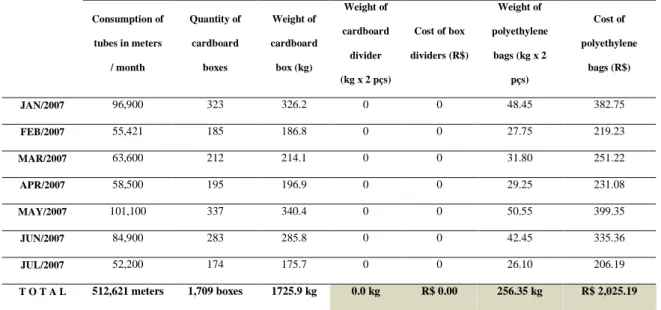
After the process change the results obtained, based on the first semester or 2007 were analyzed and compared before implementation (Table 4), and after Cleaner Production (Table 5). It was found that reductions in cardboard disposal added 427 kg, representing a value of R$ 2,328.05 (US$ 1,082.50). The most significant reduction was in the polyethylene bag, which was one of the largest pollutants in this study. It represented a disposal reduction of 256.35 kg and R$2,025.19 (US$ 942.00). Altogether, there was a total savings in packaging expenses of R$4,353.19 (US$ 2,025.00) in the semester, representing 68.25% in packaging cost. Tables 4 and 5 allow the comparison of the situation prior to implementation of the project and afterwards.
Table 4: Financial and environmental results at the small company - situation "before" CP. Consumption of tubes in meters / month Quantity of cardboard boxes Weight of cardboard box (kg) Weight of cardboard divider (kg x 2 pçs) Cost of box dividers (R$) Weight of polyethylene bags (kg x 4 pçs) Cost of polyethylene bags (R$) JAN/2007 96,900 323 326.2 80.7 439.28 96.90 765.51 FEB/2007 55,421 185 186.8 46.2 251.60 55.50 438.45 MAR/2007 63,600 212 214.1 53.0 288.32 63.60 502.44 APR/2007 58,500 195 196.9 48.7 265.20 58.50 462.15 MAY/2007 101,100 337 340.4 84.2 458.32 101.10 798.69 JUN/2007 84,900 283 285.8 70.7 388.69 84.90 670.71
64 JUL/2007 52,200 174 175.7 43.5 236.64 52.20 412.38 T O T A L 512,621 meters 1,709 boxes 1,725.9 kg 427.0 kg R$ 2,328.05 512.70 kg R$ 4,050.33
The case study showed that it is possible to significantly improve other areas that go beyond the manufacturing process. The manager’s vision must go beyond what has been obtained. Continuous improvement must be applied first of all on behalf of the environment. Raw material and process alternatives must be explored.
CP can be considered an extension of LP, when the need to take into account a material project and disposal of products at the end of life cycle is included. However, a series of aspects are conceptually common to both management processes, as considered by Taiichi Ohno, the Toyota chief engineer considered the inventor of LP, who proved to be a fierce critic of any sort of waste. He listed seven wastes and conducted detailed studies in order to create correction mechanisms. The seven wastes consist of: 1 –overproduction; 2 –waiting for the next processing step; 3 – unnecessary transportation of materials; 4 – inappropriate processing; 5 – stocks above absolute limit; 6 – unnecessary movement of employees during the course of work and 7 – production of defective parts.
Table 5: Financial and environmental results at the small company - situation "before" CP.
We see that “company efficiency, profitability and competitiveness” are part of the seven wastes listed by Ohno for LP that must be avoided. The important novelty is the expansion of the concept by explicitly stating “while protecting the environment, consumer and worker"
Consumption of tubes in meters / month Quantity of cardboard boxes Weight of cardboard box (kg) Weight of cardboard divider (kg x 2 pçs) Cost of box dividers (R$) Weight of polyethylene bags (kg x 2 pçs) Cost of polyethylene bags (R$) JAN/2007 96,900 323 326.2 0 0 48.45 382.75 FEB/2007 55,421 185 186.8 0 0 27.75 219.23 MAR/2007 63,600 212 214.1 0 0 31.80 251.22 APR/2007 58,500 195 196.9 0 0 29.25 231.08 MAY/2007 101,100 337 340.4 0 0 50.55 399.35 JUN/2007 84,900 283 285.8 0 0 42.45 335.36 JUL/2007 52,200 174 175.7 0 0 26.10 206.19 T O T A L 512,621 meters 1,709 boxes 1725.9 kg 0.0 kg R$ 0.00 256.35 kg R$ 2,025.19
65
(Giannetti and Almeida, 2006), indicating that companies that adopted LP principles in their production system are much closer to carrying out Cleaner Production applications. The Toyota production system example is known as Lean Production, and this concept spead to the main competitors in world’s market. Different from traditional industrial organizations where interest was in economic feasibility and profitability, LP’s proposal gained broad-based scope by using content, values and principles of quality theories, logistics and the Balanced Scorecard (BSC) (Kaplan and Norton, 1997).
Suppliers’ chain effectiveness; the adoption of just-in-time; stock reduction, resource consumption; reduction of machine time, factory cleanness and organization; protection and valorization of the worker and his/her work; respect and to meet the consumer will; establishment of improved relations among companies, are among the many LP fragments present in practically every organized sector of production. Initiatives for implementing CP are made easier when the company has a history of LP use. Innovations caused by good management and actions towards LP may promote the knowledge of competitive advantages with waste reduction, productivity increases and the assimilation of modern equipment and technologies and control tools.
Bicheno (2004) emphasizes the toolbox for lean production, which has been applied in the project and can be summarized such as the use of the following concepts: Kaizen (continuous incremental improvement through low-cost optimizations, Vais et al. (2006); 5S (a shop floor exercise in order to create order by sorting, simplifying, sweeping, standardizing and sustaining. Vais et al., 2006; Thrane et al., 2009); Total Productive Maintenance (to ensure that every machine in a production line is always able to perform its required tasks so that production is not interrupted); Celular Manufacturing (layout of machinery of different types to perform operations in a tight sequence to minimize transport and waiting time); Just –in-time Production (the ultimate goal for optimizing the value chain); Six Sigma (process improvement through minimization of variances, Vais et al., 2006); 3R (reuse and recycle to become Lean and Green); Total Quality Management (with the focus on processes that lead to improvements in quality of product, environment and occupational health and safety practices); and Lean Enterprise Supplier Network (environmentally sustainable (green) supply chain management, Hoek and Erasmus, 2000).
In a broad sense LP implementation costs are not always affordable for the small company, except, when in partnership with a large company. However, even without a history of LP,
66
small and large companies can initiate incremental and localized CP programs, without the need for large financial investments. In the large company, improvements began in the supply chain. Parts began to be delivered in a sort of clothesline device, eliminating the need for individual packaging, and wooden crates that result from imports were converted into pallets prepared for exports. This permitted an improved product flow plan and adoption of just-in-sequence (JIS) focused on the Pull strategy, which means the product is pulled by the client rather than supplied in lots, without component uniformity. At the medical material company, after eliminating unnecessary packaging disposed of in common garbage, a request was made for the vendor to deliver material in 300-meter rolls of PVC pipe, rather than the 100-meter rolls. The 300-meter rolls occupy the entire internal dimension of the box, eliminating excess packaging. This change in roll size brought improvements in the pipe cutting process by reducing setups, and what used to be a manual process became automated. As a consequence, there was an improvement in product flow, promoting production in small and sequenced lots. The theoretical basis that supports this affirmation is shown below. For such, different factors that intervene in the flow will be addressed.
3.3. General MIF evaluation
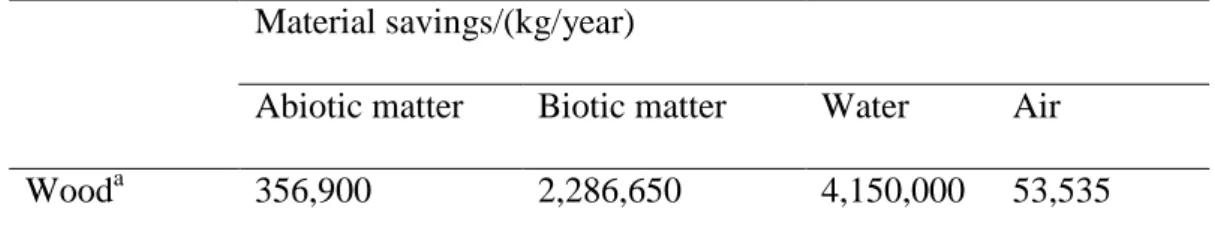
Relatively small quantities of materials saved within the companies (wood within the automotive company and cardboard and plastic within the small one) led to preservation on a global level (Tables 6 and 7). In the case of the automotive company, savings of 415 ton of wood from pallets resulted in approximately 2287 ton of matter at the biotic level, as well as 4150 ton at the water compartment. In a similar way, the small company presents savings of 427 kg of cardboard and 256 kg of polyethylene bags, which represents approximately 1,566 kg matter in abiotic and 82,932 kg in water compartments (Ritthooff et al., 2008).
Table 6: Material savings due to pallet reuse in the large company during the 2007 year.
Material savings/(kg/year)
Abiotic matter Biotic matter Water Air
Wooda 356,900 2,286,650 4,150,000 53,535
a
67 Table 7: Material savings in the small company due to elimination of excess packaging during the first half of 2007.
Material savings/(kg/6 months)
Abiotic matter Biotic matter Water Air
Paper 794.2 320.3 39,967.2 138.8
Plastic 771.6 42,964.3 471.7
Considering the financial benefits during a year (2007) for the automotive company and during a period of six months for the small medical supply company, the ratio (material saved/money saved) was calculated. This ratio represents an indicator of mixed nature, since it comprises a division between numbers derived from a receiver-type metric (financial resource) and a donor-type metric (MI). The ratio varied depending on the situation. In this way, each real (R$) saved within the automotive company represented a saving of 0.71 kg in terms of wood, while the small company needed to save only 0.16 kg of material (considered as cardboard and polyethylene) in order to obtain the same benefit of 1 R$ (US$ 0.47).
When the evaluation was carried out in global terms, the small company has a greater economy in material resources (19.6 kg) for each real saved with the cleaner production intervention. The value of 19.6 kg was obtained considering the sum of mass from Table 7 divided by the money saved (R$4.353,20; US$ 2,025.00). On the other hand, the large company saved 11.7 kg of global material for each real saved.
4. Conclusions
Environmental management practices can be implemented in every phase of the production cycle regardless of company size. It is possible to establish goals to reduce waste generation in a small company, which today is an important part of the overall production processes. Companies should be structured to seek adjustments in their processes, identifying existing products that could be improved and production cycle phases that could adjust to environmentally acceptable criteria.
Cleaner Production concepts do not only apply to the company’s factory. Often, the participation of suppliers is fundamental to obtain the expected result. Globalization and competitiveness have universal trends, leading to a chain reaction so that somehow companies
68
that produce have similar behavior in their processes. Many Brazilian industries have foreign participation in their capital or are responsible for exporting components or consumer goods, and the acceptance on the global market enables the revision of sustainable development concepts.
There is much to be done to prevent ecosystems degradation and to recognize this need already seems to be an important step within present economic-financial context. It is necessary to encourage programs directed towards energy efficiency so Brazilian companies adopt the dissemination of a new environmental awareness that preserves the environment and provides economic advantages.
Environmental benefits could be assessed by using proper methodology. This reducing waste policy adopted by the large company was extended to its suppliers and led to an important reduction the environmental impact.
8. Acknowledgements
The authors wish to thank Prof. Dr. Silvia Bonilla and Dr. Cecilia M.V.B. Almeida, from the Paulista University Cleaner Production team, for their contributions and suggestions to the elaboration of this paper.
9. References
BICHENO, J. The new Lean toolbox towards fast, flexible flow. Buckingham: Picsie Books, p. 212, 2004.
BOWERSOX, D.J. Gestão de Logística e cadeia de suprimentos. Porto Alegre: Bookman, p.21-376, 2006.
CHING, H. Y. Gestão de estoques na cadeia de logística integrada – Supply chain. São Paulo: Atlas, p. 38-69, 2006.
DALY, H.E. Toward some operational principles of sustainability. Ecological Economics, v. 2, p. 1–6, 1990.
FERNANDES, E. C. Qualidade de Vida no trabalho. Salvador: Casa da Qualidade, p.21-30, 1996.
FRANÇA, A. C. L. Qualidade de Vida no trabalho: conceitos e práticas nas empresas da sociedade pós-industrial. São Paulo: Atlas, p.19-80, 2003.
GIANNETTI, B. F., ALMEIDA, C. M. V. B. Ecologia industrial: conceitos, ferramentas e aplicações. São Paulo: Edgard Blucher, p.3-18, 2006.
69
GIANNETTI, B. F., BONILLA, S. H., SILVA, I. R., ALMEIDA, CMVB. Cleaner production practices in a médium size gold-plated jewelery company in Brazil. Journal of Cleaner Production, v. 16, p. 1106- 1117, 2008.
HARRISON, A., HOEK, V. R. Logistics Management and Strategy. New York: Prentice Hall, p.187-260, 2005.
IBGE - Instituto Brasileiro de Geografia e Estatistica, Available at: http://www.ibge.gov.br/english/. [accessed on March 17], 2008.
HOEK, R.I., ERASMUS. From reversed logistics to green supply chains. Logistics Solutions Issue, v. 5, p. 28-33, 2000.
IBPS - Instituto Brasileiro de Produção Sustentável e Direito Ambiental. Availabe at: http://www.ibps.com.br/index.asp?idmenu=&Idnoticia=2566. [Accessed on August 11, 2007].
KAPLAN, ROBERT S; NORTON, DAVID P. A estratégia em ação: balanced scorecard.
16ed. Rio de Janeiro: Campus, p. 283-306, 1997.
MONDEN, Y. Toyota Production System: An Integrated Approach to just-in-time, Engineering and Management Press, Norcross, p.479, 1997.
MARTINS, P.G, LAUGENI. F.P. Administração da Produção. São Paulo: Saraiva, p. 303-313, 2002.
MOREIRA, D.A. Medida de Produtividade na empresa moderna. São Paulo: Pioneira, p.152, 1991.
NEVENS, F., DESSEIN, J., MEUL, M., ROGGE, E., VERBRUGGEN, I., MULIER, A., PASSEL, S.V., LEPOUTRE,J., HONGENAERT, M. On tomorrow’s grounds, Flemish agriculture in 2030: a case of participatory translation of sustainability principles into a vision for the future. Journal of Clean Production, v.16, p. 1062-1070, 2008.
PORTER, M. E., VAN DER LINDE, C. Green and competitive: ending the stalemate. Harvard Business Review, vol.73, n.º 5, September–October, p. 122–34, 1995.
REDE BRASILEIRA DE PRODUÇÃO MAIS LIMPA. Available at
http://www.pmaisl.com.br/mambo/index.php?option=com_content&task=view&id=8&Itemid =1. [accessed onAugust11, 2007].
ROTHENBERG, S. “Knowledge content and worker participation in environmental management at NUMMI”, Journal of Management Studies, vol.40, nº 7, p.1783-1802, 2003. BNDES. Setorial do BNDES, no 10, p. 253/268, Rio de Janeiro, 1999.
RITTHOOFF, M., ROHN, H., LIEDTKE, C. Calculating MIPS – Resource productivity of products and services. Calculating MIPs, resources productivity of products and services. Available from: http://www.wupperinst.org/uploads/tx_wiberitrag/MIT_v2.pdf; [accessed on April 12, 2008].
SENAI. RS. Implementação de Programas de Produção mais Limpa. Porto Alegre, Centro Nacional de Tecnologias Limpas SENA-RS/UNIDO/INEP, 2003.
SIMPSON, D.F., POWER, D.F. Use the supply relationship to develop lean and green suppliers. Supply Chain Mangement: An International Journal, Australia: Emerald Group Publishing Limited, v.3, p. 63-65, 2005.
70
TAYLOR, D. A. Logística na cadeia de suprimentos: uma perspectiva gerencial. São Paulo: Pearson Addison-Wesley, p.41-44, 2005.
TEMPLET, P. H. Grazing the commons: externalities, subsidies and economic development. Ecological Economics, v. 12, p. 141–59, 1995.
TEMPLET, P. H. Energy, diversity and development in economic systems: an empirical analysis. Ecological Economics, v. 30, p. 223–33, 1999.
TEMPLET, P. H. Energy price disparity and public welfare. Ecological Economics, v. 36, p. 443–60, 2001.
TOWIL, D.R. Time compression and Supply Management: A guided tour, Supply Chain Management, v. 4, p.15-27, 1996.
THRANE, M., NIELSEN, E.H., CHRISTENSEN, P. Clean Production in Danish fish processing – experiences, status and possible future strategies. Journal of Clean Production, v.17, p. 380-390, 2009.
VAIS, A., MIRON, V., PEDERSEN, M., FOLKE, J. Lean and Green at a Romanian secondary tissue paper and board mill – putting theory into practice. Resouces Conservation & Recicling,v.46 (1), p. 51-53, 2006.
WOMACK, J. P., JONES. D.T. A mentalidade enxuta nas empresas: elimine o desperdício e crie riqueza. Rio de Janeiro: Elsevier, p.3, 2004.
WOMACK, J. P., JONES. D.T., ROOS,D. A máquina que mudou o mundo. Rio de Janeiro: Campus, p.1-39, 1992.
WUPPERTAL INSTITUTE. Table of Material intensity of materials, fuels and transport services. Version 2. 2003. Available from:
http://www.wupperinst.org/uploads/tx_wibeitrag/MIT_v2.pdf. [accessed on April, 14, 2008].