Education and income in civil construction and industry in Brazil between
2002 and 2013
Educação e renda na contrução civil e na indústria brasileira entre 2002 e 2013
DOI:10.34117/bjdv6n5-096
Recebimento dos originais: 10/04/2020 Aceitação para publicação: 07/05/2020
Diogo Ferraz
Economist. PhD in Industrial Engineering at EESC/USP. Professor at the Department of Business Administration at the Federal Rural University of Amazonia (UFRA). PA-275 s/n Zona Rural,
Parauapebas - PA, 68515-000. ]E-mail: diogoferraz@alumni.usp.br
Naijela Silveira
Engineer. PhD in Industrial Engineering at UFSCar. Av. Armando Giassetti, 577 - Vila Hortolândia - Trevo Itu/Itatiba Jundiaí - SP.
Email: naijela.silveira@docente.unip.br
Eduardo Polloni Silva
Engineer. PhD candidate in Industrial Engineering at UFSCar. Rod. Washington Luís – Km 235 CEP 13565-905, São Carlos/SP/Brasil.
Email: eduardopolloni1@gmail.com
Leônidas Pompeu Leão Velloso
Engineer. Doctor of Economics at UFPA. Professor at the Federal Rural University of Amazonia (UFRA). PA-275 s/n Zona Rural, Parauapebas - PA, 68515-000.
E-mail: leonidas.velloso@ufra.edu.br
Diego Scarpa Mello
Master in Industrial Engineering at UFSCar. Rod. Washington Luís – Km 235 CEP 13565-905, São Carlos/SP/Brasil.
Email: dscarpa.mello@gmail.com
Fabíola Cristina Ribeiro de Oliveira
Economist. PhD in Applied Economics at ESALQ/USP. Professor at the Pontifícia Universidade Católica de Campinas. Rua Professor Dr. Euryclides de Jesus Zerbini, 1516 - Parque Rural Fazenda
Santa Cândida, Campinas - SP, 13087-571. E-mail: fbcoliveira@hotmail.com
ABSTRACT
In 2015, the Federal Government launched the slogan "Brasil Pátria Educadora", placing education as a driving force behind the development of the nation. The contribution of this paper was to estimate educational rates of return for the Industry and Construction Sector from 2002 to 2013 and wage differentiation by gender, race, and geographic region. The Human Capital Theory and educational rates of return presented themselves as an appropriate theoretical framework. The proposed method was earnings equations with polygonal adjustment for education. Using the National Household Sample Survey – PNAD/IBGE, it was observed that educational returns in Construction Sector are higher than in Industry. Another significant result was the asymmetry of the educational return. In
Construction, individuals with eight years of schooling or more receive five times more than workers with less education. In Industry, this proportion is three times higher for individuals with eleven years of study or more. This work confirms the understanding that education remained among the variables that contributed most to the increase in income, and educational inequality is translated into the income gap in the labor market.
Keywords: Education; Income; Civil Construction; Industry; Human Capital Theory. RESUMO
Em 2015, o Governo Federal lançou o slogan "Brasil Pátria Educadora", colocando a educação como força motriz por trás do desenvolvimento da nação. A contribuição deste trabalho foi estimar as taxas de retorno educacional para o setor de indústria e construção de 2002 a 2013 e a diferenciação salarial por gênero, raça e região geográfica. A teoria do capital humano e as taxas de retorno educacional apresentaram-se como um arcabouço teórico adequado. O método proposto foi a equação de ganhos com ajuste poligonal para a educação. Utilizando a Pesquisa Nacional por Amostra de Domicílios - PNAD / IBGE, observou-se que os retornos educacionais no setor de construção são superiores aos da indústria. Outro resultado significativo foi a assimetria do retorno educacional. Na construção, indivíduos com oito anos de estudo ou mais recebem cinco vezes mais do que trabalhadores com menos escolaridade. Na indústria, essa proporção é três vezes maior para indivíduos com onze anos de estudo ou mais. Este trabalho confirma o entendimento de que a educação permaneceu entre as variáveis que mais contribuíram para o aumento da renda, e a desigualdade educacional se traduz na diferença de renda no mercado de trabalho.
Palavras chave: Educação; Renda; Contrução civil; Indústria; Teoria do Capital Humano. 1 INTRODUCTION
Education is valued worldwide. Countries that have managed to develop socially and economically have invested in quality education. There is no evidence that more education generates less income. For this reason, education provides a reduction in income and opportunity inequality. For Piketty (2014, p. 27), education acts as a convergence force for the reduction of income inequality, although other forces act on the determination of income levels.
In contemporary society, technology and education are directly proportional. Education facilitates the use and absorption of new technologies, generating higher productivity, and providing better critical analysis in unsafe environments and decision making. In this context, public investment in education is paramount to increase the chance of citizens remaining in the labor market.
The contribution of this article is to estimate the educational returns for Civil Construction and Industry between 2002 and 2013 in Brazil. The importance of the theme is due to the economic position that the nation has, as it is among the ten largest economies in the world, in terms of the value of the Gross Domestic Product - GDP, although it has presented relatively small growth rates in recent years and the prospect of recession. For 2015. Besides, recent studies (SOARES, 2006; BARROS et al., 2007; IPEA, 2006; HOFFMANN, 2009) show a substantial reduction in the inequality of income distribution among employed people in Brazil, which in 2007 had already
reached the lowest level in the last 30 years. The achievement of economic stability and the universalization of primary education in the 1990s provided the basis for the expansion of social programs, starting in the 2000s. However, the process of sustained economic development has not been strengthened, either by internal issues or by the international scenario.
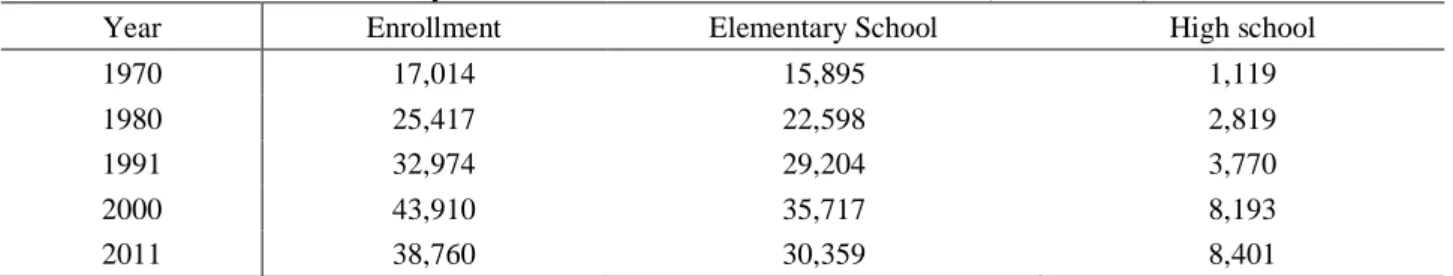
Nevertheless, in the last three decades, there has been some improvement in the Brazilian educational system. Table 1 shows the expansion of enrollments so that in 2011 this number grew approximately 2.3 times in comparison to 1970.
Table 1- Evolution of enrollments by the level of education. Brazil, 1970 to 2006 (in thousands)
Year Enrollment Elementary School High school
1970 17,014 15,895 1,119
1980 25,417 22,598 2,819
1991 32,974 29,204 3,770
2000 43,910 35,717 8,193
2011 38,760 30,359 8,401
Source: Prepared by the authors based on data from INEP (2013)
Although there has been a significant evolution, education has grown asymmetrically, following the characteristics of socioeconomic development and inequalities in the country. While in 1970, the average years of study were higher in the Southeast (3.2) and South (2.7) compared to the Northeast (1.3), in 2013, despite the approximation between the averages and the increase in the indicator, the Southeast (8.1), Midwest (7.8) and South (7.7) regions remain ahead of the Northeast (6.0) and North (6.7) (PNAD, 2013). However, it is not within the scope of this article to discuss the quality of Brazilian public education.
The fact is that the sustainability of socio-economic development is directly related to the speed and continuity of the educational expansion process (BARROS et al., 2002, p. 1). Note that, according to Barros et al. (2002) this direct association is established from two different transmission routes, namely: i) the educational expansion increases labor productivity, contributing to economic growth, increasing wages and reducing poverty; ii) educational expansion can imply greater equality and social mobility, as the condition of “non-transferable asset” makes education an easier distribution asset than most physical assets. Added to this is the fact that education is an asset that can be reproduced and is generally offered to the poor population through the public sphere. This time, it is believed, following the authors above, that educational expansion is essential to continue fostering economic growth and to continue the processes of reducing economic and social inequalities and poverty.
According to Barros et al. (2002), Brazil, in 1970, was already a country with a moderate level of education. Having expanded its educational system very slowly since then, Brazil ended up intensifying its shortage of qualified workers, which can contribute to the maintenance of wage inequality problems in the country, in different sectors of activities.
The civil construction sector, for example, has always been one of the only ones that hired unskilled labor, even employing illiterates. In the most recent periods, this reality has changed somewhat, as there has been a need to employ people with higher qualification levels. However, due to the deficit of this more educated and qualified workforce, the sector has presented difficulties for the introduction of new technologies (DECONCIC, 2008).
The industrial sector, in turn, by facing technological advances and low productivity in comparison to the international scenario, signaled new investments in human capital and research and development, in order to increase the competitiveness of the production chain and to generate better jobs. If, on one hand, these two sectors are differentiated by the type of market formalization (with or without a formal contract) and the educational level required by labor, on the other, the lack of qualified labor has affected both civil construction and industry.
Economic Science has contributed significantly to empirical estimates of the impact of education on workers' incomes and the country's economic development. Many things have indeed been put in doubt, especially in the field of econometrics. However, in addition to the fact that this field is the only one that empirically estimates the educational contribution in people's lives, econometrics has evolved rapidly, and new methods have been employed.
This paper aims to discuss the importance of education for the level of income of Brazilian workers. For this, the Human Capital Theory and the rates of return previously estimated were revised, through national and international articles. Because of the above, it is believed that it is important to question the role of education in people's income. More specifically, this paper aims to show the impact of education on the average salary of employees (formal and informal) in the construction and industrial sectors. Faced with this challenging scenario of low economic growth, the relevance of the theme is justified in order to contribute to overcoming poverty and the inequalities that persist in Brazil.
Not coincidentally, the discussion about the importance of education about economic development has become a national theme just when the economy has undergone major social changes in the reduction of poverty and income inequality. However, the current situation shows resentment to the model implicitly based on the distribution of resources to the less favored layers and countercyclical economic policies. For a country that is growing and modernizing, education plays a major role in national planning, alongside other social and development policies. As is already
known, educational inequalities are translated into income inequalities in the labor market, which again confirms the importance of education in the lives of people worldwide.
Recent popular demonstrations spread across Brazil exhibit discontent with politics, including education. However, it seems that a good part of the Brazilian people is not sure what to demand from politicians about the education system. There is a need for a strategic educational policy inserted in economic planning to eliminate poverty and make this scenario sustainable. A rich country is not just a country without poverty, but Brazil, with quality education and available human capital. Education has a lot to contribute to this scenario.
2 METHOD
The methodology of this work was based on two stages. In the first stage, explanatory research was carried out, such as bibliographic consultations on literature in the fields of Human Capital Theory and in studies that estimate Educational Return Rates. National and international scientific articles, books, dissertations, and theses specialized in the subject were used.
For the development of the second stage, PNADs microdata from 2002 to 2013 was used to estimate income equations for people whose position in the occupation is that of employees (salaried workers) in the fields of activity of Civil Construction and Industry, with a value of positive primary job income. Indigenous people and people without information on age, education, position in occupation, color, a condition in the family, and workers with weekly time in the main occupation not informed or less than 15 hours were excluded.
The Income Equation, using multiple regression statistics, relates a dependent variable, in this case, the Neperian logarithm of each person's work income, with explanatory variables linked to the characteristics of each individual (education, color, sex, age, being or non-reference of the family, living in the rural or urban area) and work (region, federation unit, usual weekly hours worked) in addition to the minimum wage (MENEZES-FILHO, 2002; OLIVEIRA e HOFFMANN, 2011).
Regarding the relation of the Neperian logarithm wage (lw) as dependent on an observable variable, and it is admitted that the relation is log-linear and equal for all individuals. Using the weight of each person in the sample as an expansion factor, and adding all the independent variables of the model, an equation is obtained where α and βi are parameters of the model and εit is the random error that represents the effect of the variables not estimated in the model, with usual statistical properties and with the treatment of heteroscedasticity, we have the following model adjusted by the weighted least squares method:
) 1 ( ) ( = +
+ i ij ij i j x lw
The following explanatory variables are considered:
a) A binary variable for gender (SX), based on female gender (0) and value 1 for the male gender.
b) The person's age (ID), measured by decades.
c) The square of the age variable (ID²), considering that income does not vary linearly with age.
d) The individual's education (ESC), which ranges from 0 (a person without education or with less than one year of study) to 9 years of study and, assumes value 17 for a person with 15 years or more of education. Hoffmann and Ney (2004) and Hoffmann and Simão (2005), in order to verify the impact of schooling on income after a certain level, considered the relationship between variables as a polygonal function. Therefore, in addition to the variable, the variable Ε = Ζ j (Ε j – δ), where δ is the apex abscissa, that is, it is the schooling from which the rate of return becomes higher, and Ζ j is a binary variable such that Ζ j = 0 for Ε j ≤ δ and Ζ j = 1 for Ε j > δ. The education variable (ESC) is related to the logarithm of income (lw) in polygonal form, whose apex has abscissa Ε = 8 for Civil Construction and Ε = 11 for the Industrial sector.
e) Two binary variables for color (COLOR) of the person, being white, black, or brown and yellow base.
f) A binary variable to distinguish the individual's condition in the family (CFAM), being a reference person (base) versus a category that includes all other conditions (spouse, child, other relatives, householder, pensioner).
g) Four binary variables were defined for the Midwest, Southeast (excluding São Paulo), South and North regions, and one binary variable for the State of São Paulo, based on the Northeast region.
h) A binary variable to distinguish the home area (UK): urban (base) and rural.
i) This model estimates four binary variables of the weekly hours usually worked (CHT), even knowing that the logarithm of the number of hours worked per week, that is, the elasticity of income concerning the weekly time of work would be a coefficient of best adjustment, the for future research proposals.
j) A binary was used to distinguish whether the job is without a formal contract or with a formal contract (base).
k) To assess the effect of institutional factors on wages, regressions were estimated grouping the years 2002 to 2013, using the real value of the minimum wage (SMR) as an explanatory variable, measured in hundreds of reais (SMR / 100), just so that the number was not inconveniently small.
l) A binary variable to estimate the effect of the minimum wage and its interaction with the position in the occupation (employee with a license and one without a license) (SMR / 100 * PO), basis: employee without a license.
The model was adjusted in order to verify the differences in the job market, through the interaction between qualification and experience (education and age); discrimination by gender and race of equally productive workers (color and sex); locative segmentation (federation units), with different remunerations for workers, without any explicit or tangible criteria.
3 RESULTS AND DISCUSSION
3.1 EDUCATION AND THE DETERMINANTS OF INCOME
Since Adam Smith (1776), education was recognized as a significant factor in the development of a nation. Through the econometric research of Theodor Schultz (1961), Jacob Mincer (1974), and Gary Becker (1994), the discussion of the impact of education on people's incomes was established and the development of the so-called Human Capital Theory began.
According to Schultz (1961), investment in human capital expands the possibilities of individuals, in addition to providing gains in income, health, quality of life, productivity, and promoting economic development, as in the case of technically developed countries. This type of investment produces long-term returns through formal education, professional qualification, and training within companies. The author points out that investments in human beings cannot be commercialized, as they become part of the individual himself. Income occurs through contact between individuals and the job market.
Mincer (1974) contributed to economic theory by estimating the impact of years of study and experience on income, inserting a quadratic term for experience, and estimating the concave shape of the experience-age curve. According to the Mincerian equation, there is a positive and linear correlation between education and workers' income. If countries' growth is conditioned by educational abundance and other variables, the quantum of human capital, technology, and productivity that the nation enjoys defines the dynamics of wealth growth, whether at high rates or by stagnation and low levels of income (BECKER, 1994). Therefore, the accumulation of human capital in the modern world promotes the development of research and technology, in addition to attracting new investments to the country.
There has been considerable evolution in the Human Capital Theory since the 1960s. Even Mincer (1974) has analyzed the limits of empirical analysis on investment and human capital because it is based only on the number of years of study. The author pointed out that the difficulty of
explanation in the first models of education does not cast doubt on the relevance of the analysis of human capital, as it presents only an incomplete specification, which must be inserted into other behavioral variables. When analyzing the logarithm of men's income by groups of years of experience, Mincer (1974) increased the coefficient of determination from 7% to 33%. Thus, it was agreed to use age minus years of schooling, assuming that the worker enters the labor market right after school completion1.
If the level of education is an essential factor for the development of the human being, modern society and its many technological advances place education at the dynamic center of the life of economic agents. The higher the degree of technological advances, the greater the importance of education, which facilitates the use and absorption of new technologies, increases productivity, and provides better critical analysis in unsafe environments and decision-making.
Langoni's (1973) study used the 1960 and 1970 Demographic Censuses and associated inequality and schooling for Brazil. According to the author, the group with higher schooling obtained higher salaries and a higher expected rate of return on investments in education. While the Economically Active Population - PEA with primary education increased their participation in income by only 5%, collegiate education increased by 96% and university students by 99% concerning participation in total income. These data demonstrate that technological advances in the Brazilian economy have relatively benefited the highest levels of education.
A movement to reduce inequality in income distribution is an investment in human capital, especially in countries with a high rate of educational return. In the words of Hoffmann (2001), “the accelerated increase in schooling is a strategy that would lead to economic growth with less inequality”. The author also defends the positive correlation between education and worker income, in addition to better citizen participation in modern societies via the educational system.
3.2 RETURN RATES TO EDUCATION IN BRAZIL
The literature on educational returns has been extensively researched and sometimes has a discrepancy in estimates. The methodology and database to be considered to impact the contribution of education to workers' income. The availability of educational resources is linked to investment in physical and human capital, which need rates of return that make up the opportunity cost of the service (BARROS et al., 2001). In this regard, estimating rates of return on education (in) makes public and private investments feasible according to (low) high rates of return to citizens and society. By detecting educational returns, the distribution of income that depends on the distribution of schooling
is explained. As stated by Barros et al. (2007), the speed of growth of the average schooling reaches the reduction of the school and income inequality2.
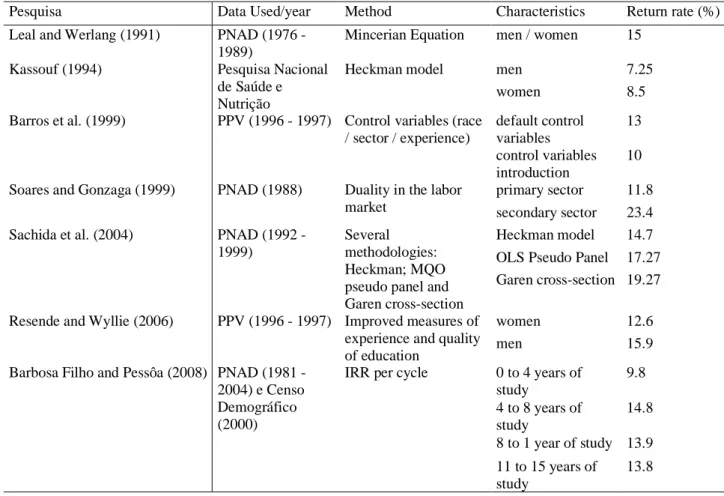
The history of educational return in Brazil has always been high. Leal and Werlang (1991) estimated rates of return through PNAD (1976 to 1989), using the mincerian equation and found high returns in the order of 15% or more3. On the other hand, Soares and Gonzaga (1999) worked with the issue of duality in the labor market, between the primary sector, characterized by better quality jobs, and secondary, less prestigious occupations, through PNAD (1988). The authors estimated educational return rates of 11.8% for the secondary sector and 23.4% for the primary sector.
Menezes-Filho (2002) estimates that in Brazil in 1977, by eliminating educational inequalities, wage inequality would be 50% lower. The gains associated with education declined from 17% (1977) to 14% (1997), which can be explained by the increase in people with primary and secondary education, and the decrease in school inequality in higher education. It is interesting to note that the same occurred in the United States when the rate of educational return increased in the 1960s, reached the lowest level in the 1970s (4%), and recovered in the 1980s (12%) (MINCER, 1974).
The line of research presented by Leal and Werlang (1991) is limited to the question of sample selectivity. Kasouf (1994) advances when estimating models using the methodology proposed by Heckman (1974, 1979). The author uses the 1989 National Health and Nutrition Survey and estimates income equations for the logarithm of hourly wages for men and women, taking into account whether or not the sample has an income for the period. When applying the method of sample selectivity4, the
rate of return found was 7.25% for men and 8.5% for women.
The possibility of using the PNAD-IBGE and methods such as Ordinary Least Square - MQO, Heckman, Garen - cross-section, and pseudo panel were studied by Sachida et al. (2004). The authors found different rates of return for the period 1992 to 1999. For men with 12 years of study, the return varied from 14.7% (Heckman cross-section) to 17.27% (MQO pseudo panel) and 19, 27% (Garen cross-section).
The multiple regression statistical technique allows verifying if the differences in the wage formation process can be explained by a set of characteristics of the person (sex, age, education, color) and work (region, working time, and sector of activity). Using the microdata from the National
2 Barros et al. (2007) estimates that between 2001 and 2005, changes in schooling determined 40% of the fall in inequality
in pay for work and 20% in the reduction of inequality in family income per capita.
3 Leal and Werlang (1991) obtained average educational returns between 1986/89 for: primary 1 / illiterate (16.38%);
primary 2 / primary 1 (8.45%); secondary / primary 2 (16.85%) and higher / secondary (15.64%).
4 The introduction of the sample selectivity methodology takes into account only individuals with positive income, better
Household Sample Survey - PNAD, this work estimates equations where the dependent variable is the logarithm of each individual's primary job income and those characteristics of that person, their job, and an institutional factor such as years of schooling are the explanatory variables. Along the same lines as Arbache (2000), studies on wage differentials can contribute to the configuration of public policies aimed at more significant and better employability, improving income distribution, and reducing regional inequalities. Table 2 summarizes the primary educational return rates studied.
Table 2 - Rates of educational return. Brazil, 1976 to 2004
Pesquisa Data Used/year Method Characteristics Return rate (%)
Leal and Werlang (1991) PNAD (1976 - 1989)
Mincerian Equation men / women 15 Kassouf (1994) Pesquisa Nacional
de Saúde e Nutrição
Heckman model men 7.25
women 8.5
Barros et al. (1999) PPV (1996 - 1997) Control variables (race / sector / experience) default control variables 13 control variables introduction 10 Soares and Gonzaga (1999) PNAD (1988) Duality in the labor
market
primary sector 11.8 secondary sector 23.4 Sachida et al. (2004) PNAD (1992 -
1999)
Several methodologies: Heckman; MQO pseudo panel and Garen cross-section
Heckman model 14.7 OLS Pseudo Panel 17.27 Garen cross-section 19.27 Resende and Wyllie (2006) PPV (1996 - 1997) Improved measures of
experience and quality of education
women 12.6
men 15.9
Barbosa Filho and Pessôa (2008) PNAD (1981 - 2004) e Censo Demográfico (2000)
IRR per cycle 0 to 4 years of study 9.8 4 to 8 years of study 14.8 8 to 1 year of study 13.9 11 to 15 years of study 13.8 Source: Elaborated by the authors
3.3 ESTIMATES FOR CIVIL CONSTRUCTION AND INDUSTRY
Table 3 shows the coefficients of the adjusted income equations for employees in Civil Construction and Industry from 2002 to 2013. The Student's t-test showed most cases with significance at the level of 1%, and it is not possible to reject the null hypothesis of the parameter. The determination coefficient for the data of the two sectors of the model was 50.67% for Civil Construction and 56.28% for Industry.
It is observed that there is more significant discrimination by gender in Industry than in Civil Construction. Estimates show that men's wages are higher than women's earnings in Civil
Construction (8.16%). In Industry (37.87%), this differentiation is much more accentuated. Besides, black workers in Civil Construction tend to receive 7.3% less than whites. This also occurs in Industry (˗9.8%) in a more significant proportion.
Concerning the geographic region, in Civil Construction, taking the Northeast region as a base, all other regions tend to better remunerate their workers, with the state of São Paulo (44.07%) with higher remuneration, followed by the South (35.08 %), Midwest (37.01%), Southeast exclusive São Paulo (24.86%) and North (21.42%). It is interesting to note that even with public jobs in the North and Northeast, remuneration in São Paulo and the South remains higher.
For Industry, the wage differentiation between Northeast and São Paulo (49.56%) is even greater, which can be expected considering the industrial concentration that São Paulo’s economy presents. However, the South (33.93%), Midwest (31.17%), Southeast excluding São Paulo (29.8%), and North (26.38%) also have asymmetry.
The Midwest should be highlighted, as both sectors presented higher remuneration than the Southeast, excluding São Paulo, when compared to the Northeast. This demonstrates the region's development in recent decades as an essential pole of Brazilian agribusiness.
Table 3 - Income equations for people employed in construction and industry, Aggregating PNAD data from 2002 to 2013
Variable Construction Sector Industry Sector
Coef. Dif.%¹ Test t Prob. t Coef. Dif.%¹ Test t Prob. t
Constant 5.934 - 225.83 0.0001 5.876 - 395.62 0.0001
Gender Male. (reference: Female) 0.078 8.16 7.99 0.0001 0.321 37.87 121.05 0.0001
Age
Age 10 0.358 - 41.2 0.0001 0.494 - 85.53 0.0001
(Age 10)² -0.034 - -30.56 0.0001 -0.046 - -60.69 0.0001
Education (reference: 15 years or more)
Illiterate and less than 1 year -1.425 -75.96 -119.87 0.0001 -1.463 -76.85 -194.19 0.0001 1 to 3 years -1.376 -74.74 -119.74 0.0001 -1.442 -76.35 -220.53 0.0001 4 to 7 years -1.281 -72.22 -119.3 0.0001 -1.286 -72.37 -257.42 0.0001 8 to 10 years -1.189 -69.54 -107.55 0.0001 -1.133 -67.78 -225.8 0.0001 11 to 14 years -0.979 -62.45 -90.11 0.0001 -0.875 -58.33 -187.83 0.0001
Race (reference: White)
Black or Brown -0.076 -7.30 -18.78 0.0001 -0.103 -9.80 -41.44 0.0001
Asian 0.088 9.20 2.56 0.0106 0.153 16.50 8.99 0.0001
Family Condition
(reference: Head of Household) -0.112 -10.57 -26.84 0.0001 -0.128 -12.02 -48.21 0.0001 Rural Area (reference: Urban Area) -0.016 -1.56 -2.38 0.0173 -0.092 -8.80 -20.2 0.0001 Hours worked (reference: 15 to 39
hours)
Up to 14 hours 0.013 1.34 0.71 0.4794 -0.185 -16.90 -14.78 0.0001
40 to 44 hours 0.429 53.59 52.68 0.0001 0.280 32.25 55.41 0.0001
45 to 48 hours 0.465 59.21 53.49 0.0001 0.244 27.59 45.04 0.0001
Region (reference: Northeast)
Midwest 0.315 37.01 42.94 0.0001 0.271 31.17 47.89 0.0001
North 0.194 21.42 26.05 0.0001 0.234 26.38 40.1 0.0001
Sao Paulo 0.365 44.07 65.29 0.0001 0.403 49.56 108.49 0.0001
Southeast (excluding São Paulo) 0.222 24.86 42.21 0.0001 0.261 29.80 65.53 0.0001
South 0.306 35.80 48.26 0.0001 0.292 33.93 72.24 0.0001
Occupation (reference: Formal worker)
Informal worker -0.632 -46.83 -30.39 0.0001 -0.599 -45.08 -36.74 0.0001 MW Real/100 0.128 13.71 51.88 0.0001 0.074 7.68 59 0.0001 (MW Real/100)*(informal worker) 0.051 5.20 14.24 0.0001 0.052 5.30 17.55 0.0001 R² 50.67 56.28 Test F(²) 3,250.60 10,690.70 Observations 75,958 199,359
¹Values obtained by calculating the percentage growth of income: 100[exp (coefficient)-1]. ²The F values are statistically significant at the 1% level.
Source: Prepared by the authors, based on PNAD microdata (2002 to 2013)
After discounting the effects of the other variables and taking individuals aged 15 or older as a basis, it was observed that the class of education and remuneration are directly proportional. In Civil Construction, whose workforce does not have a high level of education, workers with 8 to 10 years of study tend to receive 69.54% less salary than those with a higher level of education. In Industry, this proportion is even more pronounced (˗67.78).
Given that as schooling increases, remuneration also grows, a second model was estimated with a polygonal adjustment for the education variable. We started from the hypothesis that the slope of the remuneration curve changes after 11 years of study. For Civil Construction, the model was adjusted for 8 years of study. Table 4 shows the results obtained by the model.
Again, the parameters proved to be significant at the 1% confidence level, and the model obtained a high degree of explicability for both Civil Construction (51.22%) and Industry (57.43%). Formalization in the labor market is an essential tool for wage differentiation. Workers without a formal contract received lower wages in both Civil Construction (˗ 46.4) and Industry (˗44.8).
When analyzing the model, it appears that the average annual return for people with less than 8 years of study was 3.71%, while in the larger polygonal (equal to or above 8 years), the return was 19.65%. In this way, workers with more than eight years of study receive 5.3 times more than less qualified workers. It is worth mentioning that in the last decades, the Civil Construction sector has undergone technological changes, in which the working method has become increasingly productive through pre-molded houses, semi-finished blocks, and the introduction of machines that require more critical qualification from the worker for your operation. Also, the sector faces a lack of exceptionally qualified labor, which tends to increase wages (DECONCIC, 2008).
For Industry, it appears that workers with less than 11 years of study tend to receive 5.89% per additional year of schooling, while those over 11 receive three times more (17.48%) per additional year of education. This wage differentiation may be linked to the technological importance for the sector.
It is also observed that, although the educational return (in the polygonal less / equal 8 years of study) of Civil Construction (3.71%) is less than (in the polygonal less / equal 11 years of study) of Industry (5.89 %), the return rate for Civil Construction over 8 years of study (19.65%) is higher than the industrial, educational return (17.48%) for people with more than 11 years of schooling.
Table 4 - Income equations for people employed in civil construction and industry, with polygonal adjustment, Aggregating PNAD data from 2002 to 2013
Variável Construction Sector Industry Sector
Coef. Dif.%¹ Test t Prob. t Coef. Dif.%¹ Test t Prob. t
Constant 4.396 - 173.64 0.0001 4.246 - 300.09 0.0001
Gender Male. (reference: Female) 0.101 10.62 10.35 0.0001 0.323 38.07 123.26 0.0001
Age Age 10 0.379 - 43.85 0.0001 0.511 - 89.82 0.0001 (Age 10)² -0.035 - -32.41 0.0001 -0.047 - -63.15 0.0001 Education (²) Schooling ≤ abscissa 0.036 3.71 62.94 0.0001 0.057 5.89 146.24 0.0001 Schooling> abscissa 0.143 19.65 72.47 0.0001 0.104 17.48 111.66 0.0001
Race (reference: White)
Black or Brown -0.071 -6.86 -17.68 0.0001 -0.094 -8.98 -38.25 0.0001
Asian 0.073 7.59 2.14 0.0326 0.129 13.76 7.69 0.0001
Family Condition
(reference: Head of Household) -0.112 -10.61 -27.11 0.0001 -0.129 -12.10 -49.23 0.0001 Rural Area (reference: Urban Area) -0.012 -1.15 -1.77 0.0772 -0.080 -7.67 -17.72 0.0001 Hours worked (reference: 15 to 39
hours)
Up to 14 hours 0.024 2.48 1.31 0.1917 -0.170 -15.67 -13.79 0.0001
40 to 44 hours 0.437 54.83 53.97 0.0001 0.293 33.98 58.76 0.0001
45 to 48 hours 0.476 60.93 55.02 0.0001 0.263 30.02 49.15 0.0001
49 hours or more 0.549 73.19 60.58 0.0001 0.348 41.58 61.21 0.0001
Region (reference: Northeast)
Midwest 0.308 36.00 42.19 0.0001 0.259 29.62 46.44 0.0001
North 0.192 21.12 25.86 0.0001 0.233 26.27 40.49 0.0001
Sao Paulo 0.361 43.48 64.99 0.0001 0.396 48.62 108.34 0.0001
Southeast (excluding São Paulo) 0.216 24.11 41.43 0.0001 0.249 28.32 63.64 0.0001
South 0.298 34.78 47.52 0.0001 0.282 32.56 70.91 0.0001
Occupation (reference: Formal
worker) Informal worker -0.624 -46.44 -30.22 0.0001 -0.593 -44.76 -36.89 0.0001 MW Real/100 0.129 13.73 52.29 0.0001 0.074 7.72 60.16 0.0001 (MW Real/100)*(informal worker) 0.049 5.06 13.94 0.0001 0.050 5.09 17.1 0.0001 R² 51.22 57.43 Test F(³) 3,797.83 12,805.70 Observations 75,958 199,359
²Percentage growth of income concerning an additional year of schooling. Abscissa measures the educational return after it exceeds eight years for Civil Construction and eleven years for Industry, obtained by calculating, for example,
100[exp(0.039+0.154)-1 = 21.35%
³The F values are statistically significant at the 1% level.
Source: Elaborated by the authors, based on the PNAD microdata (2002 to 2013)
The data obtained are in line with what was expected by the Human Capital Theory proposed by Schultz (1961), Mincer (1974), and Becker (1994). In addition, the educational return estimated in the model is close to those obtained by Leal and Werlang (1991), Kassouf (1994, 1998) and Sachida et al. (2004), with only Civil Construction (after 8 years of study) showing a return above the conventional. In the same line proposed by Piketty (2014), this article argued that education, training, and the training of labor acted as a force to improve income distribution.
There is no doubt that public investment in education generates more income. However, it must be considered that education alone is not enough for economic development and job creation. Other macroeconomic variables impact the labor market and may decrease the effect of education on income distribution.
Besides, the importance of other social policies that are essential indicators of income distribution is known, for example, the minimum wage appreciation policy and the Bolsa Família program. It is worth mentioning that, in addition to the effects on remuneration, education makes citizens more critical, raises the quality of life and health, reduces crime, and provides the basis for democracy in the country.
Finally, the estimates of the rate of educational return for the period corroborate the importance of education in the sectors analyzed, especially in the Civil Construction sector, which is typically characterized by low worker education and worse working conditions. Thus, a policy of valuing education for the sector is essential to improve workers' income and guarantee fundamental rights, such as access to retirement through Social Security, elimination of child labor, or protection insurance. Unemployment, giving higher quality to employment.
4 CONCLUSION
This article estimated income equations for Civil Construction and the Brazilian Industry between 2002 and 2013. It was found that regional differences persist, although the Midwest has improved the indicators when compared to the Northeast region of Brazil. Estimates show that gender discrimination was much higher in Industry than in Civil Construction, with male workers tending to receive more income than women. Besides, blacks remain with a lower income than whites, especially in the industry. Among the independent variables used in the estimated wage equations, it was found that years of study are among the variables that most contributed to the increase in workers'
wages. This indicates that the increase in education can eliminate wage distortions frequently found in the labor market in the different sectors of the country's economy. Bearing in mind that a good part of Brazilian education system is dependent upon the public power, the importance of public policies that aim to increase the level of education and the qualification of Brazilian workers is defended, especially in Civil Construction, in order to generate higher wages and better working conditions for them. This would be an essential tool for combating income inequality and eliminating extreme poverty. Finally, the income equation has shown empirically that the average real wage of different labor markets can be positively impacted by the education of workers, as predicted by the Human Capital Theory.
ACKNOWLEDGMENT
The third author acknowledges the financial support given by the Conselho Nacional de Desenvolvimento Científico e Tecnológico (CNPq, process 140263/2020-9)
REFERENCES
ARBACHE, J. S. Determinação e diferencial de salários no Brasil. In: FONTES, R.;
BARROS, R. P. de; MENDONÇA, R.; SANTOS, D.D. dos; QUINTAES, G. Determinantes do desempenho educacional no Brasil. Rio de Janeiro: IPEA, 2001. (Texto para Discussão, 834). ____________; HENRIQUES, R.; MENDONÇA, R. Pelo fim das décadas perdidas: educação e desenvolvimento sustentado no Brasil. Rio de Janeiro: IPEA, 2002. (Texto para Discussão, 857). ____________; FRANCO, S.; MENDONÇA, R. A recente queda da desigualdade de renda e o acelerado progresso educacional brasileiro da última década. Rio de Janeiro: IPEA, 2007. (Texto para Discussão, 1304).
BECKER, G.S. Human capital: a theoretical and empirical analysis with special reference to education. 3. ed. Chicago: The University of Chicago Press, 1994.
DEPARTAMENTO DA INDÚSTRIA DA CONSTRUÇÃO – DECONCIC. Proposta de política industrial para a construção civil – edificações. São Paulo, out. 2008.
HECKMAN, J.J. Shadow prices, market wages, and labor supply. Econometrica, Princeton University Press, p. 679-694, 1974.
____________. Sample selection bias as a specification error. Econometrica, Menasha, v. 47, n.1, p.153-161, jan. 1979.
HOFFMANN, R. Distribuição de renda e crescimento econômico. Estudos Avançados, São Paulo, v. 15, n. 41, 2001.
____________; NEY, M.G. Desigualdade, escolaridade e rendimentos na agricultura, indústria e serviços, de 1992 a 2002. Economia e Sociedade, Campinas, v. 13, n. 2, p. 51-79, jul./dez. 2004. ____________; SIMÃO, R.C.S. Determinantes do rendimento das pessoas ocupadas em Minas Gerais em 2000: o limiar no efeito da escolaridade e a diferença entre mesorregiões. Nova Economia, Belo Horizonte, v. 15, n. 2, p. 35-62, maio /agosto 2005.
____________. Desigualdade da distribuição da renda no Brasil: a contribuição de aposentadorias e pensões e de outras parcelas do rendimento domiciliar per capita. Economia e Sociedade, Campinas, v. 18, n. 1, p. 213-231, abr. 2009.
INSTITUTO BRASILEIRO DE GEOGRAGIA E ESTATÍSTICA - IBGE. Pesquisa Nacional por Amostra por Domicílios 2013, v. 31, Brasil. Rio de Janeiro, IBGE.
INSTITUTO NACIONAL DE ESTUDOS E PESQUISAS EDUCACIONAIS ANÍSIO TEIXEIRA - INEP. Ministério da Educação. Censo Escolar 2010, 2011 e 2012. Disponível em: < http://www.inep.gov.br/>. Acesso em: 29 jul. 2013.
INSTITUTO DE PESQUISA ECONÔMICA APLICADA – IPEA. Sobre a recente queda da desigualdade de renda no Brasil. Brasília: IPEA, agosto de 2006. Nota Técnica. Disponível em: <http://www.ipea.gov.br>. Acesso em: 12 mai. 2012.
KASSOUF, A.L. The wage rate estimation using the Heckman procedure. Revista de Econometria, Rio de Janeiro, p. 89-107, 1994.
____________. Wage gender discrimination and segmentation in the Brazilian labor market. Economia Aplicada, São Paulo, v. 2, n. 2, p. 243-269, 1998.
LANGONI, C.G. Distribuição da renda e desenvolvimento econômico do Brasil. Rio de Janeiro: Expressão e Cultura, 1973.
LEAL, C. I. S.; WERLANG, S. R. C. Retornos em educação no Brasil: 1976/89. Pesquisa e Planejamento Econômico, Rio de Janeiro, v. 21, n. 3, p. 559-574, dez. 1991.
MENEZES-FILHO, N. Equações de rendimentos: questões metodológicas. In: CORSEUIL, C. H. Estrutura salarial: aspectos conceituais e novos resultados para o Brasil. Rio de Janeiro: IPEA, 2002. MINCER, J. Schooling, experience and earnings. National Bureau of Economic Research, 1974. OLIVEIRA, F.C.R. de; HOFFMANN, R. Determinantes dos salários dos empregados na lavoura de cana de açúcar e em outras atividades agropecuárias no Brasil. Revista de Economia Agrícola, São Paulo, v. 58, n. 2, p. 41-56, jul./dez. 2011.
PIKETTY, T. O Capital no século XXI. Rio de Janeiro: Intrínseca, 2014. 672 p.
SACHIDA, A.; LOUREIRO, P.R.A.; MENDONÇA, M.J.C. de. Um estudo sobre retorno em escolaridade no Brasil. Revista Brasileira de Economia, Rio de Janeiro, v.58, n.2, p. 249-265, abr./jun. 2004.
SCHULTZ, T.W. The economic value of education. New York: Columbia University Press, 1961. SOARES, R.; GONZAGA, G. Determinação de salários no Brasil: dualidade ou não-linearidade no retorno à educação. Anais do XX Encontro Brasileiro de Econometria, Vitória, vol.II, 9-11, 1999. SOARES, S.S.D. Distribuição de renda no Brasil de 1976 a 2004 com ênfase no período entre 2001 e 2004. Brasília: IPEA, fev. 2006. (Texto para Discussão, 1166).
SMITH, A. A riqueza das nações: investigação sobre sua natureza e suas causas. São Paulo: Nova Cultural, 1776.