Prediction of the amount of secondary structure of proteins using unassigned
NMR spectra: A tool for target selection in structural proteomics
Vitor Hugo Moreau
1,2, Ana Paula Valente
2and Fábio C.L. Almeida
2 1Núcleo de Biotecnologia, Faculdade de Tecnologia e Ciências, Salvador, BA, Brazil.
2Centro Nacional de Ressonância Magnética Nuclear de Macromoléculas,
Instituto de Bioquímica Médica, Universidade Federal do Rio de Janeiro, Rio de Janeiro, RJ, Brazil.
Abstract
With the advent of structural genomics, the need for fast structural information about unknown proteins has in-creased. We describe a new methodology, based on13
C,15 N and1
H chemical shift dispersion to predict the amount of secondary structure of unassigned proteins from their15
N- and/or13
C-edited heteronuclear single quantum coher-ence (HSQC) spectra. This methodology has been coded into a software called PASSNMR (Prediction of the Amount of Secondary Structure by Nuclear Magnetic Resonance), which can be accessed directly from the Internet. PASSNMR program is a powerful tool for screening proteins for proteomic or structural genomic investigations when used with recent methodologies that take advantage of the use of the antibiotic rifampicin to selectively label the heterologous proteins expressed inE. coli. PASSNMR analysis can be useful as a first approach to predict the amount of secondary structure in proteins to structural genomics. Information about the secondary structure of pro-teins can be obtained even before protein purification, with small quantities of protein, just by performing two simple nuclear magnetic resonance (NMR) experiments and using PASSNMR program.
Key words:chemical shift dispersion, PASSNMR, prediction of secondary structure, structural proteomics, target selection. Received: September 20, 2005; Accepted: March 15, 2006.
Introduction
The genome of a variety of organisms has been se-quenced and the scientific community is now investigating the large amount of information available. Understanding the functioning of the newly discovered genes will have a great impact on almost all fields of research and may lead to novel treatments for cancers and other diseases (Onyango
et al., 2004; Smith and Sacchettini, 2003; Chamberset al., 2000; Christendat, 2000). The scientific community is dis-cussing strategies for quickly analyzing this deluge of new information. In this sense, computational methods are im-portant for mining the genome to look for primary, second-ary and tertisecond-ary structure homologies between proteins.
One problem in structural proteomics is that only a small group of protein folds are determined because the se-lection of proteins for experimental analysis is often based on their solubility and flexibility. In this way, this leads to the same classes of “well-behaved” proteins being selected for study and, consequently, only known folding motifs
be-ing resolved. The major challenge in this field is to develop methods for pre-screening potential structural targets for possible novel folding structures patterns. The process of pre-screening is principally accomplished by computa-tional processes which restrict protein candidates (Linding
et al., 2003; Christendatet al., 2000; Brenner, 2000). Tar-get proteins have to be prioritized according to interest and accessibility and improved target-screening methods can be very important because the selection of appropriate can-didates relies on arbitrary boundaries and is thus largely im-precise (Brenner, 2000). Prestegardet al.(2001) proposed the use of NMR spectroscopy as a tool for the selection of structured proteins as targets for structural determination.
The dependence of1Ha,1HN,13C chemical shifts on the secondary structure of proteins has been extensively studied (Tjandra and Bax, 1997; Ösapay and Case, 1994; Spera and Bax, 1991; Wishartet al., 1991; Wishartet al., 1991b; Pastore and Saudek, 1990; Williamson, 1990; Saito, 1986; Andoet al., 1984; Pardiet al., 1984). Heteronuclear correlation spectra (13C/15N) can be obtained without pro-tein purification and at low cost by using the rifampicin protocol recently proposed by our group (Galvão-Bottonet al., 2003; Almeidaet al., 2001). This methodology enables the selective13C/15N labeling of the heterologous protein
www.sbg.org.br
Send correspondence to Vitor Hugo Moreau. Faculdade de Tecno-logia e Ciências. Av. Luis Viana Filho 8812, Mod III, sala 110, 41820-785 Salvador, BA, Brazil. E-mail: vhmoreau@yahoo. com.br.
expressed in bacteria. The present paper describes a new methodology to extract quantitative information from hete-ronuclear correlation spectra edited by15N and/or13C with-out requiring resonance assignments. It is possible to predict the amount of secondary structure only based on cross peak dispersion. This methodology was coded into a computer program for the prediction of the amount of sec-ondary structure by NMR (PASSNMR) which was de-signed in our laboratory to be used in combination with the rifampicin protocol (Galvão-Bottonet al., 2003; Almeida
et al., 2001), thus creating a system for rapidly screening the structure of protein candidates for possible structure de-termination in structural proteomics.
Material and Methods
The PASSNMR program was written in the Practical Extraction and Report Language (Perl) version 5.0 using an IBM-PC workstations running Linux version 2.2, and should be fully compatible with all Unix variants and Win-dows systems. Starfiles of 72 proteins were obtained from BioMagRes Bank (Seavyet al., 1991) and their resonance assignments were used to reconstruct both13C- and 15 N-HSQC spectra of these proteins. Only Starfiles of proteins that had complete 13C and 15N assignments and three-dimensional structures determined by NMR were used.
Training procedures
The amount ofa-helix andb-sheet, and non-ab struc-ture was determined by analysis of the strucstruc-ture of the 72 proteins as found in the Protein Data Bank. These values are represented as a percentage at the primary sequence in-volved in these 3 structural motifs, such that the sum of all 3 is 100%. The non-abstructural types includes random coil, loops, turns, etc.
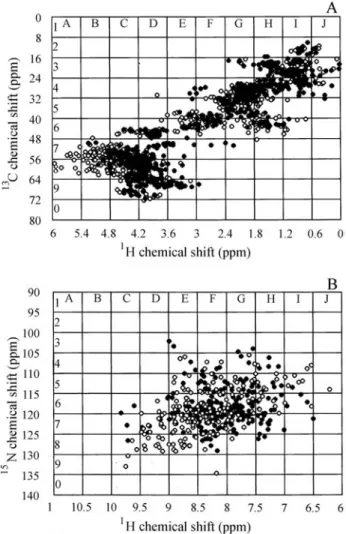
We devided13C-HSQC and15N-HSQC spectra into 10x10 areas (Figure 1) and determined the fraction of the total number of peaks within each area for every protein. The number of peaks in some areas was found to be propor-tional to the amount of secondary structure the protein had. The areas that showed a correlation coefficient greater then 0.3 (i.e.moderately correlated according to Anderson and Finn (1996)) between the fraction of the total peaks within that area (ni) and the amount of secondary structure (P)
were considered as one individual hint (Pi) for the training
procedure for the amount of secondary structure in the pro-tein.
The slope and the intercept of the regression line fit-ting the points of each area was substituted into Equation 1a to calculate the individual hints for each area. The hints were taken into account using the square of the correlation coefficient of the correlation curve for each area as a weigh-ing factor. For the first prediction, the weighted average on the correlation coefficient for all individual hints was
cal-culated for both 13C-HSQC and 15N-HSQC spectra as shown in Equation 1b.
P n b a
i
i i
i
=( - ) (1a)
[ ]
[ ]
P P r
r
i i
i
=
å
å
2
2 (1b)
wherePiis the individual hint of the areai;niis the fraction
of peaks that lie on the areai;aiandbiare, respectively, the
slope and intercept of the curve in areai;Pis the unrefined prediction of the amount of the secondary structure andriis
the correlation coefficient for the areai.
External refinement: as the sum of all types of sec-ondary structure in protein should be equal to 100%, the predicted values of the amount of a-helix, b-sheet and Figure 1-13C-HSQC(A) and15N-HSQC (B) spectra reconstructed from
Star files.13C-HSQC(A) and15N-HSQC (B) spectra of proteins Rous
non-abstructure for each protein were summed and the values corrected such that to the sum reached 100%. We corrected the predicted values according to the inverse of their correlation coefficient using the equation:
P P P r
r
ext
t
i
= +é -ë ê ê ù û ú ú
å
å
( ) ( ) ( ) 100 2 2 (2)wherePextis the externally refined value of the prediction;
Pis the unrefined value of the prediction;rtis the sum of the
correlation coefficients of the areas for all three types of structure andriis the sum of the correlation coefficient of
the areas for the secondary structure that is being corrected. Internal refinement: another refinement was applied to increase the fidelity of the prediction. The slope and the intercept values of the correlation plot (between the exter-nally refined prediction and the real values of secondary structure) are forced to become 1 and 0, respectively. Thus, in all data points for the three kinds of structure, the equa-tion of the straight line formed by the correlaequa-tion between the real and the predicted values for each kind of structure was applied as:
P P b
a ext p p int = -( ) (3)
wherePintis the amount of secondary structure after
inter-nal refinement, andapandbpare, respectively, the slope
and the intercept of the linear regression fromPext
predic-tions.
Many other conditions and refinement methods were tested (e.g.a different number of areas, etc.) but none of
them gave results as good as those used.
The input for PASSNMR prediction must be a text peak list files of13C-HSQC and15N-HSQC spectra but peak assignment in unnecessary.
Results
To correlate chemical shift dispersion with the amount of secondary structure,13C-HSQC and15N-HSQC spectra were constructed based on the assignments ob-tained from Star files of 72 proteins taken from the Bio-MagRes Bank. The spectra were divided into areas (Figure 1) and the number of peaks in each area counted. The ratio of the number of peaks in each area divided by the total number of cross-peaks in each spectrum was calculated and found to be proportional to the amount of secondary struc-ture in each protein obtained from the protein data bank (q.v. Materials and Methods).
The 13C-HSQC (A) and 15N-HSQC (B) spectra of Rous Sarcoma Virus capsid protein (Campos-Olivaet al., 2000) (Figure 1, filled circles) and Periplasmic Chaperone FinC (Pellecchiaet al., 1998) (Figure 1, open circles) were divided into areas as described in the Material and Me-thods.
Anderson and Finn (1996) considered that correlation coefficients of between 0.3 and 0.6 are moderate, so the ar-eas with correlation coefficients within this range were used as an individual hint for secondary structure predic-tion. No area showed a correlation coefficient higher that 0.6 and areas with a correlation coefficient lower than 0.3 were discarded. Areas that displayed moderate correlation coefficients between the percentage of total peaks and the amount of secondary structure in the proteins for both in 13
C-HSQC and15N-HSQC are shown in Table 1.
Some areas showed opposite correlation with the amount ofa-helix andb-sheet in proteins,i.e., the greater
Table 1- Correlation coefficients for all the areas used for training the PASSNMR software. Area B7 was not used because it gave a positive correlation for bothb-sheet and non-abstructure.
quadrant correlation coefficient
a-helix b-sheet non-ab
13C-HSQC A7 - 0.33
-A8 - 0.40
-B7* -0.50 0.31 0.42
B8 -0.47 0.42
-C6 -0.38 - 0.39
C7 - - 0.42
C8 - - 0.39
D8 0.42 -0.38
-F6 - 0.34
-G4 0.33 -
-G6 0.30 -
-H5 -0.40 0.39
-I3 - 0.32
-J3 - 0.31
-15N-HSQC C7 - 0.32
-C8 -0.30 0.31
-D5 -0.34 0.45
-D6 -0.41 0.45
-D7 -0.47 0.53
-D8 -0.51 0.50
-D9 - 0.33
-E5 - 0.33
-E8 -0.47 0.44
-F6 0.44 -0.40
-F7 - -0.31
-G6 0.53 -0.38
-G7 0.52 -0.53
-H4 - 0.31
-H6 - -0.35
-H7 - -0.32
the number of peaks for ana-helical protein, the smaller the number of peaks for ab-sheeted protein in the same area, and vice versa. For instance, area B8 of13C-HSQC showed negative correlation witha-helix and positive withb-sheet (Table 1 and Figure 2).
The areas that showed moderate correlation (Table 1) were selected for coding the software. The slope and inter-cept obtained for the curve of each area were used to build an empirical equation (Equations 1a and 1b, Materials and Methods). With individual hints weighted with the square of the correlation coefficient. The square of the correlation co-efficient indicates the probability of the event predicted in the correlation (Anderson and Finn, 1996), with the correla-tion coefficient of 1 indicating a 100% chance of the event occuring. Area B7 was not used because it gave positive cor-relation both forb-sheet and non-abstructure (Table 1).
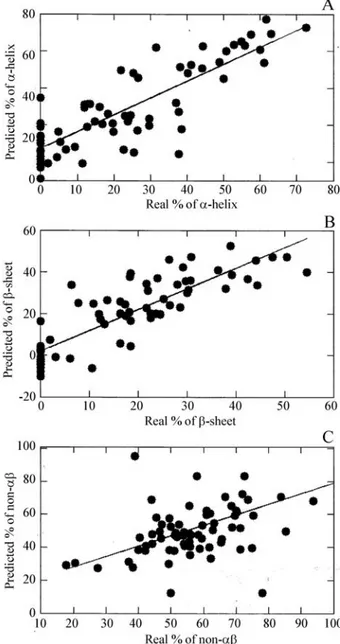
The correlations between the predictions made by PASSNMR and the real amount of secondary structure in the 72 proteins, obtained from PDB, fora-helix,b-sheet and non-abare shown in Figure 3. We named this first pre-diction as `unrefined’, because it was based only on the in-dividual hints given by each area (Equation 1a and 1b). The unrefined prediction had good correlation with the real val-ues for most proteins, with correlation coefficients of 0.84 for thea-helix, 0.86 for theb-sheet and 0.48 for the non-ab
structure.
Since the sum of all types of secondary structure in proteins must reach 100%, we summed the amount of the
three types of secondary structure for all proteins and the values for the unrefined prediction of total structure rounded 100% (Figure 4). This means that, although the primary prediction of the three types of secondary structure was based on three independent parameters, the total amount of secondary structure of the proteins was very close to the actual value. This can be used as a first argu-ment for the reliability of the prediction. The prediction was refined by correcting the previous unrefined prediction as-suming that the sum of the predicted percentage for the three kinds of structure (a-helix,b-sheet and non-ab struc-ture) reached 100% in every protein studied. In cases where that sum was not equal to 100%, the external refinement
Figure 2- Selected areas that showed opposite correlation between per-cent of total peaks and the amount ofa-helix (top set) andb-sheet (bottom set) in both13C-HSQC(A) and15N-HSQC(B) spectra.
was applied as in Equation 2. The external refinement (q.v. Material and Methods) raised the correlation coefficient be-tween real and predicted values to 0.85 fora-helix, 0.86 for
b-sheet and 0.65 for the non-abstructure. Although the ar-eas correlation coefficients are considered moderated (0.3 to 0.6), the result correlation is strong (>0.6) (Anderson and Finn, 1996). This was due to the large number of individual hints for each kind of secondary structure and resulted in a more reliable prediction.
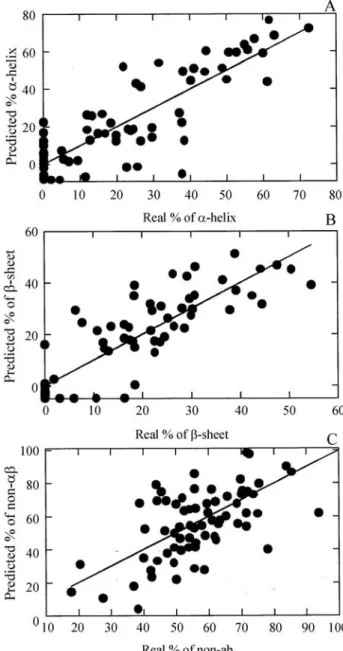
Internal refinement was then applied to the three kinds of structure as in Equation 3. Because the correlation coefficient of a curve is not affected by multiplying it val-ues by a constant, internal refinement did not improve the correlation coefficients of predicted data but did improve the reliability of the prediction. The final correlation after external and internal refinements between real and pre-dicted amounts of structure fora-helix,b-sheet and non-ab
strucutre is shown in Figure 5. The same correlation done exclusively with areas from the15N-HSQC spectra (data not shown) produced correlation coefficients of 0.70 for
a-helix and 0.71 forb-sheet, but non-abstructure cannot be estimated using only 15N-HSQC data, so the non-ab structure values are more reliable if calculed by subtracting the sum of the values for theaandbstructures from 100%.
As a test case, we used BioMagRes Bank proteins with complete assignment and their three-dimensional structure solved by X-ray crystallography. These proteins were not used to build PASSNMR because their NMR structures were not available. The efficiency of the method is illustrated by the top set data in Table 2. Most of the pre-dictions are in good agreement with the X-ray structure. Note that the PASSNMR program was able to identify the absence ofa-helix in domain 1 of CD2. The predictions us-ing only the15N-edited spectrum were also efficient.
We also used the PASSNMR program to investigate some proteins that are being studied in our laboratory. The results were compared with homologous proteins that have their three-dimensional structure deposited in Protein Data Bank (PDB). The values for the amount ofa-helix,b-sheet and non-abstructure for these proteins are given in the middle and bottom data sets of Table 2. The prediction for
P. sativumplant defensin was compared both with homolo-gous proteins and with real values from the NMR structure determined in our laboratory (Almeidaet al., 2002). As can be seen (Table 2), the predicted values are in good agree-ment with the PDB data, taking in account the possible structural differences between the proteins used and their homologues. Here again the prediction using only 15 N-HSQC data were in good agreement with the actual amount of secondary structure in the tested proteins. It is worth mentioning that the PASSNMR program could detect the absence of ab-sheet in the Opaque2 protein. Although the structure of this protein is not solved it is known to be fully Figure 4- Sum of the three kinds of secondary structure. The amounts of
a-helix,b-sheet and non-abof unrefined prediction were summed and the total secondary structure rounded 100%. A line was drawn in 100% merely to guide the eyes.
helical since it is a coiled coil leucine zipper (Moreauet al., 2004).
Discussion
The chemical shift index is a reliable parameter for determining the secondary structure in proteins (Wishart and Sykes, 1994; Wishart, et al., 1992; Wishart et al., 1991a,b). Although 2D heteronuclear correlation spectrum by itself provides no information regarding chemical shift assignments, some data on the secondary structure of pro-teins can be extracted from spectral chemical shift disper-sion. In principle, such data contains information relating to the amount ofa-helix and b-sheet present in the protein (Wishart and Sykes, 1994; Wishart,et al., 1992; Wishartet al., 1991a,b).
Many methods have been developed to speeding up structural characterization of unknown proteins, mainly af-ter the advent of genome sequencing projects. Most meth-odologies have the objective of finding structural similari-ties with known proteins. Primary structure homology has been used for this purpose and is undoubtedly one of the most useful methods (Altschulet al., 1990). Without pri-mary sequence homology, function can be annotated from secondary or tertiary homology with known proteins (Bha-duriet al., 2004; Jung and Lee, 2004; Li and Lu, 2001; Meiler et al., 2000; Jones, 1999a,b; Rychlewski et al., 1999; Thompson and Goldstein, 1997; Sander and Schnei-der, 1991; Kabsch and SanSchnei-der, 1983). Methods to find sec-ondary and tertiary structure homology are continuing to be
developed and become more reliable when based on, or as-sociated to, experimental data. For example, Bujnickiet al. (2001) used NMR secondary structure restrains and Monte Carlo dynamics to make a blind prediction of the tertiary structure of the N-terminal domain of the I-TEVI homing endonuclease and Cornilescuet al. (1999) developed a soft-ware to predict thefandyangles in proteins by searching a database for chemical shift and sequence homology, while Ayerset al. (1999) proposed the use of NMR secondary structure assignments to perform similarity searches and fold recognition of unknown proteins.
A technique for predicting the amount of secondary structure based on NMR data without the need of assign-ments is shown in our paper and resulted in the PASSNMR program. The reliability of the predictions can be estimated from the square of the correlation coefficients as 72% for
a-helix, 74% forb-sheet and 42% for non-abbut if only 15N-HSQC data is used the correctness of the prediction is
49% fora-helix, 50% forb-sheet.
The prediction of the amount of non-abstructure was not as good due to the lower number of areas showing cor-relation between the number of peaks and the amount of non-abstructure (Table 1), possibly because it is a class with several types of structure (random coil, loops, turns, etc.). However, this behavior does not decrease the reliabil-ity of the method since the predicted amount of non-ab
structure can be corrected using the values froma-helix andb-sheet. Even so, users of PASSNMR program should note that, in cases where the sum of the three kinds of struc-Table 2- Comparison of PASSNMR predictions for selected proteins with full NMR assignments in the BioMagRes Bank and known crystal structure (top set). The sets with asterisks show PASSNMR prediction for three proteins with unknown structure. These sets present some homologous proteins de-posited in the Protein Data Bank (PDB). The PDB codes are in parentheses.
PASSNMR (%) 15N PASSNMR (%) Content from PDB data (%)
a-helix b-sheet non-ab a-helix b-sheet a-helix b-sheet non-ab
Ovomucoid third domain (2OVO) 13 15 76 24 22 17.86 12.55 69.59
Cutinase Fusarium solani (1CUA) 19 18 62 33 26 32.71 12.62 54.67
Domain 1 of rat CD2 (1CDC) 0 40 63 0 60 0 35.35 64.65
Adenilate kinaseE. coli/ Ap5 (1AKE) 22 22 52 35 31 43.46 15.89 40.65
PyrophosphokinaseE. coli/ MgAMPPCP (1EQO) 3 27 73 6 40 28.48 22.78 48.74
plant defensinP. sativum* 13 25 61 21 36 23.91 28.26 47.83
g-1-P-thionin T. turgidum (1GPS) 21.28 36.17 42.55
g-1-P-thionin H. vulgare (1GPT) 23.4 36.17 40.43
antifungal protein 1R. sativus(1AYJ) 21.57 31.37 47.46
yeast thioredoxin* 40 8 45 63 9
thioredoxinB. acidocaldarius(1QUW) 36.19 19.05 44.76
thioredoxinB. reinhardtii(1TOF) 39.29 19.64 41.07
thioredoxinE. coli(1XOA) 36.11 25.93 37.96
thioredoxinH. sapiens(3TRX) 32.28 24.76 42.86
opaque2 CxL* 63 0 24 100 0
tures is not equal to 100%, the value for the amount of non-abstructure is the less accurate. In fact, after the exter-nal refinement, only the correlation coefficient for non-ab
structure changes significantly, indicating that the predic-tion for this kind of structure is based not only on the areas hints but mainly on thea-helix andb-sheet values.
We recently proposed the use of rifampicin for the se-lective labeling of heterologous proteins expressed inE. coli (Galvão-Botton et al., 2003; Almeida et al., 2001). This simple methodology permits very rapid preparation of uniformly15N/13C-labeled NMR samples because purifica-tion is not demanded. It is possible to obtain a good quality NMR spectrum in few minutes at low cost, preparing the sample in 20-50 mL of growth media. Serberet al. (2001) reported thein situHSQC spectrum of a protein in living cells. PASSNMR can still give quantitative information on the secondary structure of the proteins inside the cell.
The PASSNMR program can provide important in-formation, especially on structural proteomics, by provid-ing clues on how structured the protein is and which kind of secondary structure is present. This information can be use-ful for classifying proteins in structural groups, for testing the optimal sample conditions (e.g.pH and salt concentra-tion) and for choosing more structured proteins to high throughput production for three-dimensional structure de-termination by NMR spectroscopy or X-ray crystallogra-phy. One step in target selection which limits the number of working proteins is the solubilization and formation of well-diffracting crystals and good NMR spectra (Christen-datet al., 2000). The main reason for this limitation may be the presence of unstructured regions in the proteins. In fact, the number of deposits in the protein data bank decreases steeply when the amount of unstructured regions in pro-teins is higher than 10% (Prestegard et al., 2001). The PASSNMR program, used in conjunction with the rifam-picin protocol (Galvão-Bottonet al., 2003; Almeidaet al., 2001), can provide important information on the amount of protein secondary structure within a few days of protein ex-pression, small growth media volumes and easy and rapid NMR methods. This information can be used not only to se-lect more structured targets for three-dimensional structure determination, but also to test better sample preparation conditions to increase the solubility and decrease the flexi-bility of unstructured regions of the proteins under investi-gation.
There are several advantages of using the PASSNMR program over other current methodologies. Wishartet al.
(1991a,b) analyzed the prediction made from circular dichroism (CD) data for 14 proteins and found about about 32% of precision fora-helix, and a level of precision com-parable to that of the PASSNMR program forb-structure. In addition, CD spectroscopy requires pure protein samples while PASSNMR prediction can be obtained without pro-tein purification, making PASSNMR useful in target selec-tion for structural proteomics.
Many algorithms have been developed for the theo-retical prediction of the protein secondary structure (Liuet al., 2004; Jones, 1991a,b; Rychlewskiet al., 1999; Thomp-son and Goldstein, 1997; Sander and Schneider, 1991) and although most of these algorithms are very accurate and useful, they provide no information concerning the real state of the sample because this can be modified by chang-ing the conditions of the medium (e.g.pH, concentration of ligands, ionic strength and temperature), so methods such as PASSNMR, based on experimental data, may be more reliable than the use of theoretical algorithms.
The use of chemical shift dispersion to perform sec-ondary structure prediction is not new and has been shown to be very reliable (Ayerset al., 1999; Ösapay and Case,
1994; Spera and Bax, 1991; Wishartet al., 1991a,b;
Corni-lescuet al., 1991). Indeed, the use of the chemical shift
in-dex (CSI) as restrains for structure calculation has been considered and is a powerful tool to this end (Cornilescuet al., 1991). However, chemical shift assignments are
re-quested by all methods based on CSI. Although PASSNMR is less precise than some CSI methods, it has a great advan-tage that if it is used together with rifampicin protocol (Galvão-Botton et al., 2003; Almeidaet al., 2001) both
chemical shift assignment and protein purification are un-necessary. Prestegard et al. (2001) proposed the use of
NMR as a tool for target selection for structural proteomics and, as mentioned above, the PASSNMR program can be used for structure proteomics without the need for protein purification because PASSNMR predictions can be made with the same samples used to test the expression of the proteins. This is very useful when a fast screening is re-quired for choosing more structured proteins, such as in the selection of targets for structural proteomics.
Abbreviations
HSQC: Heteronuclear Single Quantum Coherence; PASSNMR: Prediction of the Amount of Secondary Struc-ture by NMR; PERL: Practical Extraction and Report Lan-guage; PDB: Protein Data Bank.
Acknowledgments
This work was supported by International Center of Genetic Engineering and Biotechnology (ICGEB, Trieste, It) and the Brazilian agencies Fundação de Amparo à Pes-quisa do Estado do Rio de Janeiro (FAPERJ), Centro de Apoio à Pesquisa (CAPES), Conselho Nacional de Pesqui-sa (CNPq) and Projeto Nacional de Excelência (PRONEX). We thank Professor Jerson Silva for discussion and support and also Dr. Jon Lapham and Dr. Alvicler Magalhães for discussion on Perl programming.
References
RJ and Valente AP (2001) Selectively labeling the hetero-logous protein inEscherichia colifor NMR studies: A strat-egy to speed up NMR spectroscopy. J Magn Reson 148:142-146.
Almeida MS, Cabral KM, Kurtenbach E, Almeida FCL and Va-lente AP (2002) Solution structure of Pisum sativum
defensin 1 by high resolution NMR: Plant defensins, identi-cal backbone with different mechanisms of action. J Mol Biol 315:749-757.
Altschul SF, Gish W, Mille W, Myers EW and Lipman DJ (1990) Basic local alignment search tool. J Mol Biol 215:403-410. Anderson TW and Finn JD (1996) The New Statistical Analysis of
Data. Springer-Verlag, New York, 346 pp.
Ayers DJ, Gooley PR, Widmer-Cooper A and Torda AE (1999) Enhanced protein fold recognition using secondary structure information from NMR. Protein Science 8:1127-1133. Ando I, Saito H, Tabeta R, Shoji A and Ozaki T (1984)
Conforma-tion-dependent13C NMR chemical shifts of poly(L-alanine)
in the solid state: FPT INDO calculation of N-acetyl-N’-me-thyl-L-alanine amide as a model compound of poly(L-ala-nine). Macromolecules 17:457-461.
Bhaduri A, Ravishankar R and Sowdhamini R (2004) Conserved spatially interacting motifs of protein superfamilies: Appli-cation to fold recognition and function annotation of ge-nome data. Proteins 54:657-670.
Brenner SE (2000) Target selection for structural genomics. Na-ture Struct Biol 7:967-969.
Bujnicki JM, Rotkiewicz P, Kolinski A and Rychlewski L (2001) Three-dimensional modeling of the I-TevI homing endo-nuclease catalytic domain, a GIY-YIG superfamily member, using NMR restraints and Monte Carlo dynamics. Protein Eng 14:717-721.
Campos-Olivas R, Newman JL, Ndassa Y and Summers MF (2000)1H,13C and15N chemical shift assignments of the
capsid protein from Rous sarcoma virus. J Biomol NMR 15:267-268.
Chambers G, Lawrie L, Cash P and Murray GI (2000) Proteomics: A new approach to the study of disease. J Pathol 192:280-288.
Christendat D, Yee A, Dharamsi A, Kluger Y, Savchenko A, Cort JR, Booth V, Mackereth CD, Saridakis V, Ekel I, Kozlov G, Maxwell KL, Wu N, McIntosh LP, Gehring K, Kennedy MA, Davidson AR, Pai EF, Gerstein M, Edwards AM and Arrowsmith CH (2000) Structural proteomics of an archaeon. Nature Struct Biol 7:903-909.
Cornilescu G, Delaglio F and Bax A (1999) Protein backbone an-gle restraints from searching a database for chemical shift and sequence homology. J Biomol NMR 13:289-302. Galvão-Botton LM, Katsuyama AM, Guzzo CR, Almeida FCL,
Farah CS and Valente AP (2003) High-throughput screening of structural proteomics targets using NMR. FEBS Lett 552:207-213.
Jones DT (1999a) Protein secondary structure prediction based on position-specific scoring matrices. J Mol Biol 292:195-202. Jones DT (1999b) GenTHREADER: An efficient and reliable
protein fold recognition method for genomic sequences. J Mol Biol 287:797-815.
Jung JW and Lee W (2004) Structure-based functional discovery of proteins: Structural proteomics. J Biochem Mol Biol 37:28-34.
Kabsch W and Sander C (1983) Dictionary of protein secondary structure: Pattern recognition of hydrogen-bonded and geo-metrical features. Biopolymers 22:2577-2637.
Li QZ an Lu ZQ (2001) The prediction of the structural class of protein: Application of the measure of diversity. J Theor Biol 213:493-502.
Linding R, Jensen LJ, Diella F, Bork P, Gibson TJ and Russel RB (2003) Protein disorder prediction: Implications for struc-tural proteomics. Structure (Camb) 11:1453-1459.
Liu X, Zhang LM and Zheng WM (2004) Prediction of protein secondary structure based on residue pairs. J Bioinform Comput Biol 2:343-352.
Meiler J, Peti W and Griesinger C (2000) DipoCoup: A versatile program for 3D-structure homology comparison based on residual dipolar couplings and pseudocontact shifts. J Biomol NMR 17:283-294.
Moreau VH, daSilva AC, Siloto RMP, Valente AP, Leite A and Almeida FCL (2004) The bZIP region of the plant transcrip-tion factor opaque-2 forms stable homodimers in solutranscrip-tion and retains its helical structure upon subunit dissociation. Biochemistry 43:142-146.
Onyango P (2004) The role of emerging genomics and proteomics technologies in cancer drug target discovery. Curr Cancer Drug Tergets 4:111-124.
Ösapay K and Case DA (1994) Analysis of proton chemical shifts in regular secondary structure of proteins. J Biomol NMR 4:215-230.
Pardi A, Wagner G and Wüthrich K (1983) Protein conformation and proton nuclear magnetic resonance chemical shifts. Eur J Biochem 137:445-454.
Pastore A and Saudek V (1990) The relationship between chemi-cal shift and secondary structure in proteins. J Magn Reson 90:165-176.
Pellecchia M, Guntert P, Glockshuber R and Wüthrich K (1998) Sequence-specific1H,15N, and13C assignments of the
peri-plasmic chaperone FimC from Escherichia coli. J Biomol NMR 11:229-230.
Prestegard JH, Valafar H, Glushka J and Tian F (2001) Nuclear magnetic resonance in the era of structural genomics. Bio-chemistry 40:8677-8685.
Rychlewski L, Zhang B and Godzik A (1999) Functional insights from structural predictions: Analysis of theEscherichia coli
genome. Protein Science 8:614-624.
Saito H (1986) Conformation-dependent13C chemical shifts: A
new means of conformational characterization as obtained by high-resolution solid-state13C NMR. Magn Reson Chem
24:835-852.
Sander C and Schneider R (1991) Database of homology-derived protein structures and the structural meaning of sequence alignment. Proteins 9:56-68.
Seavey BR, Farr EA, Westler WM and Markley L (1991) A rela-tional database for sequence-specific protein NMR data. J Biomol NMR 1:217-236.
Serber Z, Keatinge-Clay AT, Ledwidge R, Kelly AE, Miller SM and Dötsch V (2001) High-resolution macromolecular NMR spectroscopy inside living cells. J Am Chem Soc 123:2446-2447.
Spera S and Bax A (1991) Empirical correlation between protein backbone conformation and C.alpha. and C.beta.13C nuclear
magnetic resonance chemical shifts. J Am Chem Soc 113:5490-5492.
Tjandra N and Bax A (1997) Large variations in13Cachemical
shift anisotropy in proteins correlate with secondary struc-ture. J Am Chem Soc 119:9576-9577.
Thompson MJ and Goldstein RA (1997) Predicting protein sec-ondary structure with probabilistic schemata of evolutio-narily derived information. Protein Science 6:1963-1975.
Williamson M (1990) Secondary-structure dependent chemical shifts in proteins. Biopolymers 29:1423-1431.
Wishart DS, Sykes BD and Richards FM (1991a) Simple tech-niques for the quantification of protein secondary structure by1H NMR spectroscopy. FEBS Lett 293:72-80.
Wishart DS, Sykes BD and Richards FM (1991b) Relationship between nuclear magnetic resonance chemical shift and pro-tein secondary structure. J Mol Biol 222:311-333.
Wishart DS and Sykes BD (1994) The13C chemical-shift index: A simple method for the identification of protein secondary structure using 13C chemical-shift data. J Biomol NMR
4:171-180.
Wishart DS, Sykes BD and Richards FM (1992) The chemical shift index: A fast and simple method for the assignment of protein secondary structure through NMR spectroscopy. Biochemistry 31:1647-1651.
Internet Resources
The PASSNMR program is available for academic use at the homepage of the Centro Nacional de Ressonância Mag-nética Nuclear de Macromoléculas - CNRMN (http://cnrmn. bioqmed.ufrj.br).