Introduction
Paralympic track and field events are multi-disability sports1, with different types of disciplines and different demands on the body. Good quality individualized nutritional counseling can help athletes to maximize their performance. However, there is no single diet that can meet all athletes’ needs at all times2.
A good diet supports physical training, reduces the occurrence of disease and injuries and supports physical training2.Athletes require a diet that can provide enough energy to meet the demands of their training, and avoid any reduction in their performance3.
In addition, the distribution of macronutrients has to be planned to guarantee the availability of substrates to regulate metabolic pathways, and modulate the muscle-skeleton adaptations induced by physical training4, with athletes continuously monitoring and adjusting their macronutrient consumption in order to optimize their athletic performance5, 6.
Although the latest scientific knowledge on nutrition allows diets to be customized and adapted to the peculiarities of each sport/discipline and period of training, athletes frequently do not consume diets that are in accordance with these nutritional recommendations7, 8.
In Paralympic sports, there is a lack of knowledge about the athletes´ nutritional needs due to the heterogeneity of their disabilities, and also about this population´s food intake9.
Therefore, it is important to conduct new studies that identify the nutritional and anthropometric profile of this population in different periods of a competitive season.
The objectives of this study were: a) to present individual variations between the evaluated periods of the sum of skinfolds (SSF), of body mass (BM) and energy intake of Paralympic track and field athletes; b) to evaluate actual macronutrient intakes and compare these with the recommended levels for athletes in each analyzed period.
Methods
Experimental design and ethical aspects
The study was approved by the Committee of Ethics in Research of the Federal University of Sao Paulo (#0294/11). All athletes were informed about the objectives of the research and all signed the free and informed consent form.
Data were collected during three consecutive “weeks of evaluation and training” (Figure 1) organized by the Brazilian Paralympic Committee, quarterly, throughout the annual cycle of training. The track and field Paralympic team was evaluated
Original Article (short paper)
Individual study of anthropometric variation, energy and macronutrients intakes
in Paralympic Track and Field athletes in different phases of the season
Dayane Ferreira Rodrigues2,4, Andressa Silva1,2, Claudia Ridel Juzwiak2,3, Daniel Paduan Joaquim2,3, João Paulo
Pereira Rosa1,2, Mário Antônio de Moura Simim1,2, Amaury Wagner Veríssimo2, Ciro Winckler2,3, Sergio Tufik4,
Marco Túlio de Mello1,2
1Universidade Federal de Minas Gerais, UFMG, Escola de Educação Física, Fisioterapia e Terapia
Ocupacional, Belo Horizonte, MG, Brazil; 2Academia Paralímpica Brasileira/Comitê Paralímpico Brasileiro,
Brasília, Brazil; 3Universidade Federal de São Paulo, UNIFESP, Departamento de Ciências do Movimento
Humano, Baixada Santista, SP, Brazil; 4Universidade Federal de São Paulo,UNIFESP, Departamento
de Psicobiologia, Centro de Estudos em Psicobiologia e Exercício, São Paulo, SP, Brazil
Abstract — Aims: a) to measure individual variations in body mass (BM), sum of skinfolds (SSF) and energy intake of Paralympic track and field athletes b) to evaluate whether individual consumption of macronutrients meets recommended levels in three distinct periods of training. Methods:Ten Paralympic track and field athletes were evaluated during three periods: 1) end of season, 2) after vacation, and 3) preparation for the Paralympic Games London 2012. Food history and the 24-hour Dietary Recall methods provided information on daily food intake. To assess changes in body composition, we measured skinfolds and BM. Descriptive statistics were utilized to describe individual results. Results:BM varied among athletes and phases, but most (n=8) had higher SSF after vacation. Four athletes reported an increase in energy intake of more than 500 kcal during their vacation period, while eight athletes reported maintaining their intake in the preparatory phase for the competition. Carbohydrate intake was adequate for most athletes in the end of season period and in the preparatory phase for competition, and most athletes had reduced lipid intake after vacation and in the preparatory phase. Conclusion:We observed important variations in BM and SSF, in food intake and macronutrients between the three evaluated periods. The nutritional status of the athletes suggests that inadequacies that might affect the performance of sprinters and middle-distance runners are more likely to occur during the preparatory period before competitions.
by an interdisciplinary group of professionals.
Figure 1. Experimental Design of the Study
Participants
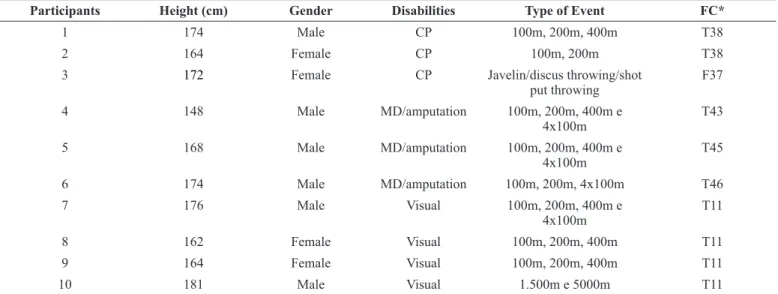
Ten paralympic athletes (six men and four women), of the Brazilian track and field team, all with experience in international competitions participated in this study. The characteristics of each participant are described in Table 1.
Among the three athletes with cerebral palsy, two had spasticity (participants 1 and 2), and one atony (participant 3). One of the three amputee athletes had an amputation representing less than 2% of BM (participant 6) and two had amputations representing more than 10% of total BM (participants 4 and 5) according to Osterkamp10, while the
four visually impaired athletes were totally blind (participants 7, 8, 9 and 10).
Table 1. Distribution of the athletes by gender, height, disabilities, specialty and sporting classification.
Participants Height (cm) Gender Disabilities Type of Event FC*
1 174 Male CP 100m, 200m, 400m T38
2 164 Female CP 100m, 200m T38
3 172 Female CP Javelin/discus throwing/shot
put throwing F37
4 148 Male MD/amputation 100m, 200m, 400m e
4x100m T43
5 168 Male MD/amputation 100m, 200m, 400m e
4x100m T45
6 174 Male MD/amputation 100m, 200m, 4x100m T46
7 176 Male Visual 100m, 200m, 400m e
4x100m T11
8 162 Female Visual 100m, 200m, 400m T11
9 164 Female Visual 100m, 200m, 400m T11
10 181 Male Visual 1.500m e 5000m T11
CP = Cerebral palsy; MD = Motor disability; FC= Functional classification; T= track; F=field; m=meters.
Procedures
Evaluation of Food Intake
Food intake information was obtained using the food history and the 24-hour dietary recall methods. Athletes described in detail all food, beverages and supplements consumed11.
Athletes reported the size of the consumed portions with the help of a photograph food register12 with the exception of the visually impaired athletes, who were helped by their guides whenever necessary. Portions recorded were later compared with standard portions as proposed by Medeiros, Pfrimer, Tremeschin, Molina, and Chiarello13, and converted to grams14. The software Avanutri Revolution 4.0® was used to calculate energy intake (kcal/day), and macronutrient intake: carbohydrates (g/kg/day), proteins (g/kg/day) and lipids (% total energy per day). Carbohydrate intakes were compared to the proposed recommendations by Slater and Phillips15 for thrower and sprinters and those by Thomas, Erdman and
Burke16 for 1500/5000m runners. Protein and lipid intake were compared to the proposed recommendations by Thomas, Erdman and Burke16 for all athletes.
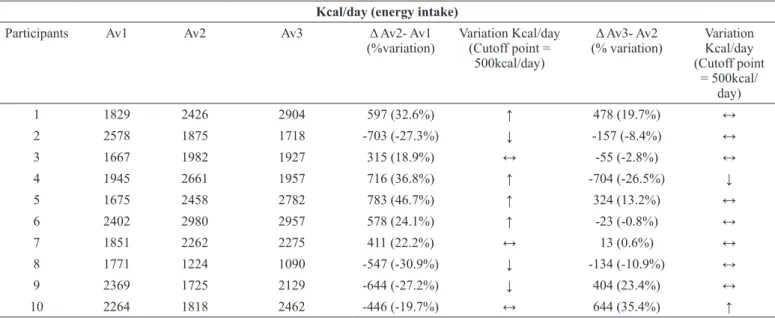
A cutoff point of 500kcal/day was used to characterize variation in energy intake(kcal/day)17.
Anthropometry and body composition
The BM(kg) was measured using an electronic scale with a precision of 0.01 kg and height (cm) was measured using a stadiometer with an accuracy of 1 cm. Athletes were evaluated standing up, with their feet together and head placed in the Frankfort plane. For the amputatee athlete (participant 4) this measurement was done without the use of prosthetics.
measured on the dominant side. Skinfolds (triceps, subscapular, biceps, iliac crest, front thigh and medial calf) were measured with the procedures proposed by the International Society for the Advancement of Kinanthropometry18, while mid-axillary and chest skinfolds were measured in accordance to Heyward and Stolarczyk19 and the results are shown in SSF (mm). For the bi-amputatee athlete (participant 4) only eight skinfolds were assessed (exclusion of the medial calf skinfold).
The assessment of changes in lean mass and body fat were based on the interpretation proposed by Slater20 that combines
the information about the variation in BM and SSF to suggest a potential gain or loss of lean mass or body fat.
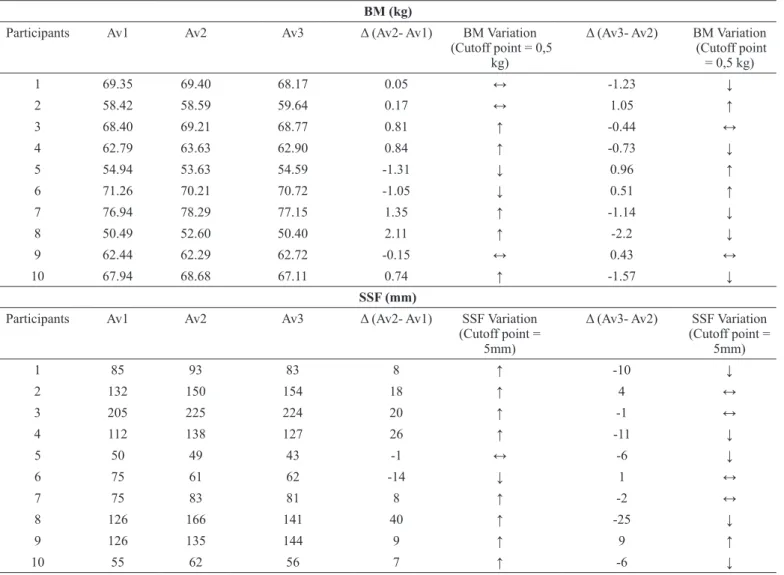
We utilized a cutoff point of 0.5 kg to characterize change in BM21, 22 and of 5mm to characterize any change in SSF.
Statistical Analysis
The studied sample showed heterogeneity as to the type of disability and sport discipline therefore we analyzed
individual data using the SPSS Statistics software, version 20.0 for descriptive statistics. Average ± standard deviation, absolute values, relative values and their differences (delta) were used to describe the results. Due to the small sample size, the nonparametric Friedman test was used to verify differences among the evaluation periods. The results were described in the form of the median, a robust indicator of central tendency and less sensitive to extreme scores (50th percentile), 25th and 75th percentiles. The level of significance was set at 5% (p≤0.05).
Results
Athletes were 29.1±6.06 years old and reported a habitual daily training load of 4.25±1.18 hours/day.
Table 2 shows BM and SSF, respectively, in each evaluated period, for each athlete, as well as the individual variation of these variables between periods 1 and 2; and 2 and 3, according to the established cutoff points.
Table 2. Individual analysis of BM and SSF in each evaluated period and their variation between these periods
BM (kg)
Participants Av1 Av2 Av3 Δ (Av2- Av1) BM Variation
(Cutoff point = 0,5 kg)
Δ (Av3- Av2) BM Variation
(Cutoff point = 0,5 kg)
1 69.35 69.40 68.17 0.05 ↔ -1.23 ↓
2 58.42 58.59 59.64 0.17 ↔ 1.05 ↑
3 68.40 69.21 68.77 0.81 ↑ -0.44 ↔
4 62.79 63.63 62.90 0.84 ↑ -0.73 ↓
5 54.94 53.63 54.59 -1.31 ↓ 0.96 ↑
6 71.26 70.21 70.72 -1.05 ↓ 0.51 ↑
7 76.94 78.29 77.15 1.35 ↑ -1.14 ↓
8 50.49 52.60 50.40 2.11 ↑ -2.2 ↓
9 62.44 62.29 62.72 -0.15 ↔ 0.43 ↔
10 67.94 68.68 67.11 0.74 ↑ -1.57 ↓
SSF (mm)
Participants Av1 Av2 Av3 Δ (Av2- Av1) SSF Variation
(Cutoff point = 5mm)
Δ (Av3- Av2) SSF Variation
(Cutoff point = 5mm)
1 85 93 83 8 ↑ -10 ↓
2 132 150 154 18 ↑ 4 ↔
3 205 225 224 20 ↑ -1 ↔
4 112 138 127 26 ↑ -11 ↓
5 50 49 43 -1 ↔ -6 ↓
6 75 61 62 -14 ↓ 1 ↔
7 75 83 81 8 ↑ -2 ↔
8 126 166 141 40 ↑ -25 ↓
9 126 135 144 9 ↑ 9 ↑
10 55 62 56 7 ↑ -6 ↓
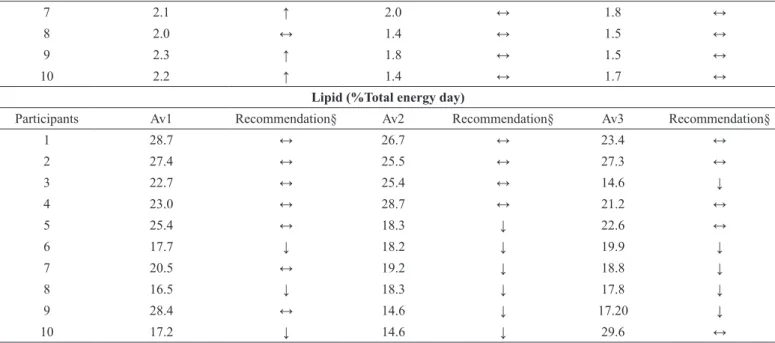
Table 4 presents the macronutrients (carbohydrates, proteins and lipids), in each evaluated period, and the level of intake (below, adequate or above recommended values).
Table 5 shows the comparison of BM, SSF, kcal, carbohydrate, protein and lipid intake, among the three evaluation periods. The comparisons were not statistically significant for any of the variables. Table 3 describes the energy intake in each evaluated period, variation (absolute and relative) between evaluations 1 and 2, and 2 and 3.
Table 3. Individual analysis of energy intake at each evaluated period and their variation between these periods. Kcal/day (energy intake)
Participants Av1 Av2 Av3 Δ Av2- Av1
(%variation) Variation Kcal/day(Cutoff point = 500kcal/day)
Δ Av3- Av2
(% variation) Variation Kcal/day (Cutoff point
= 500kcal/ day)
1 1829 2426 2904 597 (32.6%) ↑ 478 (19.7%) ↔
2 2578 1875 1718 -703 (-27.3%) ↓ -157 (-8.4%) ↔
3 1667 1982 1927 315 (18.9%) ↔ -55 (-2.8%) ↔
4 1945 2661 1957 716 (36.8%) ↑ -704 (-26.5%) ↓
5 1675 2458 2782 783 (46.7%) ↑ 324 (13.2%) ↔
6 2402 2980 2957 578 (24.1%) ↑ -23 (-0.8%) ↔
7 1851 2262 2275 411 (22.2%) ↔ 13 (0.6%) ↔
8 1771 1224 1090 -547 (-30.9%) ↓ -134 (-10.9%) ↔
9 2369 1725 2129 -644 (-27.2%) ↓ 404 (23.4%) ↔
10 2264 1818 2462 -446 (-19.7%) ↔ 644 (35.4%) ↑
Δ: delta; ↑ variation of kcal/day above 500 kcal/day; ↓ variation of kcal/day below 500 kcal/day; ↔ no variation; Av1= end of season; Av2= post-vacation; Av3 = preparation for the Paralympic Games.
Table 4. Comparison of the carbohydrate, protein and lipid intakes with the recommended values, for each evaluated period, per athlete.
Carbohydrate (g/kg/day)
Participants Av1 Recommendation Av2 Recommendation Av3 Recommendation
1 2.5 ↓* 4.0 ↔* 5.6 ↔*
2 6.6 ↔* 4.4 ↔* 4.0 ↔*
3 3.2 ↓* 3.7 ↓* 4.4 ↔*
4 4.4 ↔* 5.6 ↔* 4.7 ↔*
5 4.0 ↔* 7.3 ↑* 6.5 ↔*
6 5.4 ↔* 7.2 ↑* 6.9 ↔*
7 2.7 ↓* 3.8 ↓* 4.2 ↔*
8 5.3 ↔* 3.4 ↓* 3.0 ↓*
9 4.5 ↔* 4.2 ↔* 5.1 ↔*
10 4.7 ↓** 4.3 ↓** 4.8 ↓**
Protein (g/kg/day)
Participants Av1 Recommendation‡ Av2 Recommendation‡ Av3 Recommendation‡
1 2.2 ↑ 2.4 ↑ 2.5 ↑
2 1.4 ↔ 1.6 ↔ 1.1 ↓
3 1.5 ↔ 1.6 ↔ 1.6 ↔
4 1.5 ↔ 1.8 ↔ 1.4 ↔
5 1.6 ↔ 2.1 ↑ 3.3 ↑
Discussion
This study evaluated individual variations in BM and SSF and the energy intakes of Paralympic track and field athletes; in addition, we assessed the levels of macronutrient intakes, comparing them to the recommended levels for the athletes at each period.
Few studies have evaluated the body composition of athletes with disabilities due to the lack of a standard method for this population20. Van de Vliet, Broad and Strupler23 suggest the use of SSF (mm) in disabled athletes, avoiding the use of nonspecific predictive equations and allowing the follow up during the evaluated periods.
Furthermore, nutritional recommendations for these para-athletes have not yet been well-defined, with the present recommendations being based on able bodied athletes adapted for para-athletes considering specific aspects of the disabilities functionality, the clinical conditions associated to the disability, and the particular sporting discipline17, 24,25. In this study, we point out the importance of joint evaluation of BM and SSF to understand and follow changes in the body mass and body composition of the athletes.
Energy intake varied greatly between evaluation periods. In evaluation 2, the higher energy intake reported by some athletes in relation to evaluation 1 might reflect consumption during the post-vacation period. However, the reported energy
7 2.1 ↑ 2.0 ↔ 1.8 ↔
8 2.0 ↔ 1.4 ↔ 1.5 ↔
9 2.3 ↑ 1.8 ↔ 1.5 ↔
10 2.2 ↑ 1.4 ↔ 1.7 ↔
Lipid (%Total energy day)
Participants Av1 Recommendation§ Av2 Recommendation§ Av3 Recommendation§
1 28.7 ↔ 26.7 ↔ 23.4 ↔
2 27.4 ↔ 25.5 ↔ 27.3 ↔
3 22.7 ↔ 25.4 ↔ 14.6 ↓
4 23.0 ↔ 28.7 ↔ 21.2 ↔
5 25.4 ↔ 18.3 ↓ 22.6 ↔
6 17.7 ↓ 18.2 ↓ 19.9 ↓
7 20.5 ↔ 19.2 ↓ 18.8 ↓
8 16.5 ↓ 18.3 ↓ 17.8 ↓
9 28.4 ↔ 14.6 ↓ 17.20 ↓
10 17.2 ↓ 14.6 ↓ 29.6 ↔
Av1= end of season; Av2= post-vacation; Av3 = preparation for the Paralympic Games ; ↑ above recommended; ↓ below recommended; ↔ within recommenda-tion;* Recommended according to Slater and Phillips15 for thrower and sprinters: <4 below; 4 a 7 adequate; >7 above ; **Recommendation according to
Thom-as, Erdman and Burke16 for 1500/5000m runner: <6 below; 6 a 10 adequate; >10 above; ; ‡Recommendation according to Thomas, Erdman and Burke16<1.2
below; 1.2 a 2 adequate; >2 above; §Recommendation according to Thomas, Erdman and Burke 16<20% below; 20% a 35% adequate; >35% above.
Table 5. BM, SSF, kcal and macronutrients intake among three evaluations. Body
Composition
Av1 Av2 Av3 Friedman
(p value)
25% median 75% 25% median 75% 25% median 75%
BM (kg) 57.55 65.32 69.82 57.34 66.15 69.60 58.37 65.00 69.25 0.49
SSF (mm) 70 98 127 61 114 154 60 105 146 0.08
Nutritional Variables
Kcal 1747 1898 2377 1794 2122 2508 1874 2202 2812 0.49
Carbohydrate 3.0 4.4 5.3 3.7 4.2 6.0 4.1 4.7 5.8 0.27
Protein 1.5 1.8 2.2 1.4 1.7 2.0 1.4 1.5 1.9 0.58
Lipid 17.5 22.8 27.6 17.3 18.7 25.8 17.6 20.5 24.3 0.49
intake did not explain all the BM and SSF variations, which perhaps reflects the limitations of the methods of food intake assessment used in the study. Although five athletes (participants 3, 4, 7, 8 and 10) increased their BM in this second evaluation, eight athletes (participants 1, 2, 3, 4, 7, 8, 9 and 10) increased their SSF. This is a frequently observed situation (increased food intake and decreased energy expenditure) when athletes return from vacation and may explain the observed alterations in BM and SSF.
In period 2 the majority of athletes had increased BM and/or SSF. These changes can affect performance. Increased subcutaneous corporal fat, for example, can work as a barrier to heat loss. O`Connor and colleagues26 pointed out that in marathon athletes increased body fat might negatively impact their performance, especially as heat exchange becomes more important with the increased distance.
In addition, another study showed that excessive fat mass negatively affects performance in other sports27, such as exercise with gravitational load (e.g., running), as demonstrated in the case of participant 10 in the present study.
The energy deficit reported by some athletes in evaluation 2 might indicate that they were already making adjustment to try to control their BM and/or body composition (participants 2, 8 and 9) although no results among their anthropometric measurements were observed. Our attention was caught by the magnitude of the deficit reported by some athletes (participants 2 and 9). If this was sustained in the long term it might negatively impact their energy availability. According to Mountjoy, Sundgot-Borgen, Burke, Carter, Constantini, Lebrun et. al3, a negative energy balance in athletes may lead to Syndrome Relative Energy Deficiency in Sport (RED-S). In this syndrome, several systems in the human body such as the endocrine, metabolic, hematological, psychological, cardiovascular, gastrointestinal, immune and skeletal may be affected. This condition leads to changes in glycogen stores, muscle strength, aerobic and anaerobic performance, increasing risk of injuries and reducing response to training. Also, some psychological variables may suffer modification including impairment of judgement, decreased coordination and concentration and increased irritability and propensity to depression3.
From the second to the third evaluation, all athletes, independently of their energy intake report, maintained or reduced their SSF, the results in relation to BM and energy intake were not so clear, athlete 10, for example, reduced their BM and SSF and demonstrated a potential loss of lean mass, although they increased energy intake. This data suggests an effect of increased exercise energy expenditure on body composition. A decrease in lean mass can have a possible positive impact on middle-distance runner performance, according to Mooses, Jürimäe , Mäestu , Purge , Mooses and Jürimäe28.
Longitudinal analysis showed that only three athletes (participants 5, 6 and 8), all sprinters, managed to increase their lean mass (or “recover” its decrease) and lose body fat (or “recover” its increase) during the last evaluated period.
Two visually impaired sprinters (participants 7 and 9) lost lean body mass and gained body fat in the preparatory period for the Paralympic Games, which could, if maintained, negatively affect performance. Barbieri, Zaccagni, Babić, Rakovac, Mišigoj-Duraković and Gualdi-Russo29 highlighted that sprinters showed a relationship between better personal times and greater fat-free BM.
Athlete 3 gained lean mass and body fat, with a slight increase in energy intake (315 kcal/day) in relation to the 1st evaluation. In the last evaluation, the athlete maintained lean mass, with no reduction in SSF. However, for track and field throwing events an increase in body fat does not have a negative influence30. A study suggested that an increase in fat free mass
did not improve shot-put performance in this type of event31. In the present study, when the median data of each period was observed, carbohydrate and protein intakes were in accordance with the recommended values. However, there were deficiencies in terms of macronutrient intake for some athletes when individual data was analyzed. Therefore, we emphasize the importance of analyzing each athlete individually, as when all athletes were analyzed in the same group in each period, these problems were not identified, because they do not take into account the specificity of the event nor the type of disability.
The macronutrient composition of meals can affect the BM as well as SSF results. For example, athlete 5, in the second evaluated period, lost lean mass without modification of body fat, concomitantly with an increased energy and carbohydrate intake close to the upper recommended values, with low lipid intake and protein intake above the recommended level. In the last evaluation, the athlete gained lean mass and lost body fat, and reduced carbohydrate intake, maintaining it, however, within the recommended limits. Protein intake was again above the recommended level.
The main objective of sprinter athletes is to gain muscle mass and strength. In many cases, these athletes believe that the consumption of protein should be the main focus of their diet2. There is novel evidence that suggests higher protein intakes (>3.0 g/kg/d) may have positive effects on body composition in resistance-trained individuals (i.e., promote loss of fat mass)32. Although protein plays an important role in an athlete’s diet, guidelines in relation to increasing or preserving skeletal muscle mass through protein consumption are complex and depend on multifactorial interactions including the source of the protein, timing, amount, and macronutrient co-ingestion33. Moreover, it seems that protein ingestion above the recommended values does not bring any benefit to a runner’s athletic performance34.
competitions, lipid intake may be limited to reduce energy intake and, consequently, to reach the desired body composition5.
Carbohydrate intake is fundamental to the optimization of athletic performance35. Besides consuming an adequate daily amount of carbohydrates according to training demands, its distribution during the day, with emphasis pre, during and post-training and recovery, can optimize performance/recovery15, 16. Several factors may explain non-adherence to nutritional recommendations by athletes, including the fact that the results of new studies with up to date recommendations do not always reach them quickly. Furthermore, it is not uncommon for athletes to be influenced by information in social media from colleagues and non-qualified professionals. Moreover, very rigid diets which do not take into consideration cultural aspects can lead athletes to quickly reject them36.
Nutritional educational strategies to develop the athletes’ autonomy in choosing healthy food are important steps to improve athletes’ diets and thus optimizing their performance36-38.
Educational strategies involving an understanding of athletes´ food beliefs and practices which encourage them to focus on their own diets have been suggested as being most effective38.
Therefore, to optimize athletic performance it is necessary to establish a proper eating plan with short and long term goals, using good nutritional practice to increase muscle mass and/ or reduce body fat/weight in a safe and effective manner16.
The present study provides useful information for dietitians on how to analyze information and perform dietetic adjustments, as well as for coaches and physical trainers to provide the necessary adjustments in the training program, in a customized way. In this way, increased body fat and decreased fat-free mass can be avoided, maintaining or improving the physical performance of para-athletes. Conducting periodical assessments to identify changes in body composition , as well as in the energy and macronutrient intake of athletes during different periods, can help to produce a better nutritional strategy, particularly during preparatory and competition periods.
The study limitations are the lack of monitoring of training loads and energy expenditure, which would allow a more detailed analysis of the anthropometric measurements and food intake. In addition, the authors suggest future research uses more evaluation points during training programs to investigate anthropometric, energy and macronutrient intake variables.
Conclusions
We observed important variations in BM and SSF, and in food and macronutrient intake between the three evaluated periods. The nutritional status identified suggests inadequacies that might affect the athletic performance of sprinters and middle-distance runners, particularly during the preparatory periods before competitions.
These results highlight the importance of anthropometric and dietetic evaluations in the monitoring of athletes. In the
case of Paralympic athletes, individual analysis allows for more tailored adjustments to be made to meet specific demands.
Acknowledgments
The authors express their gratitude to the Associação Fundo de Incentivo à Pesquisa (AFIP), the Centro de Estudos em Psicobiologia e Exercício (CEPE), the Centro Multidisciplinar em Sonolência e Acidentes (CEMSA), the Conselho Nacional de Desenvolvimento Científico e Tecnológico (CNPq), the Coordenação de Aperfeiçoamento de Pessoal de Nível Superior (CAPES), the Fundação de Amparo a Pesquisa de Minas Gerais (FAPEMIG) the Comitê Paralímpico Brasileiro (CPB), the Academia Paralímpica Brasileira (APB),and the athletes who participated in this study.
References
1. Winckler C. Atletismo. In: Atheneu (ed) Esporte Paralímpico. São Paulo: Atheneu, 2012, pp.65-74. 2. Burke L, Maughan R, Shirreffs S. The 2007 IAAF
consensus conference on nutrition for athletics. Taylor & Francis, 2007.
3. Mountjoy M, Sundgot-Borgen J, Burke L, Carter S, Constantini N, Lebrun C, et al. Authors’ 2015 additions to the IOC consensus statement: Relative Energy Deficiency in Sport (RED-S). BMJ Publishing Group Ltd and British Association of Sport and Exercise Medicine, 2015. 4. Close GL, Hamilton DL, Philp A, Burke LM, Morton
JP. New strategies in sport nutrition to increase exercise performance. Free Radic Biol Med. 2016; 98: 144-158. 5. Stellingwerff T, Maughan RJ, Burke LM. Nutrition for
power sports: middle-distance running, track cycling, rowing, canoeing/kayaking, and swimming. J Sports Sci. 2011; 29: S79-S89.
6. Arciero PJ, Miller VJ, Ward E. Performance enhancing diets and the prise protocol to optimize athletic performance. J Nutr Metab. 2015; 2015.
7. Panza VP, Coelho MSPH, Di Pietro PF, Assis MAAd, Vasconcelos FdAGd. Consumo alimentar de atletas: reflexões sobre recomendações nutricionais, hábitos alimentares e métodos para avaliação do gasto e consumo energéticos. Rev nutr. 2007: 681-692.
8. Devlin BL, Belski R. Exploring general and sports nutrition and food knowledge in elite male Australian athletes. Int J Sport Nutr Exerc Metab. 2015; 25: 225-232.
9. Crosland J, Broad E. Nutrition for disability athletes. Sport and Exercise Nutrition 2011: 200-209.
10. Osterkamp LK. Current perspective on assessment of human body proportions of relevance to amputees. J Am Diet Assoc. 1995; 95: 215-218.
12. SU-VI-MAX, Hercberg S, Deheeger M. Portions alimentaires: manuel photos pour l’estimation des quantités. SU-VI-MAX, 1994.
13. Medeiros J, Pfrimer K, Tremeschin M, Molina M, Chiarello PN, Nutrição E. Metabolismo–Consumo alimentar: Visualizando porções. Rio de Janeiro: Guanabara Koogan, 2007.
14. Pinheiro ABV, Lacerda EMdA, Benzecry EH, Gomes MCdS, Costa VMd. Tabela para avaliação de consumo alimentar em medidas caseiras. Atheneu, 2008.
15. Slater G, Phillips SM. Nutrition guidelines for strength sports: sprinting, weightlifting, throwing events, and bodybuilding. J Sports Sci. 2011; 29: S67-S77.
16. Thomas D, Erdman K, Burke L. American College of Sports Medicine Joint Position Statement. Nutrition and Athletic Performance. Med Sci Sports Exerc. 2016; 48: 543. 17. Broad E. Sports Nutrition for Paralympic Athletes. CRC
Press, 2014.
18. Marfell-Jones M, Stewart A, de Ridder J. International Society for the Advancement of Kinanthropometry. International standards for anthropometric assessment Potchefstroom (South Africa): International Society for the Advancement of Kinanthropometry. 2006.
19. Heyward VH and Stolarczyk LM. Avaliação da composição corporal aplicada. 2000.
20. Slater G. Assessing body composition of athletes. In: Press C (ed) Sports nutrition for paralympic athletes. Boca Raton: Taylor & Francis Group. 2014, pp.p. 189 - 216.
21. Cheuvront SN, Carter III R, Montain SJ, Sawka MN. Daily body mass variability and stability in active men undergoing exercise-heat stress. Int J Sport Nutr Exerc Metab. 2004; 14: 532-540.
22. Garthe I, Raastad T, Refsnes PE, Koivisto A, Sundgot-Borgen J. Effect of two different weight-loss rates on body composition and strength and power-related performance in elite athletes. Int J Sport Nutr Exerc Metab. 2011; 21: 97-104.
23. Van de Vliet P, Broad E, Strupler M. Nutrition, body composition and pharmacology. The Paralympic Athlete: Handbook of Sports Medicine and Science. 2011: 172-197. 24. Gomes AIdS, Ribeiro BG, Soares EdA. Nutritional
characterization of elite amputee soccer players. Rev Bras Med Esporte. 2005; 11: 11-16.
25. Crawshay S, Crosland J. 13 Practical Sports Nutrition Issues. Sports Nutrition for Paralympic Athletes. 2014: 217. 26. O’Connor H, Olds T, Maughan R. International Association
of Athletics Federations. Physique and performance for track and field events. J Sports Sci. 2007; 25.
27. Giampietro M, Ebner E, Bertini I. The clinical significance of body composition and anthropometric evaluation in athletes. Med J Nutrition Metab. 2011; 4: 93-97.
28. Mooses M, Jürimäe J, Mäestu J, Purge P, Mooses K and Jürimäe T. Anthropometric and physiological determinants of running performance in middle-and long-distance runners. Kineziologija. 2013; 45: 154-162.
29. Barbieri D, Zaccagni L, Babić V, Rakovac M, Mišigoj-Duraković M, Gualdi-Russo E. Body composition and size in sprint athletes. J Sports Med Phys Fitness. 2017. 30. Terzis G, Kyriazis T, Karampatsos G, Georgiadis G. Muscle
strength, body composition, and performance of an elite shot-putter. Int J Sports Physiol Perform. 2012; 7: 394-396. 31. Kyriazis T, Terzis G, Karampatsos G, Kavouras S,
Georgiadis G. Body composition and performance in shot put athletes at preseason and at competition. Int J Sports Physiol Perform. 2010; 5: 417-421.
32. Jäger R, Kerksick CM, Campbell BI, Cribb PJ, Wells SD, Skwiat TM, et al. International Society of Sports Nutrition Position Stand: protein and exercise. J Int Soc Sports Nutr. 2017; 14: 20.
33. Witard OC, Wardle SL, Macnaughton LS, Hodgson AB, Tipton KD. Protein considerations for optimising skeletal muscle mass in healthy young and older adults. Nutrients. 2016; 8: 181.
34. Phillips SM. Dietary protein requirements and adaptive advantages in athletes. Br J Nutr. 2012; 108: S158-S167. 35. Jeukendrup A. A step towards personalized sports nutrition:
carbohydrate intake during exercise. Sports Med. 2014; 44: 25-33.
36. Juzwiak CR. Reflection on sports nutrition: Where we come from, where we are, and where we are headed. Rev Nutr. 2016; 29: 435-444.
37. Folasire OF, Akomolafe AA, Sanusi RA. Does nutrition knowledge and practice of athletes translate to enhanced athletic performance? Cross-sectional study amongst nigerian undergraduate athletes. Glob J Health Sci. 2015; 7: 215.
38. Daniel NVS, Jurgensen LP, Padovani RdC, Juzwiak CR. Impact of an Interdisciplinary Food, Nutrition and Health Education Program for adolescent Brazilian volleyball players. Rev Nutr. 2016; 29: 567-577.
Corresponding author
Marco Túlio de Mello
Mailing Adress: Av. Presidente Carlos Luz, 4664, Pampulha. CEP 31.310.250 Belo Horizonte, MG, Brazil.
Email: [email protected]
Manuscript received on February 27, 2018 Manuscript accepted on April 22, 2018