Food Science and Technology
DO:
D https://doi.org/10.1590/1678-457X.34416
OSSN 0101-2061 (Print) OSSN 1678-457X (Dnline)
1 Introduction
According to Brazilian legislation, SCM is manufactured by removing part of water from a mixture of milk and sucrose or glucose by evaporation. During subsequent cooling of the product after sugar addition and evaporation, lactose crystallization is induced. Today, there are considerable variations in the methods and equipment used to manufacture SCM. The stages of the process include heat treatment, homogenization, addition of sugar (liquid or dry, before or during concentration), concentration (or hydration if powder is used), seeding and cooling (Tan, 2009).
Except for seeding and cooling, the sequence of these stages varies from one processor to another and it is quite common to carry out the heat treatment, and/or concentrations in multiple stages (Tan, 2009). Different processing sequences lead to products with different viscosity and age-thickening properties.
Sensorial problems in SCM are related to milk quality, intensity of heat treatment, microbiological contamination and insufficient crystallization of lactose. According to Rice (1926), two variations from good factory operation that might cause rancidity in SCM are 1) leakage in valves through which a small amount of unheated milk might be drawn into a pan under operation, and 2) carelessness in heating the hot well so that all the milk does not reach the temperature necessary to destroy the lipase.
Despite the recent researches on dairy technology, science and nutrition (Akal & Yetişemiyen, 2016; Barbosa et al., 2013;
Bosso et al., 2016; Hamoudi-Belarbi et al., 2016; Mostafidi et al., 2016; Rangel et al., 2016; Sales et al., 2016), there are few information’s published on the sweetened condensed milk subject.
The aim of this study was to characterize the physicochemical composition, microbiology, and sensorial and microscopical attributes of sweetened condensed milk produced in Brazil.
2 Materials and methods
The experimental procedures are represented in Figure 1.
2.1 Composition
Concentrations of solids in the sweetened condensed products were determined by gravimetric methods; lactose and sucrose by the Cloramina T method (Wolfschoon-Pombo & Casagrande, 1982); fat by the Gerber method (Onternational Dairy Federation, 2008); and proteins by the micro Kjeldahl method (Onternational Dairy Federation, 1993).
2.2 Physical chemistry attributes
Water activity equipment (Aqualab Series 3, Jarinú, Brazil) was used to determine water activity. Viscosimeter equipment (Quimis model Q860M, Diadema, Brazil) was applied to determine viscosity. The total soluble solids were determined in a refractometer (Reichert model AR200, New York, USA).
Characterization of physicochemical composition, microbiology, sensory evaluation
and microscopical attributes of sweetened condensed milk
Ísis Rodrigues Toledo RENHE1, Danielle Braga Chelini PEREORA1, Jaqueline Flaviana Dliveira de SÁ1,
Marcelo Cerqueira dos SANTDS1, Vanessa Aglaê Martins TEDDDRD2,
Fernando Antônio Resplande MAGALHÃES1, Ítalo Tuler PERRDNE3*, Paulo Henrique Fonseca da SOLVA2
Received 03 Feb., 2017 Accepted 14 June, 2017
1 Empresa de Pesquisa Agropecuária de Minas Gerais – EPAMIG, Instituto de Laticínios Cândido Tostes, Viçosa, MG, Brasil 2 Universidade Federal de Juiz de Fora – UFJF, Campus Juiz de Fora, Juiz de Fora, MG, Brasil
3 Universidade Federal de Viçosa – UFV, Campus Viçosa, Viçosa, MG, Brasil *Corresponding author: italotulerperrone@gmail.com, italo.perrone@ufv.br
Abstract
An analysis of nine sweetened condensed milk brands allowed for the identification of statistically significant difference in moisture, water activity (aw), soluble solids, percentage of protein, lactose crystals size, viscosity and in sensorial attributes of texture, characteristic flavor and flour texture. Relevant correlations between the composition and sensorial attributes were determined. Eighty percent of the samples presented of yeast from <0.6 logCFU.g-1 to 4.7 logCFU.g-1 and seventy percent
presented of coagulase-negative staphylococcus from <3.1 log CFU.g-1 to 5.7 log CFU.g-1. These results attest the demand for
more controls and investments to provide the market with a safe and standardized product.
Keywords: compositional characterization; sensorial attributes; microbiology; lactose crystals.
The number and size of lactose crystals were measured as described in Hough et al. (1990).
2.3 Microbiology
Determinations of aerobic mesophilic bacteria count, moulds and yeasts, coagulase-negative staphylococcus and coliforms at 30 °C and at 45 °C were done according to the American Public Health Association (Lancette & Bennett, 2001) and to the Standard Methods for the Examination of Dairy Products
(Laird et al., 2004; Wehr & Frank, 2004; Henning et al., 2004).
2.4 Sensory evaluation
The sensorial panel was done by using Quantitative Descriptive Analysis (QDA) with 9 trained panelists (4 men and 5 women aged between 25 and 48 years), regarding their experience with production and analysis of SCM, oral health status, interests, schedule, availability, ability to verbalize descriptions of sensory perceptions, and use of scales. Prior to the analysis, the participants were trained in the definition and intensities of the defined attributes using sweetened condensed milk with varying sensory properties (for example, low or high concentrations of sucrose). These defined attributes were brightness, color, aroma, consistency, texture, flour texture, characteristic flavor, sweetness and cooked flavor. The judges analyzed a maximum of 3 samples each time. The samples were presented out of their original package in similar containers. Water, apples and crackers were provided to clean the palate between samples.
2.5 Experimental design and statistical analysis
Data were analyzed using descriptive statistics, an analysis of variance with the Tukey test to compare means the posteriori and “t” test of Student to compare the paired data means. Parametric Pearson correlations were applied for physicochemical and sensory attributes of sweetened condensed milk. Statistical analyses (α < 0.05) were performed with SAEG® (2007) software. Figure 1. Experimental procedures.
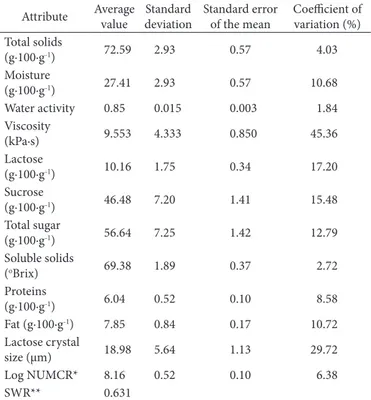
Table 1. Sweetened condensed milk composition (n=27).
Attribute Average value
Standard deviation
Standard error of the mean
Coefficient of variation (%) Total solids
(g∙100∙g-1) 72.59 2.93 0.57 4.03
Moisture
(g∙100∙g-1) 27.41 2.93 0.57 10.68
Water activity 0.85 0.015 0.003 1.84
Viscosity
(kPa∙s) 9.553 4.333 0.850 45.36
Lactose
(g∙100∙g-1) 10.16 1.75 0.34 17.20
Sucrose
(g∙100∙g-1) 46.48 7.20 1.41 15.48
Total sugar
(g∙100∙g-1) 56.64 7.25 1.42 12.79
Soluble solids
(oBrix) 69.38 1.89 0.37 2.72
Proteins
(g∙100∙g-1) 6.04 0.52 0.10 8.58
Fat (g∙100∙g-1) 7.85 0.84 0.17 10.72
Lactose crystal
size (µm) 18.98 5.64 1.13 29.72
Log NUMCR* 8.16 0.52 0.10 6.38
SWR** 0.631
*Number of lactose crystals; **SWR = (%sucrose in SCM)/(%sucrose in SCM+%water in SCM).
3 Results and discussion
“dulce de leche” is 30% w/w, which allows a bigger industrial yield and a lower water removal during processing when compared to the SCM manufacturing technology. The establishment of maximum humidity values for SCM is important for parameters including industrial yields, lactose crystallization efficiency and water activity. Table 2 presents the results of the Tuckey test for total solids, water activity, soluble solids and protein.
The comparison of the total solids means by the Tuckey test showed that brands 4 and 6 are statistic different from brands 5 and 8, with the majority of the brands in the value range between 72.28% w/w and 73.64% w/w.
The mean value for the water activity of the sweetened condensed milk samples was 0.85 and the comparison of the results by Tuckey showed a wide range of results for this attribute. This observation suggests that water activity in this product is not a highly controlled parameter by industries.
According to Tan (2009), sucrose is added to milk in the production of SCM to achieve a shelf-stable product with a sufficiently high osmotic pressure to prevent microbial spoilage and food poisoning. The products may occasionally be subject to spoilage by xerophilic moulds and osmophilic yeasts, which can tolerate water activity (aw) to almost 0.61. To achieve the required osmotic effect, a sucrose in water ratio (SWR) minimum of 0.625 is needed (Tan, 2009; Early, 1998), as determined by Equation 1.
(% % % )
sucrose in SCM SWR
sucrose in SCM water in SCM
=
+ (1)
The sucrose in SCM is undoubtedly the primary solute responsible for lowering aw. The desired SWR ratio is 0.625 to 0.645. At a ratio of 0.625, the corresponding aw is less than 0.85. Below a ratio of 0.625, aw will be higher than 0.850 (microbiologically unstable) and above 0.645, sucrose will crystallize out of solution, especially when the product is stored below room temperature (Tan, 2009).
The application of Equation 1 for the obtained values of sucrose and moisture gives 0.631 as mean value. This average is between the recommended range for sucrose in water ratio, according to the literature references.
Considering the water activity limit for microbiology grown as 0.85 (Tan, 2009), brands 5 and 7 are above this reference, and
brands 1, 2, 3, 8 and 9 are exactly on limit value. This result is important for quality control and food security once it allows the development of potentially dangerous microorganisms in sweetened condensed milk. This emphasizes the importance of all technological actions in order to obtain safe food. The comparison of protein average for sweetened condensed milk with the values for “Dulce de leche” shows that 6 of the 9 brands are not in accordance with the minimum 6% w/v protein required by legislation for “Dulce de leche”. This result was not expected because SCM is a more concentrated product than “Dulce de leche”. Therefore, a higher amount of protein was expected in SCM. This is an important fact for the nutritional point of view because low amounts of proteins have the tendency to characterize SCM more as a dessert than as a dairy product rich in nutrients. Many international legislations determine a minimum value of 34% of proteins in the total non-fat dairy solids. The calculation of this parameter for Brazilian SCM products showed an average of 33%, which shows the importance to discuss the ratio of protein during the elaboration of a specific technical standard for sweetened condensed milk, especially for product exportation standardization.
Similar to the amount of proteins in SCM, the average values for fat in this product was 7.85% w/v which is under the minimum 8% w/w value stipulated by some international legislation.
The lactose crystal size, texture, characteristic flavor, flour texture and viscosity of the products are presented in Table 3. Texture, characteristic flavor and flour texture were the only sensorial attributes that showed statistical differences between the analyzed brands.
Analyzing nine sweetened condensed milk (SCM) brands allowed the identification of statistically significant differences in moisture, water activity (aw), soluble solids, percentage of protein, lactose crystals size, in the viscosity and in sensorial attributes of texture, characteristic flavor and flour texture. A positive correlation was determined between the logarithm of the number of crystals and the amount of lactose (p<0.04), the percentage of total solids (p<0.05) and the sensorial attribute of consistency (p<0.04). Relevant correlations between the composition and sensorial attributes were determined.
Table 2. Tuckey test applied to total solids, water activity, soluble solids and protein* (n=27).
Total solids Water activity Soluble solids Protein
Brand Average Brand Average Brand Average Brand Average
6 75.72a 5 0.87a 6 71.35a 9 6.89a
4 74.93a 7 0.86ab 9 70.43a 5 6.60ab
1 73.64ab 3 0.85ab 4 70.28ab 3 6.25abc
3 73.41ab 9 0.85ab 2 69.95ab 4 5.97bc
2 73.32ab 8 0.85abc 3 69.73ab 1 5.95bc
7 73.25ab 1 0.85bc 1 69.70ab 6 5.75bc
9 72.28ab 2 0.85bc 8 69.40ab 7 5.74bc
5 70.27b 4 0.84bc 7 68.77ab 2 5.68c
8 70.13b 6 0.83c 5 68.00b 8 5.53c
These results attest the demand for control of the lactose crystallization stage to get the expected final product characteristics, probably because the industries employ different parameters during standardization, cooling and lactose crystallization of the SCM produced in Brazil. A positive correlation between the number of lactose crystals and the consistency was also observed by the sensorial panel probably due to the increase in the friction between the crystals, showing the necessity for more control in the lactose crystallization process.
Depending on the acceptable level of secondary nucleation, the operating conditions can be selected based on the temperature, agitation rate and time. To produce crystals with narrow size distribution, the agitation speed should be kept at the minimum level to maintain particles in suspension (Wong et al., 2011). According to Fox & McSweeney (1998), once a sufficient number of nuclei had formed during lactose crystallization, crystal growth can occurs at a rate influenced by the degree of supersaturation, surface area available for deposition, viscosity, agitation, temperature and mutarotation.
The texture presented negative statistical correlations with physico-chemical properties as total solids, soluble solids and viscosity. As the scale of the texture left from smooth to sandy, these negative correlations actually indicate that increasing the values of these attributes caused the product’s texture to be less smooth and could even cause the perception of sandiness. Dn the other hand, the increase of milk solids is accompanied by the increase of amount of lactose, which can lead to perception of lactose crystals in the product. As result, this leads the product to have worse performance in texture. Higher levels of total solids and soluble solids contribute to greater saturation of lactose in the solution and greater tendency to crystallization. When well conducted in industry, the crystallization leads to the formation of a larger number of smaller crystals, improving the texture of the final product.
There was an inverse correlation between the attributes of crystal size and water activity. On this way, the sandy texture was presented with increasing crystal size, as described in the literature, and with increasing water activity. These results were expected since the sandy texture is characterized by the presence of high lactose crystal size. Likewise, the water activity is related to the presence of free water and this allows movement of the lactose molecules which are able to form large crystals.
Both products 1 and 9 are statistically different for texture attribute and have, respectively, average crystal size of 12.13 µm and 23.37 µm.
The negative correlation between viscosity and texture can be attributed to the fact that products with higher viscosity can better mask the crystals. The higher viscosity decreases the spreadability of the product in the mouth and thus reduces the perception of lactose crystals. The importance of viscosity in the texture is underscored by the fact that the sample with the largest crystals (brand 8 – 30.05 µm) was not the one that received the highest score in the texture attribute, which characterizes a steeper sandy texture. This was the product that also had the highest viscosity. This observation emphasizes the importance of sensory analysis as a product quality control analysis tool since it results from the combined analysis of several factors at the same time by the judge, unlike the physico-chemical analyzis and rheological properties.
The QDA is widely applied to dairy foods (Gaze et al., 2015; Morais et al., 2014a; Cadena et al., 2012). According to the methodology defined for this sensory analysis, the products with characteristic flavor closer to the product considered standard by trained judges received the highest marks. The brands 1, 2 and 3 received the highest scores for characteristic flavor and are also the three brands that had the smaller sizes of lactose crystals. The attribute characteristic flavor correlates statistically positively with the levels of total solids, soluble solids and lactose. The attribute of sweet taste had a statistically positive correlation with total soluble solids, indicating that the higher the concentration achieved on the equipment, the greater the sweet perception in the product, a fact that was expected for the condensed milk.
The “mealy” texture sensory attribute differs from the texture attribute because it seeks to identify protein precipitation, not the presence of lactose crystals. The low thermal stability of milk and the use of high concentration factors may intensify this texture defect in the final product. Products that received the highest scores are those that differ more from the product considered ideal by the trained panelists. Thus, brand 9 is statistically different for the attribute “mealy” texture from the brands 3 and 6, and is the one that presented the highest protein content and the second highest soluble solids content within the analyzed products. From the results of this article is evident Table 3. Tuckey test applied to lactose crystal size, texture, characteristic flavor, flour texture and viscosity* (n=27).
Lactose crystal size (µm) Texture Characteristic flavor Flour texture Viscosity (kPa·s)
Brand Average Brand Average Brand Average Brand Average Brand Average
8 30.05a 9 4.24a 2 10.93a 9 5.31a 8 12.400a
9 23.37ab 5 3.42ab 3 10.51a 8 4.47ab 9 11.867ab
7 22.50ab 8 3.31ab 1 9.93ab 4 4.38ab 4 10.800abc
4 20.00bc 4 3.30ab 8 9.45ab 5 3.78ab 2 8.000abcd
6 18.70bc 3 2.65ab 9 9.21ab 2 3.70ab 3 6.933abcd
5 18.60bc 2 2.49ab 7 9.18ab 1 3.62ab 1 6.400abcd
2 16.93bc 7 2.19ab 5 8.74ab 7 2.96ab 5 5.733bcd
1 12.13c 6 1.98ab 4 8.60b 3 2.65b 6 4.600cd
3 12.10c 1 1.91b 6 7.92b 6 2.25b 7 3.733d
the need of performing a consumer test using international context and consumer sensory profiling applying emerging sensory methods (projective mapping and pivot profile) as described in the literature (Dantas et al., 2016; Fonseca et al., 2016; Santos et al., 2015; Morais et al., 2014b; Cruz et al., 2013).
The aerobic mesophilic bacteria count showed a range of variation from <1.0 log CFU.g-1 to 6.2 log CFU.g-1. The presence
of a high mesophilic bacteria count in the final product (90% of the brands analyzed have high counts) can cause problems during storage. Rogers et al. (1920), describe the development of “buttons”, which are hard, reddish-brown lumps of curd occurring on SCM. They are caused by the growth of Aspergilus repens and possibly other molds. On this study, the presence of yeast was found in eighty percent of the samples from <0.6 logCFU.g-1 to 4.7 logCFU.g-1.
The coagulase-negative staphylococcus count showed a variation range from <3.1 logCFU.g-1 to 5.7 logCFU.g-1.
This microorganism was detected in seventy percent of the samples. On another study with 10 brands of SCM (Sá et al., 2008), the coagulase-negative staphylococcus count showed a range of variation from <4.5 logCFU.g-1 to 5.6 logCFU.g-1. The ability
of Staphylococcus strains to form biofilm in stainless steel was demonstrated in different works (Michu et al., 2011; Teh et al., 2011; Simões et al., 2010; Planchon et al., 2006). These results attest to the demand for more controls during the cleaning of the plant. Some preliminary work reported that some strains of either positive and negative coagulase staphylococcus are able to produce enterotoxins in food (Rall et al., 2010; Dliveira et al., 2010; Udo et al., 1999), which indicates that Staphylococcus spp. should be considered as an indicative of microbiological risk in SCM production.
4 Conclusion
The results of these study lead to the necessity of Brazilian industries to focus on decreasing the variability on composition, viscosity, size and number of lactose crystals and sensorial parameters of sweetened condensed milk. Even SCM seems to be an easy product to storage because of the low water activity and historical of heat treatment the results suggest the need of improvements in dairy industries controls to avoid microbiological contamination. From the results of this article is evident the need of performing a consumer test using international context and consumer sensory profiling applying emerging sensory methods.
Acknowledgements
This work was financially supported by The State of Minas Gerais Foundation of Support to Research (FAPEMOG), by the National Council for Scientific and Technological Development (CNPq) and CAPES.
References
Akal, C., & Yetişemiyen, A. (2016). Use of whey powder and skim milk
powder for the production of fermented cream. Food Science and
Technology, 36(4), 616-621. http://dx.doi.org/10.1590/1678-457x.06816.
Barbosa, V. C., Garcia-Rojas, E. E., Coimbra, J. S. R., Cipriano, P. A., Dliveira, E. B., & Telis-Romero, J. (2013). Thermophysical and rheological properties of dulce de leche with and without coconut
flakes as a function of temperature. Food Science and Technology,
33(1), 93-98. http://dx.doi.org/10.1590/S0101-20612013005000009. Bosso, A., Morioka, L. R. O., Santos, L. F. D., & Suguimoto, H. H. (2016). Lactose hydrolysis potential and thermal stability of commercial
β-galactosidase in UHT and skimmed milk. Food Science and
Technology, 36(1), 159-165. http://dx.doi.org/10.1590/1678-457X.0085.
Brasil, Ministério da Agricultura. (1997, September 8). Aprovar os Regulamentos Técnicos de Produção, Odentidade e Qualidade do Leite tipo A, do Leite tipo B, do Leite tipo C, do Leite Pasteurizado e do Leite Cru Refrigerado e o Regulamento Técnico da Coleta de
Leite Cru Refrigerado e seu Transporte a Granel. Diário Oficial [da]
República Federativa do Brasil, seção 1.
Cadena, R. S., Cruz, A. G., Faria, J. A. F., & Bolini, H. M. A. (2012). Reduced fat and sugar vanilla ice creams: Sensory profiling and
external preference mapping. Journal of Dairy Science, 95(9),
4842-4850. PMid:22916888. http://dx.doi.org/10.3168/jds.2012-5526. Cruz, A. G., Cadena, R. S., Castro, W. F., Esmerino, E. A., Rodrigues, J.
B., Gaze, L., Faria, J. A. F., Freitas, M. Q., Deliza, R., & Bolini, H. M. A. (2013). Consumer perception of probiotic yogurt: Performance of check all that apply (CATA), projective mapping, sorting and
intensity scale. Food Research International, 54(1), 601-610. http://
dx.doi.org/10.1016/j.foodres.2013.07.056.
Dantas, A. B., Jesus, V. F., Silva, R., Almada, C. N., Esmerino, E. A., Cappato, L. P., Silva, M. C., Raices, R. S. L., Cavalcanti, R. N., Carvalho, C. C., Sant’Ana, A. S., Bolini, H. M. A., Freitas, M. F., & Cruz, A. G. (2016). Manufacture of probiotic Minas Frescal cheese
with Lactobacillus casei Zhang. Journal of Dairy Science, 99(1),
18-30. PMid:26519974. http://dx.doi.org/10.3168/jds.2015-9880.
Early, R. (1998). Technology of dairy products (1st ed.). London: Springer.
Fonseca, F. G., Esmerino, E. A., Tavares, E. R. Fo, Ferraz, J. P., Cruz, A. G., & Bolini, H. M. (2016). Novel and successful free comments method for sensory characterization of chocolate ice cream: A comparative study between pivot profile and comment analysis.
Journal of Dairy Science, 99(5), 3408-3420. PMid:26923040. http://
dx.doi.org/10.3168/jds.2015-9982.
Fox, P. F., & McSweeney, P. L. H. (1998). Dairy chemistry and biochemistry
(1st ed.). London: Springer.
Gaze, L. V., Dliveira, B. R., Ferrao, L. L., Granato, D., Cavalcanti, R. N., Conte, C. A. Jr, Cruz, A. G., & Freitas, M. Q. (2015). Preference mapping of dulce de leche commercialized in Brazilian markets.
Journal of Dairy Science, 98(3), 1443-1454. PMid:25557891. http://
dx.doi.org/10.3168/jds.2014-8470.
Hamoudi-Belarbi, L., Nouri, H., & Belkacemi, K. (2016). Effectiveness of convective drying to conserve indigenous yeasts with high volatile profile isolated from algerian fermented raw bovine milk
(Rayeb). Food Science and Technology, 36(3), 476-484. http://dx.doi.
org/10.1590/1678-457X.00416.
Henning, D.R., Flowers, R., Reiser, R., & Ryser, E.T. (2004). Pathogens in milk and milk products. On H. M. WEHR & J. F. FRANK. (Eds.),
Standard methods for the examination of dairy products (17th ed.,
pp. 103-151). Washington: American Public Health Association. Hough, G., Martinez, E., & Contarini, A. (1990). Sensory and objective
measurement of sandiness in dulce de leche, a typical Argentine
dairy product. Journal of Dairy Science, 73(3), 604-611. http://dx.doi.
org/10.3168/jds.S0022-0302(90)78709-7.
Onternational Dairy Federation – ODF. (1993). IDF 20B: determination
and cow’s milk protein allergy. Food Science and Technology, 36(2), 179-187. http://dx.doi.org/10.1590/1678-457X.0019.
Rice, F. E. (1926). Sweetened condensed milk: V. Rancidity*, 1. Journal
of Dairy Science, 9(3), 293-305.
http://dx.doi.org/10.3168/jds.S0022-0302(26)93900-3.
Rogers, L. A., Dahlberg, A. D., & Evans, A. C. (1920). The cause and
control of “buttons” in sweetened condensed milk. Journal of
Dairy Science, 3(2), 122-133.
http://dx.doi.org/10.3168/jds.S0022-0302(20)94255-8.
Sá, J. F. D., Perrone, Í. T., Silva, P. H. F., Faria, L. M. G. C., & Colombo, M. (2008). Perfil microbiológico do leite condensado produzido no
Brasil. Revista do Instituto de Laticínios Cândido Tostes, 63(364), 42-45.
Sales, D. C., Rangel, A. H. D. N., Urbano, S. A., Borges, K. C., Andrade, J. C. D. No, & Chagas, B. M. E. (2016). Cheese yield in Brazil: state of
the art. Food Science and Technology, 36(4), 563-569. http://dx.doi.
org/10.1590/1678-457x.17116.
Santos, B. A., Campagnol, P. B., Cruz, A. G., Galvão, M. T. E. L., Monteiro, R. A., Wagner, R., & Pollonio, M. A. R. (2015). Check all that apply and free listing to describe the sensory characteristics of low sodium dry fermented sausages: comparison with trained panel.
Food Research International, 76(Pt 3), 725-734. PMid:28455058.
http://dx.doi.org/10.1016/j.foodres.2015.06.035.
Simões, M., Simões, L. C., & Vieira, M. J. (2010). A review of current
and emergent biofilm control strategies. Lebensmittel-Wissenschaft +
Technologie, 43(4), 573-583. http://dx.doi.org/10.1016/j.lwt.2009.12.008.
Tan, R. (2009). Manufacture of sweetened condensed milk and significance
of lactose. On P. F. Fox & P. L. H. McSweeney (Eds.), Advanced dairy
chemistry: lactose, water, salts and minor constituents (4th ed., vol.
3). London: Thomson Science.
Teh, K. H., Flint, S., Palmer, J., Lindsay, D., Andrewes, P., & Bremer, P. (2011). Thermo-resistant enzyme-producing bacteria isolated from
the internal surfaces of raw milk tankers. International Dairy Journal,
21(10), 742-747. http://dx.doi.org/10.1016/j.idairyj.2011.04.013. Udo, E. E., Al-Bustan, M. A., Jacob, L. E., & Chugh, T. D. (1999).
Enterotoxin production by coagulase-negative staphylococci in restaurant workers from Kuwait City may be a potential cause of
food poisoning. Journal of Medical Microbiology, 48(9), 819-823.
PMid:10482292. http://dx.doi.org/10.1099/00222615-48-9-819.
Wehr, H. M., & Frank, J. F. (2004). Standard methods for the examination
of dairy products. Washington: American Public Health Association.
Wolfschoon-Pombo, A., & Casagrande, M. (1982). Determinação
simultânea de lactose e sacarose em doce de leite. Revista do Instituto
de Laticínios Cândido Tostes, 37, 3-7.
Wong, S. Y., Bund, R. K., Connelly, R. K., & Hartel, R. W. (2011). Determination of the dynamic metastable limit for α-lactose
monohydrate crystallization. International Dairy Journal, 21(11),
839-847. http://dx.doi.org/10.1016/j.idairyj.2011.05.003.
Onternational Dairy Federation – ODF. (2008). ISO 488 IDF 105: Milk
- Determination of fat content – Gerber butyrometers. Brussels: ODF.
Laird, D. T., Gambrel-Lenarz, S. A., & Scher, E. M. (2004). Microbiological
count methods. On H. M. WEHR & J. F. FRANK. (Eds.), Standard
methods for the examination of dairy products (17th ed., pp. 153-186).
Washington: American Public Health Association.
Lancette, G.A., Bennett R.W. (2001). Staphylococcus aureus. On F.P.
Downes & K. Oto, (Eds). Compendium of methods for the microbiological
examination of foods (4th ed., pp. 387-400). Washington: American
Public Health Association.
Michu, E., Cervinkova, D., Babak, V., Kyrova, K., & Jaglic, Z. (2011). Biofilm formation on stainless steel by Staphylococcus epidermidis in milk and influence of glucose and sodium chloride on the
development of ica-mediated biofilms. International Dairy Journal,
21(3), 179-184. http://dx.doi.org/10.1016/j.idairyj.2010.10.004. Morais, E. C., Cruz, A. G., Faria, J. A. F., & Bolini, H. M. A. (2014a).
Prebiotic gluten-free bread: sensory profiling and drivers of liking.
Lebensmittel-Wissenschaft + Technologie, 55(1), 248-254. http://
dx.doi.org/10.1016/j.lwt.2013.07.014.
Morais, E. C., Morais, A. R., Cruz, A. G., & Bolini, H. M. A. (2014b). Development of chocolate dairy dessert with addition of prebiotics and replacement of sucrose with different high-intensity sweeteners.
Journal of Dairy Science, 97(5), 2600-2609. PMid:24612793. http://
dx.doi.org/10.3168/jds.2013-7603.
Mostafidi, M., Moslehishad, M., Piravivanak, Z., & Pouretedal, Z. (2016). Evaluation of mineral content and heavy metals of dromedary camel
milk in Oran. Food Science and Technology, 36(4), 717-723. http://
dx.doi.org/10.1590/1678-457x.16116.
Dliveira, A. M., Miya, N. T. N., Sant’Ana, A. S., & Pereira, J. L. (2010). Behavior and enterotoxin production by coagulase negative Staphylococcus in cooked ham, reconstituted skimmed milk, and
confectionery cream. Journal of Food Science, 75(7), M475-M481.
PMid:21535559. http://dx.doi.org/10.1111/j.1750-3841.2010.01754.x. Planchon, S., Gaillard-Martinie, B., Dordet-Frisoni, E., Bellon-Fontaine, M. N., Leroy, S., Labadie, J., Hébraud, M., & Talon, R. (2006).
Formation of biofilm by Staphylococcus xylosus. International
Journal of Food Microbiology, 109(1), 88-96. PMid:16503066. http://
dx.doi.org/10.1016/j.ijfoodmicro.2006.01.016.
Rall, V. L. M., Sforcin, J. M., Deus, M. F. R., Sousa, D. C., Camargo, C. H., Godinho, N. C., Galindo, L. A., Soares, T. C., & Araújo, J. P. Jr (2010). Polymerase chain reaction detection of enterotoxins genes in coagulase-negative staphylococci isolated from Brazilian
Minas cheese. Foodborne Pathogens and Disease, 7(9), 1121-1123.
PMid:20528174. http://dx.doi.org/10.1089/fpd.2009.0478. Rangel, A. H. D. N., Sales, D. C., Urbano, S. A., Galvão, J. G. B. Jr,