Critical levels and sufficiency ranges for leaf nutrient diagnosis in
cowpea grown in the Northeast region of Brazil
1Níveis críticos e faixas de suficiência para diagnose nutricional foliar em feijão-caupi
cultivado na região Nordeste do Brasil
Francisco de Brito Melo2*, Henrique Antunes de Souza3, Edson Alves Bastos2 and Milton Jose Cardoso2
ABSTRACT - Proposing sufficiency ranges and critical levels is an important technique for correct evaluation of leaf nutrient
diagnosis. In this study, the objective was to propose critical levels and sufficiency ranges of macro- and micronutrients for the diagnostic leaf of cowpea, collected at flowering, with the results of macro- and micronutrients and productivity in the Northeast of Brazil. The critical level was calculated by the reduced normal distribution and by the boundary line method, which was also used to generate sufficiency ranges. For the critical level by reduced normal distribution, the relationship of the nutrients with 90% of maximum productivity was adopted. For the boundary line, the relationship of the nutrients that are in the upper line of a dispersion diagram was considered. The critical levels by reduced normal distribution for nitrogen (N), phosphorus (P), potassium (K), calcium (Ca), magnesium (Mg), copper (Cu), iron (Fe), manganese (Mn) and zinc (Zn) are: 35.3 g kg-1, 1.8 g kg-1, 20.5 g kg-1, 11.1 g kg-1, 2.6 g kg-1, 3.2 mg kg-1, 105 mg kg-1, 89 mg kg-1and 22 mg kg-1, respectively.
However, the critical levels generated by the boundary line for N, P, K, Ca, Mg, Cu, Fe, Mn and Zn are 39.5 g kg-1, 2.3 g kg-1,
21.2 g kg-1, 11.3 g kg-1, 2.9 g kg-1, 4.2mg kg-1, 142 mg kg-1, 143mg kg-1 and 24 mg kg-1, respectively. The sufficiency ranges by
the boundary line method, to achieve 95% of maximum productivity, are equivalent to 34.4-44.7g kg-1, 1.7-2.9 g kg-1
,18.6-23.6 g kg-1,8.8-13.7 g kg-1,2.3-3.5 g kg-1,3.1-5.4 mg kg-1,73-210 mg kg-1,104-181 mg kg-1and 22-27 mg kg-1 for N, P, K,
Ca, Mg, Cu, Fe, Mn and Zn, respectively.
Key words: Vigna unguiculata. Leaf content. Plant nutrition.
RESUMO - Propor faixas de suficiência e níveis críticos é uma técnica importante para a avaliação correta do diagnóstico
foliar. Neste estudo, o objetivo foi propor níveis críticos e faixas de suficiência de macro e micronutrientes para o diagnóstico da folha do feijão-caupi, coletadas na floração, com os resultados de macro e micronutrientes e produtividade no Nordeste do Brasil. O nível crítico foi calculado pela distribuição normal reduzida e pelo método da linha de fronteira, que também foi usado para gerar faixas de suficiência. Para o nível crítico por distribuição normal reduzida, foi adotada a relação dos nutrientes com 90% da produtividade máxima. Para a linha de fronteira, a relação dos nutrientes que estão na linha superior de um diagrama de dispersão foi considerada. Os níveis críticos pela distribuição normal reduzida de nitrogênio (N), fósforo (P), potássio (K), cálcio (Ca), magnésio (Mg), cobre (Cu), ferro (Fe), manganês (Mn) e zinco ( Zn) são: 35,3 g kg-1, 1,8 g kg-1, 20,5 g kg-1, 11,1 g
kg-1, 2,6 g kg-1, 3,2 mg kg-1, 105 mg kg-1, 89 mg kg-1 e 22 mg kg-1, respectivamente. No entanto, os níveis críticos gerados pela
linha de fronteira para N, P, K, Ca, Mg, Cu, Fe, Mn e Zn são 39,5 g kg-1, 2,3 g kg-1, 21,2 g kg-1, 11,3 g kg-1, 2,9 g kg-1, 4,2 mg kg-1,
142 mg kg-1, 143 mg kg-1 e 24 mg kg-1, respectivamente. As faixas de suficiência pelo método da linha de fronteira, para atingir
95% da produtividade máxima, são equivalentes a 34,4-44,7 g kg-1, 1,7-2,9 g kg-1, 18,6-23,6 g kg-1, 8,8-13,7 g kg-1, 2,3-3,5 g kg-1,
3,1-5,4 mg kg-1, 73-210 mg kg-1, 104-181 mg kg-1 e 22-27 mg kg-1 para N, P, K, Ca, Mg, Cu, Fe, Mn e Zn, respectivamente.
Palavras-chaves: Vigna unguiculata. Conteúdo da folha. Nutrição vegetal.
DOI: 10.5935/1806-6690.20200071
Editor do artigo: Professor Adriel Ferreira da Fonseca - adrielff@gmail.com *Author for correspondence
Received for publication in 04/10/2019; approved in 16/07/2020
1Pesquisa financiada pela Embrapa (MP 02.14.01.006.00.04)
2Pesquisador da Embrapa Meio-Norte, Teresina-PI, Brasil, francisco.brito@embrapa.br (ORCID ID 0000-0002-4544-9261), edson.bastos@embrapa.br
(ORCID ID 0000-0002-6910-8162), milton.cardoso@embrapa.br (ORCID ID 0000-0003-2144-0104)
INTRODUCTION
Cowpea (Vigna unguiculata L. Walp.) is cultivated mainly in the North, Northeast and Mid-West regions of Brazil. It is used as one of the main protein sources for the rural population and, to a lesser extent, also for the urban population, thus becoming a crop of great socioeconomic relevance for the regions. In addition, Freire Filho et al. (2011), also mention that it is used in other Brazilian regions, as green forage, hay, in the form of silage, flour for animal feed and also as green manure and soil cover.
Brazilian agriculture has undergone major technological changes and, in addition, the globalization of agribusiness has caused consequences for the production chain of various crops, especially those that depend on the use of a large volume of inputs, notably fertilizers and agricultural pesticides. These crops have been showing a higher production cost each year and, as a result, the producer has sought new options for their production arrangements. It is observed that cowpea cultivation is expanding to the Cerrado area of the North, Northeast and Mid-West regions, where it is incorporated into the production arrangements as safrinha (second-season crop) after soybean and corn crops or as single crop in rotation with corn (MELO et al., 2018).
In regions of agricultural frontier, such as in the Northeast of Brazil (Piauí and Maranhão States), there is a predominance of the use of fertilizers in high quantities to correct chemical limitations, in addition to the need for proper replacement of nutrients to reach compensatory levels of productivity. Therefore, the monitoring of crop nutrition is preponderant for the proper management of fertilization (WITHERS et al., 2018).
There are available tools that assist in generating critical levels or sufficiency ranges, based on crop databases or even experiments. Generations of regional nutrient interpretation classes have greater reliability, with less variability in soil conditions, climate and production potential, provided that they meet the assumption of large volume of information and variations (CAMACHO et al., 2012).
One of the criteria used is the reduced normal distribution, in which the critical level is obtained for each nutrient considering 90% of the maximum productivity (MAIA; MORAIS, 2015; MAIA; MORAIS; OLIVEIRA, 2001). Another method that can be used is the boundary line, which consists in plotting the production as a function of the leaf contents of the nutrients, removing some points and leaving only those of the edge or at the boundary line of the data, where a polynomial fit is used to obtain an optimal value or sufficiency range (WEBB, 1972).
Sufficiency ranges have been obtained for some crops, such as pitaya (ALMEIDA et al., 2016); melon (MAIA; MORAIS, 2016) and mango (ALI, 2018), with the use of the boundary line.
The objectives of this study were to evaluate the nutritional status of cowpea by proposing critical levels and sufficiency ranges of different methods from regional database of fertilization trials, and suggest critical levels and sufficiency ranges of macro- and micronutrients for the cowpea crop in the Northeast of Brazil.
MATERIAL AND METHODS
The database with results of leaf analysis of macronutrients: nitrogen (N), phosphorus (P), potassium (K), calcium (Ca) and magnesium (Mg); and micronutrients: copper (Cu), iron (Fe), manganese (Mn) and zinc (Zn) was obtained by collecting the diagnostic leaf of cowpea in the municipalities of Parnaíba, Piauí State (03º05’ S; 41º47’ W and altitude of 65 m) and Brejo, Maranhão State (03º40’ S;42º60’ W and altitude of 117 m), where fertilization trials were conducted with cowpea (phosphorus x zinc and limestone doses).
The diagnostic leaves were collected at the phenological stage R2 (flowering), the third trifoliate leaf from the apex (with petiole), as recommended for common bean (SOUZA et al., 2011), because it is the leaf that shows the best correlation between leaf contents and grain production, with 20 leaves per plot (from fertilization and liming assay). After collection, the leaves were taken to the laboratory for washing, drying and grinding (MIYAZAWA
et al., 2009).
Cowpea productivity was obtained at the moment of harvest and processing of dry grains, with moisture corrected to 13% and data presented in kg ha-1. Sampling
was carried out in the 2015/2016 and 2016/2017 seasons, with a total of 44 samples.
Macro- and micronutrient analysis was performed according to Miyazawa et al. (2009), with nitric-perchloric digestion and subsequent reading in atomic absorption spectrophotometer for P, K, Ca, Mg, Cu, Fe, Mn and Zn; nitrogen was obtained by the Kjeldahl method (MIYAZAWA et al., 2009).
To obtain the critical level in plant tissue by the continuous probability distribution, productivity (P) and Q data were used according to Maia, Morais and Oliveira
(2001). Q is defined as the ratio between P and ni(Q=
P/ni), niis the content of the nutrient for which the critical level is to be defined, which determines the value of productivity representing 90% of its maximum value.
Equations 1 and 2, below, were used in the present study. In the first situation, P and Q are considered to have normal distribution; for equation 2, P has normal distribution and Q was transformed into natural logarithm (MAIA; MORAIS; OLIVEIRA et al., 2001).
(1) (2)
Where: m1 and s1 are the arithmetic means and the
standard deviation of P, and m2 and s2 are the means and the standard deviation of Q, respectively. The basic assumption to find the critical level by the continuous probability distribution is that the P and Q data follow normal distribution (MAIA; MORAIS; OLIVEIRA
et al., 2001). Therefore, the normality of the variables
mentioned (P and Q) was tested using the Shapiro Wilk test (p>0.05). When normality was not observed, the data were transformed by natural logarithm, being necessary for the nutrients K, Cu and Mn.
With the same population used to calculate the critical level by the reduced normal distribution, the boundary line was calculated (BLANCO-MACÍAS et al., 2009; LAFOND, 2009; QUESNEL et al., 2006).
The first step consisted in plotting the nutrient content vs. productivity data. The second step was to select the points located at the upper limit of the dispersion diagram. The values of maximum and minimum contents were verified, obtaining the difference between them, which was divided into 10 classes, and then the highest point (content) within each interval was selected (BLANCO-MACÍAS et al., 2009).
Thus, considering that this approach led to the selection of samples at adjacent intervals with large differences in productivity, suggesting that the samples with lower productivity were not in optimal conditions for this level of nutrition (LAFOND, 2013; QUESNEL
et al., 2006; VIZCAYNO-SOTO; CÔTÉ, 2004), the
classes were excluded considering the construction of a future concave quadratic model, that is, a curve ascending up to the maximum point and descending after it. To facilitate a possible exclusion of classes, the production of the selected sample in the respective class was divided by the average productivity and the point of highest relative productivity was identified (LAFOND, 2009):
(3) Where: RP is relative production, Psample is the highest productivity within the range of a given class and Paverageis the average productivity of the population.
Classes were excluded by adapting the procedure of Quesnel et al. (2006), Vizcayno-Soto and Côté (2004), in which the relative productions prior to highest relative production among the selected classes that did not meet the following criterion were excluded, considering up to the point of maximum relative production.
RP>RP-1 (4)
After the point of maximum relative production, it was necessary to meet the following criterion:
RP>RP+1 (5)
In which: RP, RP-1 and RP+1 were the relative
productions and adjacent points, lower and higher, respectively.
If this criterion was not met, the sample of the class in question was excluded (QUESNEL et al., 2006; VIZCAYNO-SOTO; CÔTÊ, 2004). The relative production of the selected sample of the initial class cannot be superior to the second class, otherwise the first class can be discarded and started by the second class; this reasoning is carried out up to the class that has the maximum relative productivity (ascending curve) and then an analogous reasoning was carried out from the class with maximum productivity to the last class, with discard of the class if the relative productivity was higher than the next one (descending curve), and this procedure was performed until the last class.
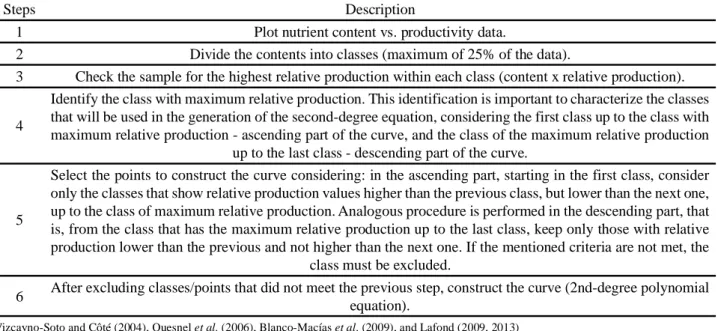
After excluding possible classes with values that do not meet the assumptions mentioned above, a second-degree polynomial function is generated. The steps described above can be summarized as presented in Table 1.
The optimal content or critical level (CL) was determined, solving by the first derivative of the quadratic regression equation.
(6) Where: a and b are coefficients of the quadratic equation. Thus, two sufficiency ranges were generated, with values corresponding to 95% and 99% of the maximum productivity: P = 0.95 or 0.99 × Maximum productivity, and subsequent substitution in the equation (BLANCO-MACÍAS et al., 2009; QUESNEL et al., 2006):
(7)
Where: a, b and c are coefficients of the quadratic equation and x is the corresponding value of the nutrient content for generating the sufficiency range.
Table 1 - Steps to construct the boundary line according to Vizcayno-Soto and Côté (2004), Quesnel et al. (2006),
Blanco-Macías et al. (2009), and Lafond (2009, 2013)
Steps Description
1 Plot nutrient content vs. productivity data.
2 Divide the contents into classes (maximum of 25% of the data).
3 Check the sample for the highest relative production within each class (content x relative production).
4
Identify the class with maximum relative production. This identification is important to characterize the classes that will be used in the generation of the second-degree equation, considering the first class up to the class with maximum relative production - ascending part of the curve, and the class of the maximum relative production
up to the last class - descending part of the curve.
5
Select the points to construct the curve considering: in the ascending part, starting in the first class, consider only the classes that show relative production values higher than the previous class, but lower than the next one, up to the class of maximum relative production. Analogous procedure is performed in the descending part, that is, from the class that has the maximum relative production up to the last class, keep only those with relative production lower than the previous and not higher than the next one. If the mentioned criteria are not met, the
class must be excluded.
6 After excluding classes/points that did not meet the previous step, construct the curve (2nd-degree polynomial
equation).
Additionally, the critical levels obtained by the reduced normal distribution and the boundary line for each nutrient were used to calculate the frequency with which the values of each nutrient could be considered deficient (below the critical level). For the sufficiency ranges, analogous reasoning was carried out, that is, it was verified among the samples of each nutrient which one would be in excess, in sufficiency or in deficiency, considering the ranges at 95% and 99% of the maximum production.
RESULT AND DISCUSSION
The average value of cowpea productivity for the population studied is equivalent to 1,246 kg ha-1, above
the national average (Table 2), which in the 2018/2019 season was 365 kg ha-1in the Northeast region and 1,200
kg ha-1in Mato Grosso (highest productivity in Brazil)
(COMPANHIA NACIONAL DE ABASTECIMENTO, 2019), and the maximum and minimum values of cowpea productivity of the evaluated samples were
1,431 and 1,090 kg ha-1, respectively. Among the
evaluated parameters, the decreasing order of data variability, according to the coefficient of variation, was Fe>Mn>Cu>P>Ca>Mg>Zn>N>K (Table 2).
In relation to the initial sample of 44 data/samples, for K, Cu and Mn it was necessary to transform the productivity/nutrient ratio to natural logarithm (Table 3). Thus, the critical levels by reduced normal distribution were 35.3, 1.8, 20.5, 11.1, 2.6, 3.2, 105, 89 and 22 for N,
P, K, Ca, Mg in g kg-1and Cu, Fe, Mn and Zn in mg kg-1,
respectively (Table 3).
The critical levels by the reduced normal distribution for leaf diagnosis have also been proposed for orange by Camacho et al. (2012), and sugarcane by Santos et al. (2013); for cowpea crop, critical levels by this method were proposed for soil chemical attributes in a survey carried out on properties of family farmers in the semiarid region of Ceará (SOUZA et al., 2014).
Regarding the boundary line method, the number of classes initially worked were 10 classes, which is based on using less than 25% of the observations to develop the model, in order to limit the selection of points to the upper limit of the dispersion and to maximize the probability of developing statistically significant models, increasing the number of observations, as recommended by Vizcayno-Soto and Côté (2004). It is worth mentioning that other authors suggest that the number of classes should be greater than 10 or up to 20 (BLANCO-MACÍAS et al., 2009).
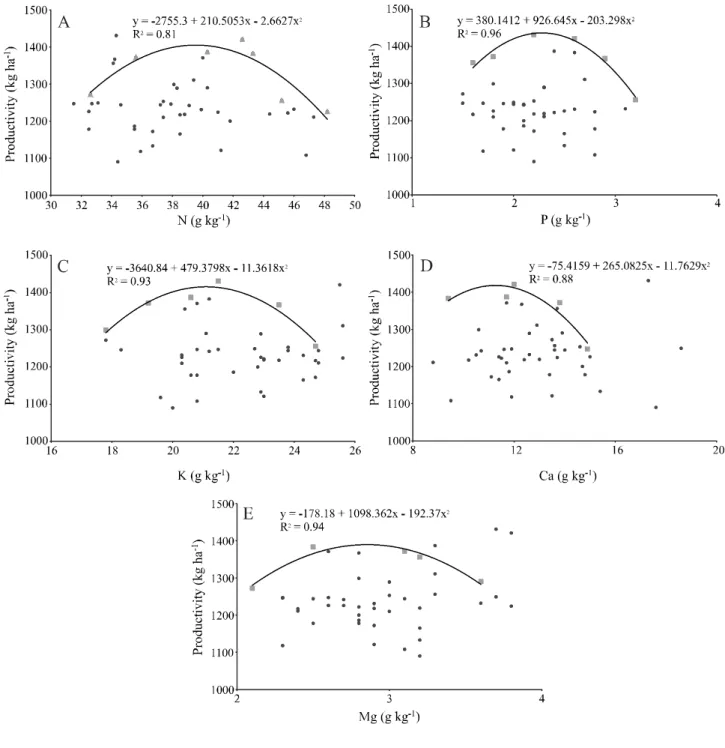
The number of classes used per nutrient were: 7, 6, 6, 5 and 5 for the macronutrients N, P, K, Ca and Mg, respectively (Figure 1). For micronutrients, the number of class corresponded to 7, 6, 5, and 6 for Cu, Fe, Mn and Zn, respectively (Figure 2). Using the correction of the number of classes to construct the boundary line enables the generation of quadratic regression models with higher coefficients of determination (VIZCAYNO-SOTO; CÔTÊ, 2004), and the R2values were from 0.81 to 0.96 for
macronutrients and from 0.66 to 0.96 for micronutrients.
Table 2 - Coefficient of variation and mean, maximum and minimum contents of macro- and micronutrients of leaf samples of cowpea
in the Northeast region of Brazil
£The productivity for 90% of the maximum was considered according to the number of samples per nutrient = 44, in kg ha-1.1Transformation of the
productivity/nutrient ratio to natural logarithm
Parameters N P K Ca Mg Cu Fe Mn Zn --- g kg-1 --- --- mg kg-1 ---Mean 38.6 2.2 22.1 12.8 2.9 4.2 148.5 116.3 24.7 Standard deviation 4.5 0.4 2.1 2.1 0.4 0.9 47.5 29.1 3.2 Maximum 48.2 3.2 25.6 18.6 3.8 5.9 278.0 201.0 30.6 Minimum 31.5 1.5 17.8 8.8 2.1 2.3 81.7 64.1 19.5 CV(%) 11.6 19.3 9.6 16.3 14.7 20.8 32.0 25.0 12.9 Parameters N P K Ca Mg Cu Fe Mn Zn P£ 1353 1353 1353 1353 1353 1353 1353 1353 1353 Q 38.3 739.7 65.9(1) 121.7 516.3 416.8(1) 12.8 516.3(1) 60.6 --- g kg-1--- --- mg kg-1 ---CLRNDM 35.3 1.8 20.5 11.1 2.6 3.2 105 89 22
Table 3 - Productivity for 90% of the maximum (P), ratio between productivity and nutrient content (Q), and critical level by the
reduced normal distribution method (CLRNDM) for cowpea plants grown in the Northeast region of Brazil
Similarly to the present study, some classes were excluded from those initially proposed in a study carried out with prickly pear (Opuntia ficus indica). Initially, 20 intervals were proposed, with decrease 10% (18 classes used), 15% (17 classes used), 45% (11 classes used), 30% (14 classes used) and 45% (11 classes used) of intervals for N, P, K, Ca and Mg, respectively, to construct the boundary line (BLANCO-MACIAS et al., 2009).
In the generation of quadratic equations by the boundary line for the database with mango, the models showed coefficients of determination (R2) from 0.50 to
0.85 (ALI, 2018) and for Opuntia ficus indica the estimates
of R2 were between 0.48 and 0.90 for macronutrients
(BLANCO-MACIAS et al., 2009), while in the present study for macronutrients, R2values greater than 0.81 were
obtained.
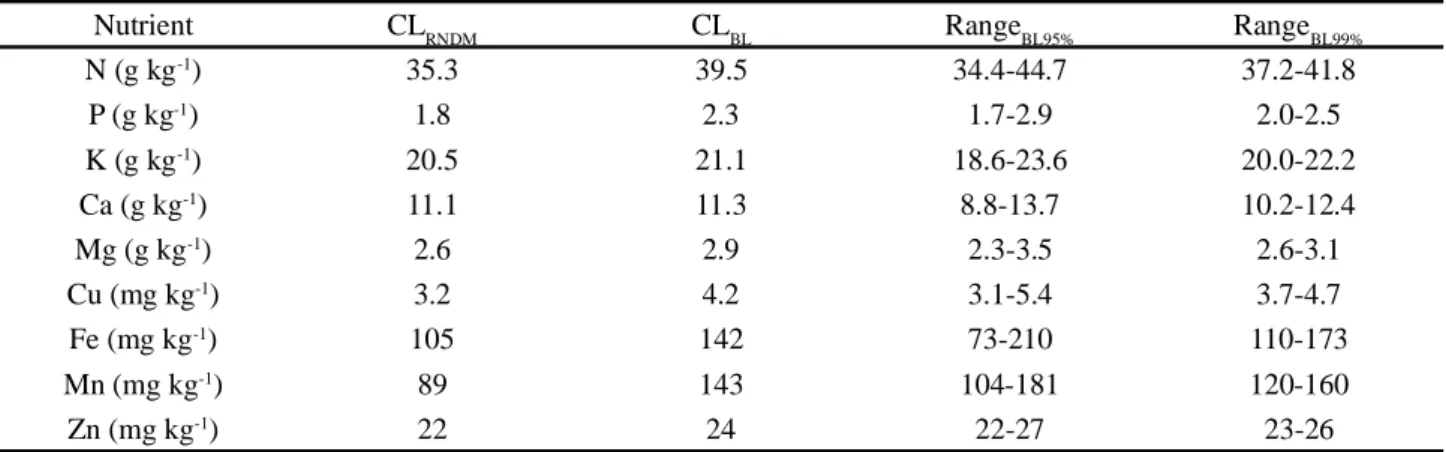
With the quadratic regression model, it was possible to generate the optimum value by nutrient and sufficiency ranges at 95% and 99% in relation to the maximum productivity, and the critical level estimated by the boundary line was higher than that estimated by the criterion of reduced normal distribution (Table 4).
In relation to the sufficiency ranges, the intervals generated from 95% of the maximum productivity show greater amplitude compared to the range generated from 99% of the maximum productivity (Table 4).
The values of critical levels by the two methods (reduced normal distribution and boundary line) were used to verify the percentage of data that would be considered deficient or below the optimal point, and for all nutrients the critical level by the boundary line showed a higher percentage in the deficient classification, except for Ca, which has the same frequency of 18.2% in both methods (Table 5).
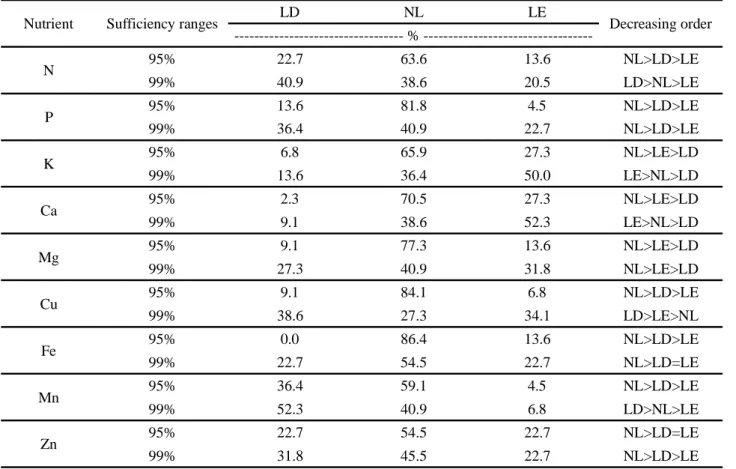
Considering the intervals of sufficiency ranges by the boundary line method, the samples were classified in the construction of the intervals as limiting due to deficiency (LD), non-limiting (NL) and limiting due to excess (LE), emphasizing that the diagnostic leaf was represented by the third trifoliate leaf of the cowpea crop, collected with the petiole, in the phase of flowering (Table 6).
For each nutrient the percentage showed the following decreasing order of classification considering the generation of the sufficiency range with 95 and 99% of the maximum productivity for the boundary line (BL 95% and BL 99%, respectively), being BL95% for N: NL>LD>LE and BL99% for N: LD>NL>LE, that is, each nitrogen sufficiency range promoted a distinct classification for the population studied, which was also verified for K, Ca and the micronutrients Cu, Fe, Mn and Zn.
Figure 1 - Relationship between the contents of macronutrients (N - a, P - b, K - c, Ca - d, Mg - e) and productivity in the construction
of the boundary line, for cowpea plants grown in the Northeast region of Brazil
The interpretations performed with the sufficiency ranges refer to different proportions for non-limiting, limiting due to excess and limiting due to deficiency for the nine nutrients evaluated; however, when the proposed range was obtained by the boundary line with 95% of the maximum productivity, in most diagnoses the limitation due to deficiency did not prevail, except for zinc.
For the range proposed by the boundary line with 99% of the maximum productivity, there was no predominance of a diagnosis; depending on the nutrient, there was a higher proportion of interpretation with limitation due to deficiency (N, Cu and Mn), due to excess (K and Ca) or no limitation (P, Mg, Fe and Zn).
Other techniques are used to generate sufficiency ranges or optimal points such as mathematical chance,
Figure 2 - Relationship between contents of micronutrients(Cu - a, Fe - b, Mn - c, Zn - d) and productivity in the construction of the
boundary line, for cowpea plants grown in the Northeast region of Brazil
Table 4 - Critical levels and sufficiency ranges for leaf samples by reduced normal distribution (RNDM) and boundary line (BL)
methods, for cowpea plants grown in the Northeast region of Brazil
Nutrient CLRNDM CLBL RangeBL95% RangeBL99%
N (g kg-1) 35.3 39.5 34.4-44.7 37.2-41.8 P (g kg-1) 1.8 2.3 1.7-2.9 2.0-2.5 K (g kg-1) 20.5 21.1 18.6-23.6 20.0-22.2 Ca (g kg-1) 11.1 11.3 8.8-13.7 10.2-12.4 Mg (g kg-1) 2.6 2.9 2.3-3.5 2.6-3.1 Cu (mg kg-1) 3.2 4.2 3.1-5.4 3.7-4.7 Fe (mg kg-1) 105 142 73-210 110-173 Mn (mg kg-1) 89 143 104-181 120-160 Zn (mg kg-1) 22 24 22-27 23-26
Table 5 - Frequency of contents of leaf samples below the critical level by the CLRNDM and CLBL methods, for cowpea plants grown in
the Northeast region of Brazil
Methods N P K Ca Mg Cu Fe Mn Zn
%
---CLRNDM 25.0 25.0 36.4 18.2 27.3 11.4 18.2 18.2 22.7
or by methods of evaluation of nutrient balance through the correlation between nutrient contents and the indices DRIS (Diagnosis and Recommendation Integrated System) or CND (Compositional Nutrient Diagnosis) (ALI, 2018; CAMACHO et al., 2012; MATOS; FERNANDES; WADT, 2016).
Among the diagnoses generated by nutrient balance methods (DRIS vs. CND), studies mention that CND has greater accuracy than DRIS (PARENT et al., 2013). Furthermore, studies suggest that the sufficiency ranges proposed by the boundary line show values close and comparable to those generated by the CND technique (BLANCO-MACÍAS et al., 2009, 2010; VIZCAYNO-SOTO; CÔTÊ, 2004).
The results obtained made it possible to propose critical levels and sufficiency ranges for cowpea, by the methods of the critical level by the reduced normal distribution and by the boundary line, and the generation of these ranges and levels contributes to the assessment of nutritional status and also contributes to the management of fertilizers.
CONCLUSIONS
1. The methods of reduced normal distribution and boundary line generated critical levels and sufficiency ranges for leaf diagnosis of macro- and micronutrients in cowpea;
2. The critical levels by reduced normal distribution and boundary line methods for leaf diagnosis of cowpea for N, P, K, Ca, Mg, Cu, Fe, Mn and Zn are, respectively, 35.3 and 39.5 g kg-1, 1.8 and 2.3 g kg-1, 20.5 and 21.2 g
kg-1, 11.1 and 11.3 g kg-1, 2.6 and 2.9 g kg-1, 3.2 and 4.2
mg kg-1, 105 and 142 mg kg-1, 89 and 143 mg kg-1, and
22 and 24 mg kg-1;
3. The sufficiency ranges by the boundary line method to achieve 95% of the maximum productivity for leaf diagnosis of cowpea for N, P, K, Ca, Mg, Cu, Fe, Mn and Zn are, respectively, 34.4 to 44.7 g kg-1, 1.7 to
2.9 g kg-1,18.6 to 23.6 g kg-1, 8.8 to 13.7 g kg-1, 2.3 to
3.5 g kg-1, 3.1 to 5.4 mg kg-1,73 to 210 mg kg-1,104 to
181 mg kg-1and 22 to 27 mg kg-1.
Table 6 - Frequency of contents of macro- and micronutrientsin leaf samples considered limiting due to deficiency (LD), non-limiting
(NL) and limiting due to excess (LE), according to sufficiency ranges proposed by the boundary line at 95% and 99% of maximum productivity, for cowpea plants grown in the Northeast region of Brazil
Nutrient Sufficiency ranges LD NL LE Decreasing order
% ---N 95% 22.7 63.6 13.6 NL>LD>LE 99% 40.9 38.6 20.5 LD>NL>LE P 95% 13.6 81.8 4.5 NL>LD>LE 99% 36.4 40.9 22.7 NL>LD>LE K 95% 6.8 65.9 27.3 NL>LE>LD 99% 13.6 36.4 50.0 LE>NL>LD Ca 95% 2.3 70.5 27.3 NL>LE>LD 99% 9.1 38.6 52.3 LE>NL>LD Mg 95% 9.1 77.3 13.6 NL>LE>LD 99% 27.3 40.9 31.8 NL>LE>LD Cu 95% 9.1 84.1 6.8 NL>LD>LE 99% 38.6 27.3 34.1 LD>LE>NL Fe 95% 0.0 86.4 13.6 NL>LD>LE 99% 22.7 54.5 22.7 NL>LD=LE Mn 95% 36.4 59.1 4.5 NL>LD>LE 99% 52.3 40.9 6.8 LD>NL>LE Zn 95% 22.7 54.5 22.7 NL>LD=LE 99% 31.8 45.5 22.7 NL>LD>LE
REFERENCES
ALI, A. M. Nutrient sufficiency ranges in mango using boundary-line approach and compositional nutrient diagnosis norms in El-Salhiya, Egypt. Communications in Soil Science and Plant
Analysis, v. 49, p. 188-201, 2018.
ALMEIDA, E. I. B. et al. Linha de fronteira e chance matemática na determinação do estado nutricional de pitaia. Revista Ciência
Agronômica, v. 47, p. 744-754, 2016.
BLANCO-MACÍAS, F. et al Comparison between CND norms and boundary-line approach nutrient standards: Opuntiaficus-indica L. case. Revista Chapingo Serie Horticultura, v. 15, p. 217-223, 2009.
BLANCO-MACÍAS, F. et al. Nutritional reference values for Opuntiaficus-indica determined by means of the boundary-line approach. Journal of Plant Nutrition and Soil Science, v. 173, n. 6, p. 927-934, 2010.
CAMACHO, M. C. et al. Faixas normais de nutrientes pelos métodos ChM, DRIS e CND e nível crítico pelo método de distribuição normal reduzida para laranjeira-pera. Revista
Brasileira de Ciência do Solo, v. 36, p. 193-200, 2012. COMPANHIA NACIONAL DE ABASTECIMENTO (BRASIL. Acompanhamento da safra brasileira: grãos.
Brasília: CONAB, 2019. v. 6, safra 2018/19, sétimo levantamento, abr. 2019.
FREIRE FILHO, F. R. et al. Feijão-caupi no Brasil: produção, melhoramento genético, avanços e desafios. Teresina: Embrapa Meio-Norte, 2011. 84 p.
LAFOND, J. Boundary-line approach to determine minimum and maximum leaf micronutrient concentrations in wild Lowbush blueberry in Quebec, Canada. International Journal of Fruit
Science, v. 13, p. 345-355, 2013.
LAFOND, J. Optimum leaf nutrient concentrations of wild lowbush blueberry in Quebec. Canadian Journal of Plant
Science, v. 89, p. 341-347, 2009.
MAIA, C. E.; MORAIS, E. R. C. Boundary line model to estimate the nutrient sufficiency range in muskmelon leaves.
Revista Brasileira de Ciência do Solo, v. 40, e016003, 2016.
MAIA, C. E.; MORAIS, E. R. C. Criticallevels for soilattributes in irrigated banana plantations in semiarid region. Revista
Brasileira de Engenharia Agrícola e Ambiental, v. 19, p.
926-930, 2015.
MAIA, C. E.; MORAIS, E. R. C.; OLIVEIRA, M. Nível crítico pelo critério da distribuição normal reduzida: uma nova proposta
para interpretação foliar. Revista Brasileira de Engenharia
Agrícola e Ambiental, v. 5, p. 235-8, 2001.
MATOS, G. S. B.; FERNANDES, A. R.; WADT, P. G. S. Níveis críticos e faixas de suficiência de nutrientes derivados de métodos de avaliação do estado nutricional da palma-de-óleo. Pesquisa Agropecuária Brasileira, v. 51, p. 1557-1567, 2016.
MELO, F. de B. et al. Cowpea response to phosphorus and zinc.
Revista Caatinga, v. 31, p. 240-245, 2018.
MIYAZAWA, M. et al. Análise química de tecido vegetal. In: SILVA, F. C. (ed.). Manual de análises químicas de
solos, plantas e fertilizantes. Brasília: Embrapa Informação
Tecnológica, 2009. p. 193-233.
PARENT, S. E. et al. Plant iononne diagnosis using sound balances: case study with mango (Mangiferaindica). Frontiers
in Plant Science, v. 4, p. 1-12, 2013.
QUESNEL, P. O. et al. Optimum nutrient concentrations and CND scores of mature white spruce determined using a boundary-line approach and spatial variation of tree growth and nutrition. Journal of Plant Nutrition, v. 29, p. 1999-2018, 2006.
SANTOS, E. F. et al. Faixas normais de nutrientes em cana-de-açúcar pelos métodos ChM, DRIS e CND e nível crítico pela distribuição normal reduzida. Revista Brasileira de Ciência do
Solo, v. 37, p. 1651-1658, 2013.
SOUZA, H. A. et al. Folha diagnóstica para avaliação do estado nutricional do feijoeiro. Revista Brasileira de Engenharia
Agrícola e Ambiental, v. 15, p. 1243-1250, 2011.
SOUZA, H. A. et al. Níveis críticos para atributos do solo pela distribuição normal reduzida em culturas anuais de subsistência.
Revista Brasileira de Engenharia Agrícola e Ambiental, v. 18,
p. 425-430, 2014.
VIZCAYNO-SOTO, G.; CÔTÊ, B. Boundary-line approach to determine standards of nutrition for mature trees from spatial variation of growth and foliar nutrient concentrations in natural environments. Communications in Soil Science and Plant
Analysis, v. 35, p. 2965-2985, 2004.
WEBB, R. A. Use of the boundary line in the analysis of biological data. Journal of Horticultural Science, v. 47, p. 309-319, 1972.
WITHERS, P. J. A. et al. Transitions to sustainable management of phosphorus in Brazilian agriculture. Scientific Reports, v. 8, [2537], 2018.