Critical ranges for leaf nitrogen and potassium levels in coffee
fertigated at the production phase
1Faixas críticas de teores foliares de nitrogênio e potássio para o cafeeiro fertirrigado
em fase de produção
Gleice Aparecida de Assis2*, Rubens José Guimarães3, Alberto Colombo4, Myriane Stella Scalco4 e Anderson William Dominghetti3
ABSTRACT - With the aim of establishing critical ranges for the leaf nitrogen (N) and potassium (K) levels in fertigated coffee crops under production, an experiment was carried out in the experimental area of the Sector for Coffee Cultivation of the Department of Agriculture at the Federal University of Lavras, in Brazil. Treatments consisted of five levels of fertilizer applied through fertigation: 30%, 80%, 130%, 180% and 230% of the recommended amounts of N and K for rainfed coffee grown in Minas Gerais. A randomised block design with four replications was used. Critical ranges for nutrient concentrations in the leaves were established from the results of growth characteristics (plant height and stem diameter), leaf analyses and productivity. The results obtained were: a) nitrogen (g kg-1): 32.39 to 32.40 for
January/February; 33.60 to 33.61 for March/April; 27.39 to 27.42 for May/June; 24.23 to 24.24 for July/August; 26.06 to 26.09 for September/October and 26.50 to 26.51 for November/December; b ) potassium (g kg-1): 20.08 to 20.14 for
January/February; 17.89 to 17.91 for March/April; 15.93 to 15.96 for May/June; 15.29 to 15.35 for July/August; 16.61 to 16.64 for September/October and 20.58 to 20.64 for November/December.
Key words:Coffea arabica L.. Irrigated coffee. Critical level. Foliar diagnosis.
RESUMO - Com o objetivo de estabelecer as faixas críticas de teores foliares de nitrogênio (N) e potássio (K) para lavouras cafeeiras em produção fertirrigada, foi conduzido um experimento no campo experimental do Setor de Cafeicultura do Departamento de Agricultura da Universidade Federal de Lavras. Os tratamentos constaram de cinco níveis de adubação aplicados via fertirrigação: 30%, 80%, 130%, 180% e 230% da recomendação de N e K para cafeeiros cultivados em sequeiro em Minas Gerais. Foi utilizado o delineamento em blocos casualizados com quatro repetições. Com os resultados das características de crescimento (altura de planta e diâmetro de caule), análises foliares e produtividade foram estabelecidas faixas críticas das concentrações de nutrientes nas folhas. Os resultados obtidos foram: a) nitrogênio (g kg-1): 32,39 a 32,40 em janeiro/fevereiro; 33,60 a 33,61 em março/abril; 27,39 a 27,42 em maio/
junho; 24,23 a 24,24 em julho/agosto; 26,06 a 26,09 em setembro/outubro e 26,50 a 26,51 em novembro/dezembro; b) potássio (g kg-1): 20,08 a 20,14 em janeiro/fevereiro; 17,89 a 17,91 em março/abril; 15,93 a 15,96 em maio/junho; 15,29
a 15,35 em julho/agosto; 16,61 a 16,64 em setembro/outubro e 20,58 a 20,64 em novembro/dezembro.
Palavras-chave:Coffea arabica L.. Cafeicultura irrigada. Nível crítico. Diagnose foliar.
*Autor para correspondência
1Recebido para publicação em 19/04/2013; aprovado em 22/10/2014
Parte de tese do primeiro autor apresentada na.Universidade Federal de Lavras; pesquisa financiada pelo Consórcio Pesquisa Café
2Instituto de Ciências Agrárias, Universidade Federal de Uberlândia, Campus Avançado de Monte Carmelo, Monte Carmelo- MG, Brasil,
38.500-000, [email protected]
3Departamento de Agricultura, Universidade Federal de Lavras, Lavras- MG, Brasil, 37.200-000, [email protected], [email protected] 4Departamento de Engenharia, Núcleo de Engenharia de Água e Solo, Universidade Federal de Lavras, Lavras-MG, Brasil, 37.200-000,
INTRODUCTION
In Brazil there are about 251,000 hectares of irrigated coffee, where average production potential yields 10 million bags per year. Of this area, 28.6%, corresponding to 71,700 hectares, is under drip irrigation. Irrigated crops have a productivity two to three times higher than the historical average of traditional, rainfed coffee-growing regions (SANTINATO; FERNANDES, 2012).
Among the numerous factors that affect productivity in coffee, mineral nutrition and fertilization should be highlighted. With the increasing use of irrigation and fertigation on crops in Brazil, there has been ongoing concern by producers and technicians with the nutritional status of plants grown under this system.
In Brazil the nutrient sufficiency range is one of the methods used to diagnosis the nutritional status of plants. For a more accurate evaluation, it becomes necessary to establish individual standards for each region and time of
year (MARTINEZet al., 2003).
There are studies which quantify the sufficiency
ranges for coffee seedlings (GONÇALVESet al., 2009;
GONTIJOet al., 2007), non-irrigated crops before becoming
established (CLEMENTEet al., 2008) and principally for
rainfed crops under production (MALAVOLTA, 1993;
MARTINEZet al., 2003). But for irrigated coffee under
production, nutritional recommendations are still based on the behaviour of the rainfed crop. This may compromise development of the plants and lead to a lack or excess of nutrients, due to irrigated coffee having a different pattern of growth and productivity to the non-irrigated crop, as suggested by the results of various studies (CARVALHO
et al., 2006;. REZENDEet al., 2010; SILVA; TEODORO;
MELO, 2008; SOBREIRAet al., 2011).
For rainfed crops under production, Martinezet al.
(2003) recommended for the districts of Guaxupé and São Sebastião do Paraíso, both in the state of Minas Gerais, Brazil (MG), a leaf nitrogen content of 28.30
to 32.00 g kg-1 and leaf potassium content of 19.70 to
30.30 g kg-1.
Silvaet al. (2001) found critical ranges for leaf content
of 29.10 to 30.50 g kg-1 for N and 15.70 to 17.60 g kg-1 for K
in non-irrigated coffee under production.
For a drip-irrigated crop at the production phase
in the district of Garanhuns, Pernambuco, Quintelaet al.
(2011) found that the critical range for leaf nitrogen varied from grain formation to maturity, with respective values
of 25.72 to 27.19 g kg-1 and 29.24 to 29.60 g kg-1.
This study was therefore carried out in order to establish the critical ranges for leaf nitrogen and
potassium levels in coffee crops under fertigation at the production phase.
MATERIAL AND METHODS
The work was carried out in the experimental area of the Sector for Coffee Cultivation of the Department of Agriculture at the Federal University of Lavras (UFLA), MG (21º14’06” S and 45º00’00” W, altitude 910 m), from 2011 to 2012.
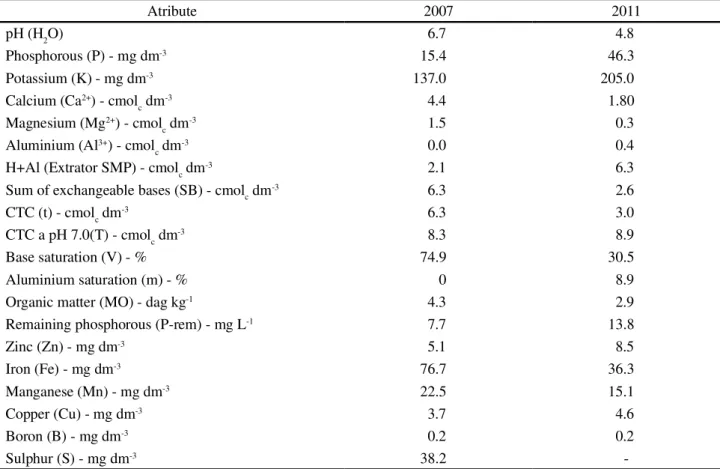
The soil of the experimental area, classified as a dystropheric Red Latosol of a clayey to very clayey texture, was analysed as to the chemical properties of the 0-20 cm layer, both at the beginning of the experiment (2007) and during the period of evaluation (Table 1).
The crop was planted in April 2007, at a spacing of 2.5 m between rows and 0.6 m between plants (6,666
plants ha-1). The cultivar used was the Catiguá MG-3
(Catuaí Amarelo IAC 86 x Timor Hybrid UFV 440-10). Treatments consisted of five levels of fertilization applied by fertigation: 30%, 80%, 130%, 180% and 230% of the recommended N and K for rainfed coffee plants, divided into four applications during the year,
(GUIMARÃESet al., 1999).
A randomised block design was used, with four replications. Each lot consisted of ten plants, with the eight central plants being considered. Double borders were left for each row, so that there would be no interference between treatments. The experiment
occupied an area of 900 m2 with 600 plants.
Based on soil analysis (Table 1) and the expected average productivity, the levels of fertilization considered as
standard were: 400 kg N ha-1 yr-1 and 75 kg K
2O ha-1, for 2011.
The dosages of N and K were therefore 120 kg N ha-1 yr-1
and 22.5 kg K2O ha-1; 320 kg N ha-1 yr-1 and 60 kg K
2O ha-1;
520 kg N ha-1 yr-1 and 97.5 kg K
2O ha-1; 720 kg N ha-1 yr-1 and
135 kg K2O ha-1, 920 kg N ha-1 yr-1 and 172.5 kg K
2O ha-1 for
fertilization levels of 30, 80, 130, 180 and 230% respectively. For all treatments, fertilization with nitrogen and potassium was carried out four times during the year (November, 2011 to February, 2012). The fertilizers used were urea (45% N) and potassium nitrate (13%
N and 44% K2O). The phosphorus, in the form of
single superphosphate, was applied in one dose (65 g per plant) when the crop was planted (April, 2007). The calcium and magnesium came from dolomitic limestone (PRNT = 80%) applied in August, 2011. For
the total area, 0.84 t ha-1 was applied.
Table 1 - Chemical attributes for the 0-20 cm layer of a dystropheric Red Latosol in 2007 and 2011
Atribute 2007 2011
pH (H2O) 6.7 4.8
Phosphorous (P) - mg dm-3 15.4 46.3
Potassium (K) - mg dm-3 137.0 205.0
Calcium (Ca2+) - cmol
c dm-3 4.4 1.80
Magnesium (Mg2+) - cmol
c dm-3 1.5 0.3
Aluminium (Al3+) - cmol
c dm-3 0.0 0.4
H+Al (Extrator SMP) - cmolc dm-3 2.1 6.3
Sum of exchangeable bases (SB) - cmolc dm-3 6.3 2.6
CTC (t) - cmolc dm-3 6.3 3.0
CTC a pH 7.0(T) - cmolc dm-3 8.3 8.9
Base saturation (V) - % 74.9 30.5
Aluminium saturation (m) - % 0 8.9
Organic matter (MO) - dag kg-1 4.3 2.9
Remaining phosphorous (P-rem) - mg L-1 7.7 13.8
Zinc (Zn) - mg dm-3 5.1 8.5
Iron (Fe) - mg dm-3 76.7 36.3
Manganese (Mn) - mg dm-3 22.5 15.1
Copper (Cu) - mg dm-3 3.7 4.6
Boron (B) - mg dm-3 0.2 0.2
Sulphur (S) - mg dm-3 38.2
-potassium chloride, copper oxychloride and 0.3% boric acid,
according to the recommendation of Guimarãeset al. (1999).
Along each crop row, a lateral line of self-compensating drippers was installed (flow of 3.8 litres per hour), spaced 0.3 m apart, forming a wet band 0.6 m in width below each line.
Irrigation management was by tensiometry. Tensiometers were installed at depths of 0.10, 0.25, 0.40, 0.60 m, about 0.10 m away from the base of the orthotropic branch of the plants. Irrigation was carried out whenever the soil water tension at a depth of 0.25 m reached values close to 20 kPa. The values for soil water tension corresponding to field capacity and wilting point, were 10 and 1,500 kPa respectively. The amount of water applied by irrigation, and the rainfall that took place in 2011, were 359.14 mm and 1,624.12 mm respectively.
The characteristics being evaluated were: plant height (cm) and stem diameter (cm); leaf nitrogen and
potassium levels (g kg-1), and the production of green coffee
beans in 60 kg sacks per hectare in 2012. Measurements for growth, and the determination of leaf nutrient levels were carried out bimonthly in 2011, giving six periods of
evaluation: E1 (January/February), E2 (March/April), E3 (May/June), E4 (July/August), E5 (September/October) and E6 (November/December).
Because coffee production is determined based on the growth/development of the crop in the previous year (RENA; MAESTRI, 1986), production data referring to 2012 were used so as to relate them to the levels of fertilization used in 2011.
To evaluate leaf nutrient levels, leaves were collected at the same time growth was measured. From each lot, 32 leaves were sampled from the third or fourth leaf pair, counting from the apex of the plagiotropic branch
at middle height on the plant (MARTINEZet al., 2003).
resulted in levels of over 90% of the maximum growth/ productivity of the plants. These levels were substituted in the regression equations that describe the leaf nutrient levels for each sampling period, in order to determine the critical ranges
of N and K (CLEMENTEet al., 2008).
The data were subjected to variance analysis using the SISVAR software (FERREIRA, 2008). The variables that describe the growth of the coffee plant and leaf nutrient levels were analysed in a scheme of lots split by time, using as sub-lots the level of fertilization, lot and period of evaluation.
RESULTS AND DISCUSSION
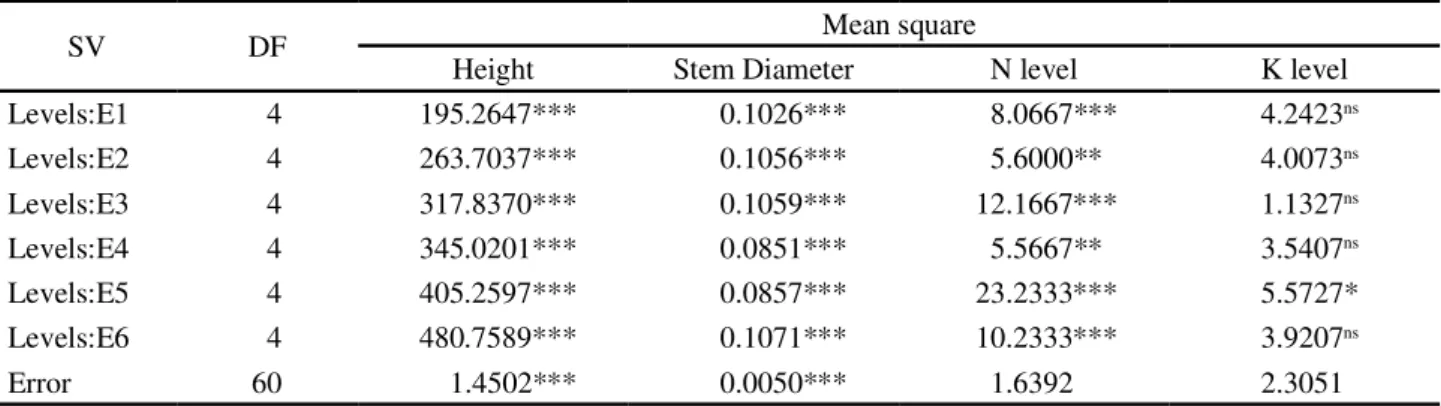
There was significant interaction between period of evaluation and fertilization levels (P<0.01) for all growth characteristics (Table 2).
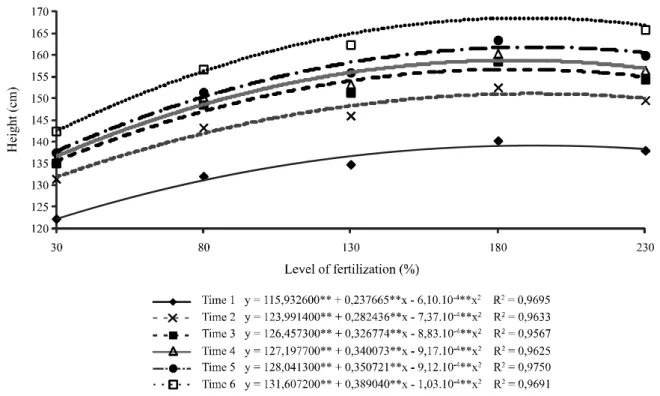
The levels of fertilization allowed the adjustment of quadratic models to the characteristic of plant height for all periods of evaluation (Figure 1).
Deriving the equations presented in Figure 1, it was seen that the levels of fertilization that gave maximum plant height varied for each period of evaluation, suggesting that there is a need for applying different amounts of fertilization throughout the year to better meet the needs of the crop.
Obtaining the points of maximum growth for this characteristic was achieved with levels of 194.81, 191.61, 185.04, 185.43, 192.28 and 189.59 % of the reference fertilization, for the periods E1, E2, E3, E4, E5 and E6 respectively. These levels are above the recommended level of 100% standard fertilization proposed by Guimarães
et al. (1999). This increase can be attributed mainly to
Table 2 - Summary of variance analysis for the breakdown of fertilization levels within each period, for height, stem diameter, and leaf nitrogen and potassium levels in 2011
SV - Source of variation; DF - Degree of freedom; ns - not significant, *** significant at 1%,** significant at 5%, * significant at 10% probability by F-test
SV DF Mean square
Height Stem Diameter N level K level
Levels:E1 4 195.2647*** 0.1026*** 8.0667*** 4.2423ns
Levels:E2 4 263.7037*** 0.1056*** 5.6000** 4.0073ns
Levels:E3 4 317.8370*** 0.1059*** 12.1667*** 1.1327ns
Levels:E4 4 345.0201*** 0.0851*** 5.5667** 3.5407ns
Levels:E5 4 405.2597*** 0.0857*** 23.2333*** 5.5727*
Levels:E6 4 480.7589*** 0.1071*** 10.2333*** 3.9207ns
Error 60 1.4502*** 0.0050*** 1.6392 2.3051
the use of irrigation in the experiment, which promoted higher productivity and therefore a higher demand for nutrients. Similar results of increased fertilization levels in irrigated coffee plants at the production phase were
obtained by Costaet al. (2010).
As with plant height, there was adjustment of the quadratic polynomial model to stem diameter in all periods of evaluation (Figure 2).
The maximum growth for this characteristic was reached with fertilization levels of 174.44, 169.83, 173.41, 167.41, 164.22 and 176.10% for E1, E2, E3, E4, E5 and E6 respectively. Stem diameter is one of the vegetation attributes that most contribute to productivity in the coffee
plant (CARVALHOet al., 2010; FREITASet al., 2007).
It is therefore likely that the levels of fertilization which provided maximum stem diameter in the plants for each period are located close to the ideal level of fertilization for coffee productivity.
For the productivity of green coffee in 2012, the quadratic equation presented a suitable adjustment to the
data (R2 = 0.92) (Figure 3).
It is evident from this model that productivity reaches
a peak of 82.72 bags ha-1 when using a fertilization level
of 179.91%. After reaching this maximum, productivity decreases in response to the higher levels of fertilization, possibly indicating a nutritional imbalance, especially between potassium and the secondary macronutrients of calcium and magnesium that compete for the same absorption
sites (MALAVOLTAet al., 1993; SILVAet al., 2001).
Following the methodology used by Clemente et
al. (2008) with the aim of establishing the critical range
Figure 1 - Height of fertigated coffee plants subjected to levels of nitrogen and potassium fertilization for six periods of evaluation
** Significant at de 1% probability by F-test
of the lower limits and the lowest value of the upper limits of the levels of fertilization for each evaluation period found in Table 3. These would later be substituted in the equations
Figure 2 - Stem diameter of fertigated coffee plants subjected to levels of nitrogen and potassium fertilization for six periods of evaluation
** Significant at 1% probability by F-test
Figure 3 - Productivity of fertigated coffee plants subjected to levels of nitrogen and potassium fertilization
Table 3 - Points for maximum height and stem diameter, 90% of the maximum and levels of fertilization suitable for fertigated coffee
plants subjected to levels of nitrogen and potassium fertilization for six periods of evaluation
* Level of fertilization with reference to maximum point Caracteristic Sampling period
under evaluation
Level of fertlization*
Maximum point (y)
90% of maximum (y)
Level of fertilization (%) corresponding to 90% of maximum
Lowest Highest
Height (cm)
E1 194.81 139.08 125.17 43.80 345.82
E2 191.61 151.05 135.94 48.45 334.78
E3 185.04 156.69 141.02 51.83 318.25
E4 185.43 158.73 142.86 53.87 316.98
E5 192.28 161.76 145.58 59.10 325.46
E6 189.59 168.49 151.64 61.46 317.73
Stem diameter (cm)
E1 174.44 4.63 4.17 173.90 174.97
E2 169.83 4.83 4.35 169.31 170.35
E3 173.41 4.94 4.45 172.85 173.96
E4 167.41 5.09 4.58 166.84 167.97
E5 164.22 5.15 4.64 163.66 164.78
E6 176.10 5.30 4.77 175.51 176.69
Productivity (sacks ha-1) 2012 179.91 82.72 74.45 118.69 230.00
coffee (GUIMARÃES et al., 1999). As the productivity
of irrigated coffee is significantly higher compared to rainfed conditions, this increase in fertilization is consistent
with several other results in the literature (COSTAet al.,
2010;. REZENDEet al., 2010; SCALCOet al., 2011). In
Another important factor to be considered is that, for the characteristics of growth, the lower and upper limits of fertilization levels (Table 3) are within the ranges for fertilization that made it possible to achieve at least 90% maximum productivity: 118.69% and 241.13% NK respectively. It is therefore consistent to use growth variables to determine the critical ranges, since these fall within the range established for productivity.
In the evaluation of leaf nitrogen and potassium levels, a significant effect was seen for leaf nitrogen content from the interaction between the levels and periods of fertilization. For potassium, there was a significant effect of fertilization levels on the leaf content of that nutrient for period five only (Table 2).
For the periods when significant effects of fertilization levels on the leaf content of N and K were not detected, the critical ranges were determined by interpolation of the data seen for these periods when using the lower and upper limits of those fertilization levels (Table 3) which made it possible to achieve at least 90% of maximum crop growth.
There was quadratic adjustment of leaf nitrogen content as a function of the fertilization levels for all periods, except May/June (Figure 4). The points of maximum leaf content were 32.59, 33.70, 24.27, 26.64
Figure 4 - Levels of N (g kg-1) in leaves of fertigated coffee plants subjected to levels of nitrogen and potassium fertilization
for six periods of evaluation
**; * Significant at 1% e 5% probability
and 26.51 g kg-1 respectively for periods E1, E2, E4, E5
and E6.
In January/February, a sufficiency level of
32.39 to 32.40 g kg-1 nitrogen was found. These values
are close to the upper limit (31.0 g kg-1) of the critical
reference range for rainfed crops under production
(MALAVOLTAet al., 1993).
The critical range determined for March/
April was 33.60 to 33.61 g kg-1, being above the
recommendation for non-irrigated crops proposed
by Malavolta et al. (1993), namely 26 to 31 g kg-1.
The nutritional requirement of the coffee plant in the transition stage between grain formation and fruit
maturity is relatively high (MATIELLOet al., 2010),
especially in fertigated crops, which have greater production in relation to rainfed crops, explaining the higher levels of leaf nitrogen found in this work.
For the third period (May/June), there was increasing linear adjustment of leaf nitrogen content as a function of increased fertilization levels. Thus there
is an increase of 0.246 g kg-1 in leaf nitrogen content
for every 10% increase in the levels of N and K. During this period, sufficiency levels of 27.39 to
27.42 g kg-1 were found, being close to the lower limit
Martinezet al. (2003) found values for nitrogen for the
whole year of between 28.30 and 32.00 g kg-1 for rainfed
crops under production.
In July/August, the lowest leaf nitrogen
content was 21.50 g kg-1 for a fertilization level of
30%, and 23.23 g kg-1 for the highest level (230%).
The determined sufficiency levels were from 24.23 to
24.24 g kg-1, being below the recommendation (26.00
to 29.00 g kg-1) made by Malavoltaet al. (1993) for a
rainfed crop.
For periods E5 (September/October) and E6 (November/December), sufficiency levels were
between 26.06 to 26.09 and 26.50 to 26.51 g kg-1
respectively. For the same period, however for
non-irrigated crops under production, Malavolta et al.
(1993) recommend leaf nitrogen levels of between
28.00 and 32.00 g kg-1. The use, with irrigated coffee,
of critical ranges established for rainfed crops, could cause so-called “luxury consumption” or even toxicity in the irrigated plants, with a decrease in the growth/ production of the crop.
For leaf potassium levels there was significant
adjustment (R2 = 0.80) of the quadratic model to the leaf
content of this nutrient in period E5 only (September/ November) (Figure 5).
The highest levels for leaf potassium content
were 18.51 g kg-1 for a fertilization level of 30%, and
19.08 g kg-1 for 230%. The minimum point for leaf
Figure 5 - Levels of K (g kg-1) in leaves of fertigated coffee plants subjected to levels of nitrogen and potassium fertilization for six
periods of evaluation
**; * Significant at 1% e 5% probability
content was 16.22 g kg-1. The difference between the
highest and lowest levels was 0.57 g kg-1.
The sufficiency levels determined for
September/October were 16.61 to 16.64 g kg-1, which
are values close to those found by Silvaet al. (2001)
who suggested leaf potassium levels for coffee crops
under production of between 15.70 and 17.60 g kg-1
for the whole year. However, these values are lower
than those recommended by Malavoltaet al. (1993) for
non-irrigated coffee plants under production for that
period (22.00 to 25.00 g kg-1). Thus, for the same time
of year, irrigated crops have less need for potassium than rainfed crops, which makes it possible to infer that for future studies on the division of fertilization of irrigated crops into different amounts of potassium per application, a smaller amount should be adopted for the same period.
For periods E1, E2, E3, E4 and E6, adjusted leaf potassium levels are respectively: 20.08 to 20.14, 17.89 to 17.91, 15.93 to 15.96, 15.29 to 15.35 and 20.58 to
20.64 g kg-1. These values are lower than the critical
ranges for rainfed crops under production determined
by Malavoltaet al. (1993).
The critical ranges presented for nitrogen and potassium in the present study are consistent with the
values suggested by Martinez et al. (2003) and Silva
et al. (2001). The differences found in leaf content for
CONCLUSIONS
Sufficiency levels for nitrogen and potassium in fertigated coffee crops under production are:
1. Nitrogen (g kg-1): 32.39 to 32.40 in January/February;
33.60 to 33.61 in March/April; 27.39 to 27.42 in May/June; 24.23 to 24.24 in July/August; 26.06 to 26.09 in September/ October and 26.50 to 26.51 in November/December;
2. Potassium (g kg-1): 20.08 to 20.14 in January/February;
17.89 to 17.91 in March/April; 15.93 to 15.96 in May/June; 15.29 to 15.35, in July/August; 16.61 to 16.64 in September/October and 20.58 to 20.64 in November/December.
ACKNOWLEDGEMENTS
The authors wish to thank CNPq for granting a Junior Postdoctoral scholarship to the first author of the work. Thanks are also due to the Brazilian Coffee Research Consortium and the Foundation for Research Support of the State of Minas Gerais (FAPEMIG) for their financial support.
REFERENCES
CARVALHO, A. M. et al. Correlação entre crescimento e
produtividade de cultivares de café em diferentes regiões de Minas Gerais, Brasil.Pesquisa Agropecuária Brasileira, v. 45, n. 3, p. 269-275, 2010.
CARVALHO, C. H. M. et al. Evolução do crescimento do
cafeeiro (Coffea arabica L.) irrigado e não irrigado em duas
densidades de plantio.Ciência e Agrotecnologia, v. 30, n. 2, p. 243-250, 2006.
CLEMENTE, F. M. V. T.et al. Faixas críticas de teores foliares
de macronutrientes no cafeeiro em pós-plantio - Primeiro Ano.
Coffee Science, v. 3, n. 1, p. 47-57, 2008.
COSTA, A. R. et al. Número de ramos plagiotrópicos e
produtividade de duas cultivares de cafeeiro utilizando irrigação por gotejamento.Revista Ciência Agronômica, v. 41, n. 4,
p. 571-581, 2010.
FERREIRA, D. F. SISVAR: um programa para análises e ensino de estatística.Revista Symposium, v. 6, n. 1, p. 36-41, 2008.
FREITAS, Z. M. T. S. et al. Avaliação de caracteres quantitativos relacionados com o crescimento vegetativo entre cultivares de café arábica de porte baixo.Bragantia,
v. 66, n. 2, p. 267-275, 2007.
GONÇALVES, S. M.et al. Faixas críticas de teores foliares de micronutrientes em mudas de cafeeiro (Coffea arabica L.)
produzidas em tubetes.Revista Ciência e Agrotecnologia, v. 33, n. 3, p. 743-752, 2009.
GONTIJO, R. A. N. et al. Faixas críticas de teores foliares de
micronutrientes em mudas de cafeeiro (Coffea arabica L.). Coffee Science, v. 2, n. 2, p. 135-141, 2007.
GUIMARÃES, P. T. G. et al. Cafeeiro. In: RIBEIRO, A. C.; GUIMARÃES, P. T. G.; ALVAREZ, V. V. H. (Ed.).
Recomendação para o uso de corretivos e fertilizantes em Minas Gerais: 5a aproximação. Viçosa: Comissão de Fertilidade
do Solo do Estado de Minas Gerais, 1999. p. 289-302.
MALAVOLTA, E.et al.Seja o doutor do seu cafezal. Piracicaba: Potafos, 1993. 36 p. (Arquivo do Agrônomo, 3)
MARTINEZ, H. E. P. et al. Faixas críticas de concentrações
de nutrientes e avaliação do estado nutricional de cafeeiros em quatro regiões em Minas Gerais. Pesquisa Agropecuária Brasileira, v. 38, n. 6, p. 703-713, 2003.
MATIELLO, J. B.et al.Cultura de café no Brasil:manual de recomendações. Rio de Janeiro: MAPA/PROCAFÉ, 2010. 542 p. QUINTELA, M. P.et al. Parâmetros produtivos e nutricionais
do cafeeiro submetido adubação nitrogenada na região de Garanhuns.Revista Caatinga, v. 24, n. 4, p. 74-79, 2011. RENA, A. B.; MAESTRI, M. Fisiologia do cafeeiro.In: RENA,
A. B.et al. (Ed.).Cultura do cafeeiro: fatores que afetam a produtividade. Piracicaba: Associação Brasileira para Pesquisa da Potassa e do Fosfato, 1986. p. 13-85.
REUTER, D. J.; ROBINSON, J. B. Plant analysis: an interpretation manual. Melbourne: Inkata, 1988. 218 p. REZENDE, F. C. et al. Cafeeiro recepado e irrigado em
diferentes épocas: produtividade e qualidade.Coffee Science, v. 5, n. 3, p. 229-236, 2010.
SANTINATO, R.; FERNANDES, A. L. T. Cultivo do cafeeiro irrigado por gotejamento. 2. ed. Uberaba, 2012. 388 p. SCALCO, M. S. et al. Cultivo irrigado e não irrigado do
cafeeiro em plantio superadensado.Coffee Science, v. 6, n. 3,
p. 193-202, 2011.
SILVA, C. A. da; TEODORO, R. E. F.; MELO, B. de. Produtividade e rendimento do cafeeiro submetido a lâminas de irrigação.Pesquisa Agropecuária Brasileira, v. 43, n. 3, p. 387-394, 2008.
SILVA, E. B.et al. Adubação potássica do cafeeiro: produção,
faixas críticas de nutrientes no solo e nas folhas. Ciência e Agrotecnologia, v. 25, n. 4, p. 801-811, 2001.
SOBREIRA, F. M.et al. Adubação nitrogenada e potássica de
cafeeiro fertirrigado na fase de formação, em plantio adensado.