STATISTICAL PROCESS CONTROL
Avaliação de instrumentos para medição de turbidez através do controle estatístico do processo
Lucas de Paula Ferreira Souza1, Cláudio Milton Montenegro Campos2
ABSTRACT
The quality management system (QMS) and environmental management system (EMS) are currently being widely developed in laboratories, and have contributed to significant improvements in measurement management processes and client opinion. The purpose of this work is to establish appropriate methodologies for assessing the turbidity measurement that guarantee the quality of the results concerning precision and accuracy and also to test the service performance of the Water Analysis Laboratory of the Engineering Department (LAADEG) of Federal University of Lavras (UFLA). The research assessed two bench turbidimeters “A and B” through a statistical process capability study, analyzing the potential capability indexes (Cp) and performance capability (Cpk). We identified special causes also present in the control through non predetermined random patterns. After the studies, it was found that turbidimeter “B” should be used for all turbidity measurements in LAADEG, since its precision was higher than turbidimeter “A”.
Index terms: Precision, accuracy, testing, quality management.
RESUMO
Os sistemas de gestão da qualidade (SGQ) e ambiental (SGA) vêm sendo amplamente desenvolvidos em laboratórios nos dias atuais, o que tem contribuindo com melhorias significativas nos processos de gestão da medição e na visão dos clientes. Objetivou-se com este artigo avaliar a medição de turbidez para garantir a qualidade dos resultados das análises para a execução dos serviços de ensaios do Laboratório de Análise de Água do Departamento de Engenharia (LAADEG) da Universidade Federal de Lavras (UFLA). Avaliaram-se dois turbidímetros de bancada “A e B” por meio de estudo estatístico de capacidade do processo, analisando os índices de capacidade potencial (Cp) e capacidade de desempenho (Cpk). Identificaram-se, também, as causas especiais presentes nas cartas de controle, utilizando-se de padrões não aleatórios estabelecidos previamente. Após os estudos, definiu-se que deverá ser utilizado o turbidímetro “B” para a realização de todas as medições de turbidez no LAADEG.
Termos para indexação: Precisão, exatidão, ensaio, gestão da qualidade.
(Received in march 30, 2012 and approved in june 19, 2012)
1Centro Universitário de Formiga/UNIFOR – Av. Dr. Arnaldo de Senna – 328 – Água Vermelha – 35570-000 – Formiga – MG – Brasil – depaula.lucas@oi.com.br 2Universidade Federal de Lavras/UFLA – Departamento de Engenharia/DEG – Lavras – MG – Brasil
INTRODUCTION
The implantation of a quality program, such as statistical process control (SPC), in a laboratory represents a powerful tool capable of creating more favorable conditions for the various measurement processes. In addition to these gains, the concern with the continuous improvement of processes and services provided is also evident.
The purpose of this work was to establish appropriate methodologies for assessing the turbidity measurement that guarantee the quality of the results in precision and accuracy and to also test the performance of the services at the laboratory (LAADEG).
A process control system can be described as one that feedsback the system with information that will lead to taking control of actions and allowing improvements. To understand such a definition, Souza, Oliveira and
Campos (2003) described the concept “Process” as being the set of causes that, working in an articulated manner, produce one or more effects. In a laboratory process it can be defined as the combination of suppliers, people, equipment, materials, methods and environments that are combined in order to produce a result.
According to Montgomery (2004), the control chart or control graph is one of the basic tools used in SPC quality. Its main goal is to reduce the variability of the process, leading to stability (equilibrium or stability statistics).
variations. These causes have unstable distribution and are generally easy to identify (SOUZA; OLIVEIRA; CAMPOS, 2003).
For Oliveira (2000), the motivation to use the SPC can be described by the need for inspection and tests, in order to achieve certainty in measurements. Monitoring of special causes in the process allows the reduction of their variability.
Souza, Oliveira and Campos (2003) concluded that the SPC is a statistical tool, which works to both ensure the quality of the final product, and reduce costs with product inspections and analyses. The great advantage of using SPC is that this statistical method leads to the use of other quality management methods, such as team discussion on possible causes of the instability, tracing process stages to the location of a particular cause, among others.
As for metrology, this is defined as the science which deals with the study, definition an d standardization of all means of measurement, or even is the field of knowledge of the theoretical and practical aspects of measurements, whatever their level of accuracy and in any field of science or technology (PRAZERES, 1996). It can be considered a branch of statistics in a large part of its conceptual and methodological body, such as when concepts and methods involving accuracy and resolution, among others, are involved (WAENY, 1980).
MATERIAL AND METHODS
This work was carried out to evaluate the turbidity measurement instruments and was developed from “SPC” statistical analyses, using two turbidimeters and their respective LAADEG standards solutions.
The statistical analysis and graphic measurement system were accomplished through the use of control charts for monitoring the results of the characteristics measured by the measuring instruments. These control charts, for the stability assessment of the process, used non-random viewing patterns that demonstrated the special causes ID acting in the measurement system, as shown in figure1.
The instruments used to carrying out the statistical studies are listed below:
a) Turbidimeter “A” for turbidity measurement with R of 0.01 NTU and 0 to 1000 NTU;
b) Turbidimeter “B” for turbidity measurement with R of 0.01; 0.1 and 1 NTU according to the measurement range and capacity from 0 to 1000 NTU;
Statistical studies were carried out from data obtained from thirty measurements of standard solutions for the turbidimeters “A” and “B”, for the turbidimeter “A”, we used the original standard solution of 203.0 ± 7 NTU (188.79 the 217.21 NTU) and the turbidimeter “B”, the original standards and solutions of 0.80 and 8.00 NTU was used. The instruments were calibrated before measurements.
1º A point outside of control limits
ULC
LLC
2º Sequence of seven consecutive points above or below the AL
ULC
LLC
3º Trend of seven consecutive points, decreasing or increasing
ULC
LLC
4º Sequence of fourteen consecutive points in the range C
ULC
LLC
5º Two of three consecutive points in the range A
ULC
LLC
Non-random Patterns
B A C B C A
B A C B C A
B A
C B C A
B A C B C A
B A C B C A
AL AL
AL
AL AL
Figure 1 – Non-randomness of process patterns.
The results of statistical studies using the model proposed by Souza, Oliveira and Campos (2003), which deals with an application in Excel® called CEPLAB, expresses the statistical tool of quality and therefore, the statistical process control (SPC).
calculations of statistical indexes of ranges, concerning process capability in terms of potential capacity (Cp) and performance capability (Cpk) which in turn can also be translated into the evaluation of measuring instruments. All control chart and potential capability indexes (Cp) and performance (Cpk) threshold calculations were obtained from the Statistical Process Control equations tool.
RESULTS AND DISCUSSION
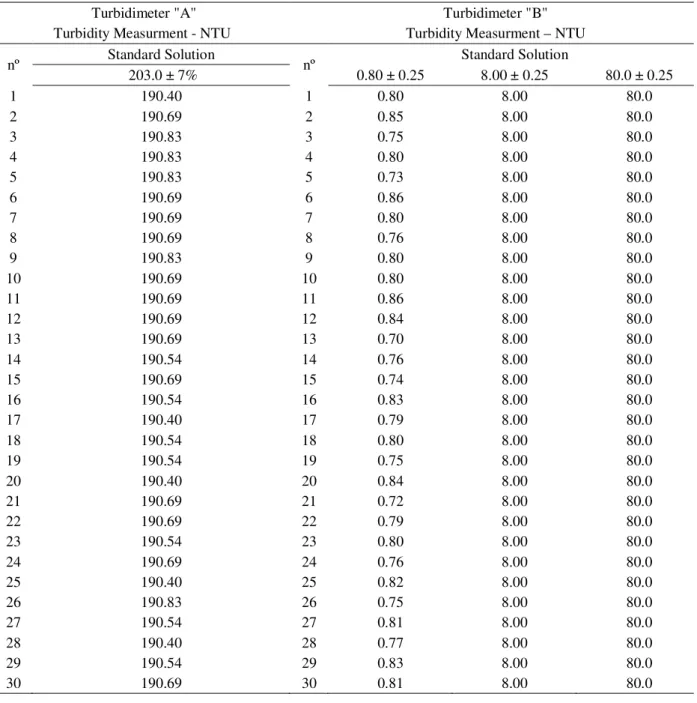
Table 1 shows the values obtained from the standard turbidity solution readings in the test instruments.
For the discussion of statistical studies, the measurement controls were presented graphically for the turbidity variable obtained from the turbidimeter “A” with the repetition of thirty standard solution measurements 203.0 ± 7 NTU (Figure 2).
Table 1 – Turbidity readings of standard solutions.
Turbidimeter "A" Turbidimeter "B" Turbidity Measurment - NTU Turbidity Measurment – NTU
nº Standard Solution nº Standard Solution
203.0 ± 7% 0.80 ± 0.25 8.00 ± 0.25 80.0 ± 0.25
1 190.40 1 0.80 8.00 80.0
2 190.69 2 0.85 8.00 80.0
3 190.83 3 0.75 8.00 80.0
4 190.83 4 0.80 8.00 80.0
5 190.83 5 0.73 8.00 80.0
6 190.69 6 0.86 8.00 80.0
7 190.69 7 0.80 8.00 80.0
8 190.69 8 0.76 8.00 80.0
9 190.83 9 0.80 8.00 80.0
10 190.69 10 0.80 8.00 80.0
11 190.69 11 0.86 8.00 80.0
12 190.69 12 0.84 8.00 80.0
13 190.69 13 0.70 8.00 80.0
14 190.54 14 0.76 8.00 80.0
15 190.69 15 0.74 8.00 80.0
16 190.54 16 0.83 8.00 80.0
17 190.40 17 0.79 8.00 80.0
18 190.54 18 0.80 8.00 80.0
19 190.54 19 0.75 8.00 80.0
20 190.40 20 0.84 8.00 80.0
21 190.69 21 0.72 8.00 80.0
22 190.69 22 0.79 8.00 80.0
23 190.54 23 0.80 8.00 80.0
24 190.69 24 0.76 8.00 80.0
25 190.40 25 0.82 8.00 80.0
26 190.83 26 0.75 8.00 80.0
27 190.54 27 0.81 8.00 80.0
28 190.40 28 0.77 8.00 80.0
29 190.54 29 0.83 8.00 80.0
Turbidity amplitude measurements "turbidimeter A" (Standard Solution 203.0 ± 7% NTU)
0.00 0.05 0.10 0.15 0.20 0.25 0.30 0.35 0.40 0.45
0 2 4 6 8 10 12 14 16 18 20 22 24 26 28 30
Repetitions
V
ar
ia
ti
on
(
N
T
U
) A
B
A C
B C
ULC
LLC AL
Turbidity measurements "turbidimeter A" (Standard Solution 203.0 ± 7% NTU)
190.20 190.30 190.40 190.50 190.60 190.70 190.80 190.90 191.00
0 2 4 6 8 10 12 14 16 18 20 22 24 26 28 30
Repetitions
V
alu
es
(N
T
U
) AB
A C
B C
ULC
LLC AL
Figure 2 – Control charts and measures for the amplitudes obtained for the turbidity variable of the calibration solution 203.0 ± 7 NTU in turbidimeter “A”.
It can be observed that, although the standard allowed a solution variation of plus or minus 7 in relation to the nominal value of 203.0 NTU, the average for the thirty observations was 190.63 NTU (Figure 2), the variation being interpreted as high for turbidity measurement results, i.e. a value of 12.37 NTU below the standard value. It is necessary that LAADEG purchase a new standard solution, preferably of a nominal value near 10 NTU since it is approximately the average number of results that the LAADEG provides, and afteward, perform a new study for evaluation of the equipment in question.
The non-random patterns identified earlier in figure 1 are identified in control charts (Figure 2) with a symbol () that identifies the type of non-random pattern that exists in the graphics, for which action must be carried out to eliminate the possible special causes that act directly on the measuring instrument stability.
Analyzing the first turbidity measurement chart from the seventh consecutive point above the Average Limit (AL), repetitions 8 to 13 shall be deemed to be
non-random patterns because there is a sequence of repetitions in the results (Figure 2). The cause may be associated to a vice of the measurement instrument to produce equal or very close results, especially at the beginning of the readings, which can already be seen from Repetition 2.
repetitions 29 and 30 indicate a sequence of seven and eight points above the AL. A wide variation can be observed at the end of the turbidity graph and increased values in the amplitude graph. It is necessary that the LAADEG formally establish a measurement limit or time limit for the calibration of each measuring instrument in a work procedure statement.
Figure 3 presents the results of the statistical study calculations for the standard turbidity solution variable obtained from the turbidimeter A.
Two important parameters to be assessed in figure 3 are the measurement process capacity indexes, being potential capacity (Cp); and performance capacity (Cpk). As the standard solution allows a variation of 7%, plus or minus, than the nominal amount of 203.0 NTU, the design specification was determined to meet the solution and the measuring instrument. Thus the Lower Limit Specification (LLS) is 188.79 NTU and the Upper Limit Control (ULC) is 217.21 NTU, the design specification being 28.42 NTU (high for the measurement process).
For the defined project specification, the Cp index is very good, since the maximum variation between
repetitions was 0.43 NTU, being a very small variation in relation to the project tolerance, which is therefore 28.42 NTU and Cp of 41.32 that meets the criterion of being greater than 1.33. The Cpk index is also considered good, although the average presents a value of 12.37 NTU, below the nominal value, but still above the LLS; therefore the Cpk of 5.35 also meets the criterion of being greater than 1.33.
For statistical index calculations, it was felt that the turbidimeter or nephelometer may be submited to a maximum of total variation of 2 NTU, for turbidity measurements in the same sample (for turbidity measurements over 40 NTU). In this present case the standard solution nominal value is 203.0 NTU, and the project specifications would be an LLS of 202 NTU and ULC of 204 NTU. For these specification values and the thirty repetitions, the Cp would be 2.91, continuing to meet the criterion, since 0.43 NTU would be a small variation for a tolerance of 2 NTU. The Cpk would be -33.06, that does not meet the criterion, since the average of repetitions is 12.37 NTU, below the nominal value.
Graph Rm Potential Capacity Index =>Cp 41.32
Average of amplitudes R 0.1
Number of obs. 2 Performance Index ======> Cpk 5.35
Factor D3 0
Factor D4 3.267 The process will be capacitated if:
LLC 0 - There are only common causes operating in the process; AL 0.1 - There are no visually identified non-random patterns; ULC 0.4 - Cp and Cpk are greater or equal to 1.33
Graph Measures
Average X 190.6 d2 1.128
Factor E2 2.660 Sigma (σ) 0.11
LLC (Fixed) 190.29 Zi 16.05
AL (Fixed) 190.63 Zs 231.86
ULC (Fixed) 190.97 Zmin 16.05
LLC (Mobile) 190.29
AL (Mobile) 190.63 Cp => Measures the ability to produce grouped data ULC (Mobile) 190.97 Cpk => Measures the ability to produce acceptable data
LIE (Project) 188.79 OBS: When Cp = Cpk (Zi = Zs), it is said that the process
LSE (Project) 217.21 is centered, that is, it varies around the mean.
Calculations for Graph Statistical Process Capacity Study
Process performance and capacity indicators
Turbidimeter A (standard solution 203.0 ± 7% NTU)
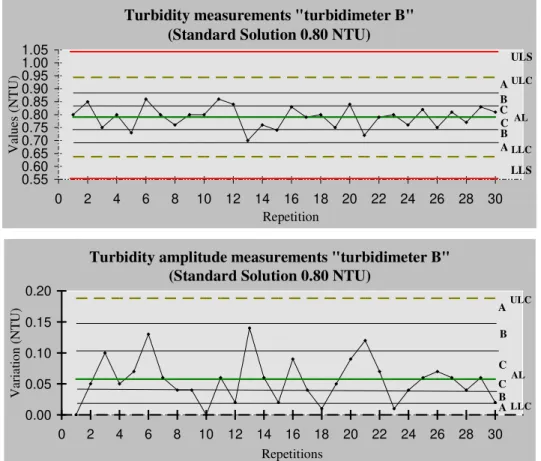
Also the graphs constructed for the turbidity variable obtained from turbidimeter “B”, with repetition of thirty standard solution measurements of 0.80 NTU (Figure 4) were analyzed.
It can be observed that in the turbidity control measurement graph that the average of the 0.79 NTU repetitions is very close to the nominal value of the standard solution, which the measurement process makes reliable (Figure 4).
There is no evidence of “special causes” non-random patterns in the control graphs, making the measurement process stable (Figure 4).
From the nominal value of the standard solution of 0.80 NTU, the project specification was established, being an LLS of 0.55 NTU and ULS of 1.05 NTU, and the project specification tolerance of only 0.50 NTU for low turbidity values (reasonable for the measurement process).
For defined project specification, the Cp index about 1.63 can be considered good, despite the low project tolerance. The maximum variation between repetitions was 0.14 NTU with a small variation in relation to the project tolerance, which is 0.50 NTU (Figure 4).
The Cpk index of 1.57 is also considered good, closest to the highest potential of the measuring instrument under question.
There were also 30 measurements with standard solutions of nominal values of 8.0 and 80.0 NTU showing results identical to their nominal values, therefore statistical studies for such situation are not justified.
The research showed that the turbidimeter “B” should be used for all turbidity measurements in LAADEG, until the corrective and preventive actions, that were recommended to take effect for the use of the turbidimeter “A”, can be carried out.
Turbidity measurements "turbidimeter B" (Standard Solution 0.80 NTU)
0.55 0.60 0.65 0.70 0.75 0.80 0.85 0.90 0.95 1.00 1.05
0 2 4 6 8 10 12 14 16 18 20 22 24 26 28 30
Repetition
V
al
ue
s
(N
T
U
)
A B
A C
B C
ULC
LLC AL
ULS
LLS
Turbidity amplitude measurements "turbidimeter B" (Standard Solution 0.80 NTU)
0.00 0.05 0.10 0.15 0.20
0 2 4 6 8 10 12 14 16 18 20 22 24 26 28 30
Repetitions
Va
ri
at
io
n
(NT
U) A
B
A C
B C
ULC
LLC AL
CONCLUSIONS
The research showed that the employment of the Quality Management System (QMS) and Environmental Management System (EMS) are quite significant in order to improve measurements and allow better management processes in laboratories. The results of the Statistical Process Control (SPC), using the model proposed (CEPLAB), demonstred that turbidimeter “B” is much more realiable than turbidimeter “A”, and therefore only the former must be used for analysis. From the observation of graphs and statistical indexes, it was possible to identify the need for elaboration of a preventive maintenance program applied on the instruments and measuring equipment, and also effective monitoring, using statistical studies to supervise the equipment and the laboratory quality analysis. It is also necessary that LAADEG continues the improvements of the proposed program.
ACKNOWLEDGEMENTS
The authors acknowledge CAPES for sponsoring the master’s degree student, the National Council for Research and Development (CNPq) and also the Support Foundation for Research of Minas Gerais State (FAPEMIG), for granting PIBIC scholarships. We also thank the coordination of the Water Analysis Laboratory of the Engineering Department (LAADEG) for the support given to this work.
REFERENCES DEMING, W.E. Qualidade: A revolução da
Administração. Rio de Janeiro: Editora Marques Saraiva S.A., 1990. 365p.
MONTGOMERY, D. C. Introdução ao controle estatístico da qualidade. Rio de Janeiro: Livros Técnicos e
Científicos, 2004. 513 p.
OLIVEIRA, M. S.; MUNIZ, J. A. Controle estatístico e gestão da qualidade. Lavras: UFLA / FAEPE, 2000. 129 p.
PRAZERES, P. M. Dicionário de termos da qualidade. São Paulo: Atlas, 1996. 456p.
SOUZA, L. P. F.; OLIVEIRA, M. S.; CAMPOS, C. M. M.; Utilização de software de controle estatístico de processo (CEP) para laboratórios de controle da
poluição. Ciência e Agrotecnologia, Lavras, v.27, edição especial, p.1597-1606, dez. 2003.