Estimation of the hundred year return level of the significant wave height
for the French Guiana coast
Robert Osinski
1* , Alice Dalphinet
2, Lotfi Aouf
2, Philippe Palany
11 Météo France, Direction Interrégionale Antilles-Guyane - Fort-de-France - Martinique - France (Route du Général Brosset - Morne Desaix - BP 645 - 97262 Fort-de-France Cedex)
2 Météo France, Direction des Opérations pour la Prévision - Département prévision marine et océanographique - Toulouse - Haute-Garonne - France
(42, Av. G. Coriolis, 31057 Toulouse Cedex 1)
*Corresponding author: [email protected]
Submitted on: 2/April/2018
Approved on: 14/December/2018
The coast between the Amazon River mouth in Brazil and the Orinoco River mouth in Venezuela is one of the muddiest in the world. Large amounts of sediments from the Amazon River are transported along-shore by
the North Brazilian current (NBC) and influence the for -mation of mud banks and wave breaking along the coast (Gratiot et al., 2007). During November and March,
this coast is affected by strong wave events, the
so-called northerly swells, which can provoke inundations and damages. Van Ledden et al. (2008) show an example
of such an event affecting the Guyana coast. In this study,
the focus is on French Guiana. The aim of this study is
an estimation of return levels of different return periods of significant wave heights, here demonstrated for 100
years. Such an estimation is for example important for the structural design of coastal protection installations. The impact of ocean/coastal currents on the wave height is demonstrated in a case study. An event sample as large as possible is created as input for the extreme value theory (Coles, 2001), because of the low probability of occurrence of the high impact events.
Météo France as the national weather service is re-sponsible for the operational forecasts of the sea state
and the official warnings for the study region. For the
warning process, the knowledge about the return period of a predicted extreme event can be used as additional information to quantify its rarity. The operational model chain for wave forecasts is applied to produce high
reso-lution hindcasts of severe northerly swell events affect -ing the French Guiana coast. This includes a new region-al model for French Guiana. As it became operationregion-al recently, the period of archived forecasts is not long
enough for the statistics. Operational forecasts/analysis are also inhomogeneous due to the constant improve-ments of the involved models. Wave data (1° resolution) and wind data (~0.7°) from the ERA-Interim reanalysis (Dee et al., 2011) are available every six hours from 1979 onwards. This homogeneous dataset is used to identify event periods and to drive the model chain. A new re-analysis called ERA5 is in production and hourly wave/ wind data at 0.36°/0.28° between 2010 and 2016 were available at the time of this study. Both wave reanalysis are too coarse at the coast to represent the wave properties
sufficiently in shallow water for the purpose of this study.
2013 ERA-Interim and ERA5 data were tested for model
calibration and for sensitivity studies of the influence of
ocean currents on the wave height. Indeed, the impact of ocean/coastal currents and mud banks on the waves is not taken into account in the Météo-France operational model chain yet. This leads to uncertainties in forecasts
as well as in the hindcasts, which have to be quantified.
configuration runs on an irregular grid with maximum
resolution of about 200 m at the coast. The model is driven by lateral boundary conditions from the global model and the ERA-Interim winds. As the swell is the predomi-nant part of the wave energy in this region, a potential underestimation of the wind sea is assumed to impact only slightly the total wave height. In the operational
chain, an intermediate MFWAM configuration at 0.1° is
nested into the global model, but not used in this study. Indeed, a test with such a regional MFWAM showed only a negligible impact, probably because of the rela-tively low resolution of the driving wind data.
Reanalysis data are used in this study to be able to produce a homogeneous set of events over a 38 years period. The model chain is calibrated for the application with operational atmospheric forcing data. As the ERA-Interim and ERA5 reanalysis have a coarser resolution than the wind data used for the operational setup, the wind
distributions can differ in regard to the operational forc -ing. For this reason, several parameters have been adapted for calibration and the setup has been vali-dated against observations. Along track altimeter data
for 2013 from the Ifremer CERSAT data base (available from ftp://ftp.ifremer.fr/ifremer/cersat/products/swath/al-timeters/waves/data/) has been used for this purpose. This includes the instruments JASON1, JASON2, CRYOSAT
and SARAL. The measured CERSAT significant wave height data, which are subject to different corrections described by Queffeulou (2004), are applied in this study. Measurements along track that are falling into predefined
0.5°x0.5° grid cells are averaged and collocated to the nearest model grid point with a maximum time delay of 1h30. Data below 0.5 m and above 13 m are excluded.
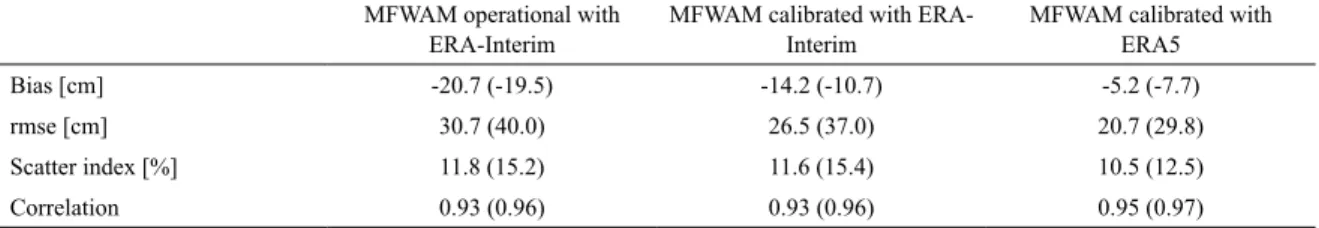
Gorman and Oliver (2018) proposed a methodol-ogy to determine an optimal set of such parameters and showed an example of WWIII driven by ERA-Interim. The parameters from this study were used as an orien-tation. As the special focus is on French Guiana, they were tuned specifically for this region. Compared to the operational setup, some parameters related to the wind impact and wave dissipation were changed. The configuration used for these source terms corresponds to the development of Ardhuin et al. (2010). The pa-rameter of dissipation SDSC2 has been adjusted from -2.8 10-5 to -2.0 10-5. The sheltering coefficient for short waves TAUWSHELTER used in the wind impact source term has been reduced from 0.6 to 0.4. The tail factor, which determines the shape of the energy spec-trum at high frequencies, has also been reduced from 9.9 to 4. Figures 1b and 1e show the improvement of the scores due to these modifications. Using ERA5 data, and the same calibration, the scores get further improved (Figures 1c and 1f). Table 1 provides addi-tional verification scores over a smaller region, we are calling “Antilles-Guyane”(75°00’W to 45°00’W and 5°00’S to 28°00’N), covering a broad area from the central and eastern Caribbean down to the Amazon riv-er mouth, and including the WWIII open boundaries. Using thousand bootstrap replications, the score differ-ences were tested for significance. In the operational configuration, the same parameter set is used for both WWIII and MFWAM. For this reason, the aforemen-tioned changes in parameter values were also applied to WWIII. Due to a lack of observational data (wave buoys) and a lack of resources to conduct long simula-tions with WWIII for comparison with altimeter data, whose quality near the coast is limited, WWIII has not been validated again.
Table 1. Verification scores of the significant wave height of 3 hourly data for 2013 for MFWAM 0.5° without currents
for the Antilles-Guyane region 75°00'W to 45°00'W and 5°00'S to 28°00'N (entire region of Fig. 1)against altimeter data.
MFWAM operational with ERA-Interim
MFWAM calibrated with ERA-Interim
MFWAM calibrated with ERA5
Bias [cm] -20.7 (-19.5) -14.2 (-10.7) -5.2 (-7.7)
rmse [cm] 30.7 (40.0) 26.5 (37.0) 20.7 (29.8)
Scatter index [%] 11.8 (15.2) 11.6 (15.4) 10.5 (12.5)
Correlation 0.93 (0.96) 0.93 (0.96) 0.95 (0.97)
A selection of events for the application for the ex-treme value statistics is based on the 38 years of ERA-Interim wave data. The mean residual lifeplot (MRL) has been used for estimating a threshold value for the Peaks-over-threshold theory (POT) (Coles, 2001). It was applied on the entire set of 6-hourly data of the wave reanalysis ignoring dependencies in a first step (Fawcett and Walshaw, 2007). This was done for the closest ERA-Interim ECWAM grid point in front of Cayenne (location of Cayenne shown in Figure 5), as this is one of thefocus regions. Several thresholds were also tested to fit a General Pareto Distribution (GPD) to identify at which threshold the fit parameters become more or less constant. To be able to make an estimation over all grid points, the percentile of the estimated threshold was determined. The same per-centile was tested aleatory for several grid points over the entireWWIII domain. This threshold, which is the 99th percentile of all ERA-Interim 6-hourlysignificant
subjective, different sets of parameters (threshold and runparameter) were tested; only a weak sensitivity was found in the estimated return level of the significant wave height based on ERA-Interim wave data.
The identified clusters are used to produce an event
list for hindcast modelling with the described model chain. We assume that the same severe events would happen in aMFWAM simulation than in the ECWAM simulation of ERA-Interim (ECMWF, 2007) with the same wind. Both WAM models are indeed very similar,
with only differences on thedissipation and on the
as-similation. In consequence, the generation of the event list based on ERA-Interim wave reanalysis is a reasonable choice to avoid a complete reproduction of the 38 years with MFWAM. WWIII has not been driven directly by
ERA-Interim wave spectra because of the large difference
between the model resolutions (1° for ERA-Interim, 0.5° for MFWAM and 0.1° for WWIII at the open bound-ary). Non-linear effects like wave-wave interaction or
bottom-wave interaction are assumed to not affect wave
heights in such a waythat severe events would occur in the WWIII domain and not in the global model near the domain boundaries. Although the impact of currents on the wave height cannot be taken intoaccount at the
mo-ment in the entire hindcast sample, their possible influence
has beeninvestigated in a sensitivity study (see below). The procedure for creating an event list wasrepeated for all ERA-Interim grid points along the boundary of the WWIII domain. Onesingle list was then prepared on this basis, containing 249 events in the period from January 1979 until December 2016.
We compared the automatically prepared list with the positive hits of the officialweather warnings issued by Météo France between 2006 and 2016, and found a goodagreement (from 39 32 included). The difference can be explained by the fact that the tide is not taken into account in the preparation of the event list, but it is part of the warning criteria. As the events were chosen based on the coarse ERA-Interim grid cells close to the openboundary of WWIII, it was tested, if it is neces-sary to prolongate the event period to allow thewave at the open boundary propagate to the coast by adding additional 6 hours, but found no necessity for doing this. The application of running windows of different sizes over randomly chosen grid points in the ERA-Interim significant wave height data over the entire
pe-Aarnes et al. (2015) discussed a jump in 1991 in ERA-Interim wave data. Itcorresponds to the introduc-tion of altimeter data assimilaintroduc-tion, and is also visible in thereanalysis in the order of 7 cm in the mean near French Guiana. As this effect is small, andsince ERA-Interim wave data are only used for the preparation of an event list, it is assumednot to affect the results. For the extreme value statistics, a homogeneous time series isnecessary. To avoid to introduce inhomoge-neities into the hindcast sample, data assimilationfor MFWAM and WWIII is not applied in this study, as observations are not available overthe entire 38 years. Hindcasts were prepared for the 249 events using the model chain, initialised from calm conditions. The spin-up lies in the order of eight days for MFWAM andthree days for WWIII. For this reason, MFWAM was initialised eleven days before thebeginning of the events, and WWIII three days in advance.
To investigate the influence of ocean currents on the significant wave height, hourlyMercator PSY4QV3R1 model surface current data has been retrieved for 2013 in 1/12°resolution. The data were bilinearly interpo-lated onto a regular 0.5° grid and included into the MFWAM forcing. To assess potential improvements in the model performance, thesignificant wave heights have been verified against altimeter data.
dis-Figure 2. Bias (a-c) [cm] and scatter index (d-f) [%] of MFWAM (a, b ,d ,e) and ERA5 wave data (c, f) extracted from ECMWF Mars in 0.5°
verified against altimeter data for 2013. MFWAM was calibrated as in Fig. 1b,c,e,f, and driven by Mercator PSY4QV3R1 hourly surface currents
from 1/12° bilinear interpolated to 0.5° and by either ERA-Interim (a,d) or ERA5 (b,e) 10 m winds.
Table 2. Verification scores of the significant wave height of 3 hourly data for 2013 for MFWAM 0.5° with hourly surface
currents from Mercator PSY4QV3R1 for the Antilles-Guyane region 75°00'W to 45°00'W and 5°00'S to 28°00'N (entire region of Fig. 2) against altimeter data.
MFWAM calibrated with ERA-Interim and hourly Mercator
current
MFWAM calibrated with ERA5 wind and hourly
Mercator current
ECWAM from ERA5 extracted from Mars interpolated on a
0.5° grid
Bias [cm] -13.9 (-10.1) -4.7 (-6.8) -10.8 (-9.7)
rmse [cm] 25.9 (36.7) 19.6 (29.1) 22.3 (27.5)
Scatter index [%] 11.5 (15.4) 10.0 (12.3) 10.2 (11.2)
Correlation 0.94 (0.96) 0.95 (0.97) 0.95 (0.98)
and showed similar structures for a different region. Figure 4 demonstrates the mean, minimum and maxi-mum values of the differences over the entire year 2013. Unlike the mean and minima, the maxima are at the same positionsas for the single event on Figure 3. As they have more or less comparable sizes, this sug-geststhat the largest increases in the significant wave height are more or less at a constant position,whereas the NBC rings change their properties and position over time (Fratantoni and Glickson, 2002). Having only a few events during this short period, the maxima
are probablymostly influenced by the strongest event. That is why a general statement is not possible and would require considering longer periods of time.
Figure 3. Difference [m] in significant wave height between calibrated MFWAM runs driven by ERA5 10 m winds with and without Mercator
PSY4QV3R1 surface current forcing for 15/01/2013 09:00h in the tropical North Atlantic.
Table 3. Verification scores of the significant wave height of 3 hourly data for 2013 for MFWAM 0.5° with monthly averaged
surface currents from Mercator PSY4QV3R1 over 2013 for the Antilles-Guyane region 75°00'W to 45°00'W and 5°00'S to 28°00'N (entire region of Fig. 2) against altimeter data.
MFWAM calibrated with ERA5 wind and with monthly averaged Mercator current
Bias [cm] -5.0 (-7.3)
rmse [cm] 20.2 (29.4)
Scatter index [%] 10.2 (12.4)
Correlation 0.95 (0.97)
mean current, butmonthly averaging removes the daily variability in the Mercator model. Individual events do not seem to be well represented in the monthly aver-aged surface currents. Daily or sub-dailycurrent data are necessary, but they are not available for the entire 38 years used in this study.That is why this effect can-not be taken into account yet for the estimation of re-turn periods.
What is shown in Figures 3 and 4 is the result of the impact of the currents on the waveheight. Mud banks can lead to a strong reduction of the wave height in the or-der of up to 70per cent (Winterwerp et al., 2007). As these structures develop very fast compared to what is
currently observable, and data are difficult to collect, it
is not possible to take them intoaccount. At the current stage, we started with sensitivity experiments using the implementation after Dalrymple and Liu (1978). Finally, the combined impact of currents andmud banks has to be taken into account, which is a long-term perspective.
gra-Figure 4. Difference [m] in significant wave height as in Figure 3 for entire 2013, mean (a), minimum value (b)
and maximum value (c) at each individual grid point.
-1 at the coast between 53°15’W and 51°45’W. In the western and eastern part of the coast, two small patch-es with a shape parameter close to 0 don’t follow this general evolution. The profile-log-likelihood method (Coles, 2001) has been used to estimate confidence intervals at the 95% level. Theestimated 100-year re-turn levels, and associated lower and upper bounds of the 95%confidence intervals for the 32,030 nodes of
the unstructured grid were interpolated onto aregular 0.0025° grid using Akima (1978) for visualisation pur-poses (Figure 5).
the number of events) method was applied (Efron and Tibshirani, 1986) and the result is shownon Figure 6a. Near the coast, which is the region of main interest for Météo-France, the bias is in the order of a few centi-metres only. In regions with a medium water depth, the mainly negative bias can reach values of up to about minus 15 centimetres, whereas in deep water the bias is in the order of a few centimetres. These values have to be added with opposite sign tothe estimation of the return level.
Future work may consider driving MFWAM 0.5° with ERA5 wind data and nesting WWIII into this model as the results are tunable for the Antilles-Guyane region, unlike the ERA5 ECWAM wave data (ECMWF, 2016). For the entire region shown on Figure 1, the ECWAM wave data have better scores except for the bias than the calibrated MFWAM setup with currents. One may use the ERA5 wave spectra at the lateral boundaries of 0.1° MFWAM from the operational chain, which cov-ers a smaller domain, and drive the model with ERA5 wind data to benefit from higher spatial resolution of the model and the driving wind data. This would allow to include the effect of sea surface currents into MFWAM from which the wave spectra are used to drive WWIII. For coastal flooding, the combination of wave height and water level is relevant. Besides ocean/coastal cur-rents and mud banks, the tide should also be taken into account in the wave model as well as in the statistics. Both, the significant wave height and the wave period should go in a next step into the estimation of the po-tential hazardousness of northerly swells for the French Guiana coast by applying a bivariate variant of the ex-treme value theory.
ACKNOWLEDGEMENTS
This study was financed by the Direction de l’Environnement, de l’Aménagement et du Logement (DEAL) of French Guiana. The setup of the WWIII model for French Guiana wascreated in cooperation be-tween the SHOM and Météo France in the framework of the Homonim project with support from the DGPR and the DGSCGC. This study has been conducted us-ing the CERSAT data base of Ifremer for the altimeter’s measurements and E.U. Copernicus Marine Service Information and contains modified Copernicus Climate
from the CNRS for discussions concerning mud banks, Anne-Lise Beaulant and MarieMinvielle for a prepara-tory literature study, and Ali Bel Madani and Nicolas Morie forcomments on the manuscript.
REFERENCES
AARNES, O. J., ABDALLA, S., BIDLOT, J. R. & BREIVIK, Ø.
2015. Marine Wind and Wave Height Trends at Different
ERA-Interim Forecast Ranges. Journal of Climate, 28, 819-837. AKIMA, H. 1978. A method of bivariate interpolation and
smooth surface fitting for irregularly distributed data points.
ACM Transactions Mathematical Software, 4, 148-159. ARDHUIN, F., GILLE, S. T., MENEMENLIS, D., ROCHA, C.
B., RASCLE, N., CHAPRON, B., GULA, J. & MOLEMAK-ER, J. 2017. Small-scale open ocean currents have large ef-fects on wind wave heights. Journal of Geophysical Research Oceans, 122, 4500-4517.
ARDHUIN, F., ROGERS, E., BABANIN, A. V., FILIPOT, J. F., MAGNE, R., ROLAND, A., VAN DER WESTHUYSEN, A., QUEFFEULOU, P., LEFEVRE, J. M., AOUF, L. & COL-LARD, F. 2010. Semiempirical Dissipation Source Functions
for Ocean Waves. Part I: Definition, Calibration, and Valida -tion. Journal of Physical Oceanography, 40, 1917-1941. BAKLOUTI, M., DEVENON, J. L., BOURRET, A.,
FROIDE-FOND, J. M., TERNON, J. F. &
FUDA, J. L. 2007. New insights in the French Guiana continental shelf circulation and its relation to the North Brazil Current
ret-roflection. Journal of Geophysical Research Oceans, 112, C2.
COLES, S. 2001. An Introduction to Statistical Modelling of Ex-treme Values, London, Springer-Verlag London.
DALRYMPLE, R. A. & LIU, P. L. F. 1978. Waves over Soft Muds: A Two-Layer Fluid Model.
Journal of Physical Oceanography, 8, 1121-1131.
DEE, D. P., UPPALA, S. M., SIMMONS, A. J., BERRISFORD, P., POLI, P., KOBAYASHI, S., ANDRAE, U., BALMASEDA, M. A., BALSAMO, G., BAUER, P., BECHTOLD, P., BELJAARS, A. C. M., VAN DE BERG, L., BIDLOT, J., BORMANN, N., DELSOL, C., DRAGANI, R., FUENTES, M., GEER, A. J., HAIMBERGER, L., HEALY, S. B., HERSBACH, H., HÓLM, E. V., ISAKSEN, L., KÅLLBERG, P., KÖHLER, M., MATRI-CARDI, M., MCNALLY, A. P., MONGE-SANZ, B. M., MOR-CRETTE, J. J., PARK, B. K., PEUBEY, C., DE ROSNAY, P., TAVOLATO, C., THÉPAUT, J. N. & VITART, F. 2011. The
ERA-Interim reanalysis: configuration and performance of the
data assimilation system. Quarterly Journal of the Royal Meteo-rological Society, 137, 553-597.
ECMWF (European Centre for Medium-Range Weather Fore-casts). 2007. Part VII: ECMWF Wave Model IFS Documen-tation CY31R1 [cited 2018 Feb 16]. Available from: https:// www.ecmwf.int/en/elibrary/9224-part-vii-ecmwf-wave-model
ECMWF (European Centre for Medium-Range Weather Fore-casts). 2013. Part VII: ECMWF Wave Model IFS Documen-tation CY38R1 [cited 2018 Feb 16]. Available from: https://
www.ecmwf.int/sites/default/files/elibrary/2013/9248-part-vii-ecmwf-wave-model.pdf
ECMWF (European Centre for Medium-Range Weather Fore-casts). 2016. Part VII: ECMWF Wave Model IFS Documen-tation CY41R2 [cited 2018 Feb 16]. Available from: https:// www.ecmwf.int/en/elibrary/16651-part-vii-ecmwf-wave-model
EFRON, B. & TIBSHIRANI, R. 1986. Bootstrap Methods for
Standard Errors, Confidence Intervals, and Other Measures
of Statistical Accuracy. Statistical Science, 1, 54-75. FAWCETT, L. & WALSHAW, D. 2007. Improved estimation for
temporally clustered extremes. Environmetrics, 18, 173-188. FRATANTONI, D. M. & GLICKSON, D. A. 2002. North Brazil
Current Ring Generation and Evolution Observed with Sea-WiFS. Journal of Physical Oceanography, 32, 1058-1074. GORMAN, R. M. & OLIVER, H. J. 2018. Automated model
op-timisation using the Cylc workflow engine (Cyclops v1.0). Geoscientific Model Development, 11, 2153-2173.
GRATIOT, N., GARDEL, A. & ANTHONY, E. J. 2007. Trade-wind waves and mud dynamics on the French Guiana coast,
South America: Input from ERA-40 wave data and field in -vestigations. Marine Geology, 236, 15-26.
HOSKING, J. R. M. & WALLIS, J. R. 1987. Parameter and Quantile Estimation for the Generalized Pareto Distribution. Technometrics, 29, 339-349.
MICHAUD H.; MORIO O.; GENSAC E.; OSINSKI R.; DAL-PHINET A.; CASITAS, S. &
PASQUET, A. 2018. Mud and sand effects on wave propaga -tion over the French Guiana coasts, Proceedings of XVeme Journées Nationales Génie Côtier-Génie Civil, La Rochelle, France, 2018 May 29-31.
QUEFFEULOU, P. 2004. Long-Term Validation of Wave Height Measurements from Altimeters. Marine Geodesy, 27, 495-510.
TOLMAN, H. L. 1991. A Third-Generation Model for Wind Waves on Slowly Varying, Unsteady, and Inhomogeneous Depths and Currents. Journal of Physical Oceanography, 21, 782-797.
THE WAMDI GROUP. 1988. The WAM Model – A Third Gen-eration Ocean Wave Prediction Model. Journal of Physical Oceanography, 18, 1775-1810.
TOLMAN, H. L. & the WAVEWATCH III® Development Group 2014. User manual and system documentation of WAVE-WATCH III® version 4.18 [cited 2018 Feb 16]. Available from: http://polar.ncep.noaa.gov/waves/wavewatch/manual. v4.18.pdf
VAN LEDDEN, M., VAUGHN, G., LANSEN, J., WIERSMA, F. & AMSTERDAM, M. 2009.
Extreme wave event along the Guyana coastline in October 2005. Continental Shelf Research, 29, 1, 352-361.
WINTERWERP, J. C., DE GRAAFF, R. F., GROENEWEG, J. & LUIJENDIJK, A. P. 2007. Modelling of wave damping at Guyana mud coast. Coastal Engineering, 54, 249-261.
ZAMBRESKY, L. 1989. A verification study of the global WAM
model December 1987 – November 1988. Technical Report No. 63 [cited 2018 Feb 16]. Available from:
https://www.ec-
![Figure 2. Bias (a-c) [cm] and scatter index (d-f) [%] of MFWAM (a, b ,d ,e) and ERA5 wave data (c, f) extracted from ECMWF Mars in 0.5°](https://thumb-eu.123doks.com/thumbv2/123dok_br/16514934.735169/5.829.86.737.87.524/figure-bias-scatter-index-mfwam-extracted-ecmwf-mars.webp)
![Figure 3. Difference [m] in significant wave height between calibrated MFWAM runs driven by ERA5 10 m winds with and without Mercator PSY4QV3R1 surface current forcing for 15/01/2013 09:00h in the tropical North Atlantic.](https://thumb-eu.123doks.com/thumbv2/123dok_br/16514934.735169/6.829.86.745.83.374/figure-difference-significant-calibrated-mercator-surface-tropical-atlantic.webp)
![Figure 4. Difference [m] in significant wave height as in Figure 3 for entire 2013, mean (a), minimum value (b) and maximum value (c) at each individual grid point.](https://thumb-eu.123doks.com/thumbv2/123dok_br/16514934.735169/7.829.165.682.90.797/figure-difference-significant-height-figure-minimum-maximum-individual.webp)
