AB B C D EEF D
E
B
B
B A
D
A
E
E
E A DE D
B DE
B
EB B B E F E EDFEE
AB B
EF B F
F
E
F EB
B
FE
B
BB
E
F EBB F
AB B
E
F
E
!B
EF B F
"
# EF
B
BB B
F EBB F
AB B
E
F
E
C$ D EE
F F EBB F F E# E E # E E F E %EB B
C$ EF # C$ EF F EBB F & ' B F B & E F # FE
( EF # C$ EF F EBB F )F# E# *E EB F E +E F
) EF E EFB F EBB F % # # A,E
F EBB F F - E# &ED
F EBB F " # EF B
F EBB F F E F EB B FE B
Nitrogen Containing Molecules of
Biological and Industrial Interest
Rui Montenegro Val-do-Rio Pinto
Faculdade de Ciˆencias e Tecnologia and Universidade Nova de Lisboa have the perpetual right and with no geographic limitation, to archive and publish this dissertation using printed or digital copies, or by other known, or yet to be invented, method, and to divulge it through scientific repositories, and to admit its copy and distribution to educational or research proposes, not commercial, if the merit is attributed and recognized to the author and editor.
The work presented herein would not be possible without the scientific supervision and patient guidance of Prof. Maria Lourdes Costa and Prof. Ant´onio Dias, to whom a word of sincere acknowledgement is given. My potential offspring as a scientific researcher is mainly due to them. The friendship and confidence demonstrated towards me throughout this years are on the basis of my own trust and achievements, and our successful operation as a team. Thank you both!
To Prof. Jos´e Paulo dos Santos a very respectful thank you, for the first insights into quantum physics during my undergraduate years, to the support and help provided during the course of this thesis. The computational resources made available for the group were indispensable for completing this work.
Prof. John Dyke and Dr. Grant Copeland are also acknowledged for the indispens-able support in the work performed in collaboration with the historical PES group, in the School of Chemistry of the University of Southampton. Their contribution was priceless and deeply appreciated. The University of Southampton is of course also acknowledged for the hosting conditions and research facilities.
A special thanks to Dr. Marcello Coreno, Dr. Monica de Simone and Dr. Barbara Michela Giuliano, without whom the work performed at Elettra (in Trieste, Italy) would not be possible. Thank you for sharing the opportunity of making science in a totally different environment, in a large-scale open-lab, boiling from intense scientific activity. Thanks to the technical staff at Elettra, for providing good light conditions.
A very special thanks to Prof. Maria Teresa Barros, Prof. Christopher Maycock and Dr. Paula Rodrigues, from Requimte-ITQB, FCT-UNL, for synthesizing the azido compounds, with renowned efficiency and improved ability.
The work on the azides also benefited from the expertise and analysis of Prof. Maria Teresa Fernandez, Prof. Maria Filomena Duarte and Dr. Filipa Martins, from CQB, FC-UL. To Prof. Teresa Fernandez a special thanks for enlightening me with some important concepts behind mass spectrometry and radical formation.
The majority of the work was performed at the Photoionisation Laboratory in the Department of Physics of FCT-UNL, therefore a great deal of respect and acknowl-edgement is due to this institution and all academic staff lecturing there, with special emphasis to the head of the department, Prof. Adelaide de Jesus.
A special thanks to the people who indirectly contributed in various forms to this thesis, by occasionally clarifying my many questions: Prof. Augusto Moutinho, Prof. Orlando Teodoro, Prof. Ant´onio Paiva, Dr. Andr´e Wemans, Dr. Cl´audia Quaresma, Juscelino Ferreira and Jo˜ao Faustino.
Antunes – who struggle(d) to make a living out of making science, I express a very joyful thanks. You represent the second-order perturbation effect in a charge-transfer process, arising from the vibronic coupling of aππ∗transition, mediated by the “bofi˜ao” elementary particle in a ubiquitously spread Pb compound, deposited on a PCL matrix, a problem only treatable with the modified BEB approach in a two-photon transition framework; without you, things would not be as interesting or as funny as they were. Sincere thanks!
To all my friends and family. To both my grandparents with whom I had the luck to grow and absorb history and inspiration. A warm embrace to my mother, for showing me how to put one’s heart in place of one’s head, at all the right times. A big hug to my father who, by example, taught me how to be curious and rationale in approaching and resolving life’s problems, and for his immense support. A special thanks to the shark princess for all the love and moments shared.
The work presented herein is based on the gas-phase spectroscopic characterization of several molecules of high nitrogen content which are relevant to organic synthesis, industry and fundamental research on molecular physics. It is mainly an experimental enterprise on selected organic azides and tetrazoles, with heavy support on theoretical results from readily available computational methods. Part of the work relies on the design and construction of scientific apparatus, which substantially improve the existing equipment and extend the limits of the experiment.
The electronic structure and gas-phase thermal decomposition of methyl 2-azidopro-pionate (M2AP, N3CH3CHCO2CH3), benzyl azide (BA, C6H5CH2N3), 2-, 3- and 4-methyl benzyl azide (2-, 3- and 4-MBA, CH3C6H4CH2N3), 5-aminotetrazole (5ATZ, NH2CN4H), and 5-methyltetrazole (5MTZ, CH3CN4H) are investigated through photo-electron spectroscopy, using either He(I) (21.22 eV) or synchrotron radiation in the X-ray range. Relevant information obtained from mass spectrometry and matrix-isolation infrared spectroscopy is used to complement characterization of the samples.
Regarding each molecules’ thermal decomposition, pathways are proposed which account for the observed end products. Conformational analysis is performed, and the special case of annular tautomerism is addressed in the tetrazole compounds. High-temperature pyrolysis work is performed in collaboration with the University of Southampton, and XPS analysis using synchrotron radiation is performed at Elettra, the multidisciplinary synchrotron light laboratory in Trieste, Italy.
Experimental findings are rationalized using different computational methods, based on post-Hartree-Fock approaches: many-body perturbation theory (MPn), configura-tion interacconfigura-tion (CI) and Green’s funcconfigura-tion methods (OVGF, P3), as well as density functional theory (DFT), are used extensively to obtain optimized molecular geome-tries, ionization energies, orbital contours, relative energies, vibrational frequencies, and to assess possible pathways for thermal or electron impact fragmentation. Com-posite methods (Gnand CBS) are used to estimate to kcal mol−1 accuracy the energy
balance between reactants, transition structures and products in the overall decompo-sition process of the specified molecules.
O trabalho apresentado no ˆambito desta tese incide sobre a caracteriza¸c˜ao espec-trosc´opica de diferentes mol´eculas com grande quantidade de azoto, relevantes na s´ıntese qu´ımica de compostos orgˆanicos, na ind´ustria e em investiga¸c˜ao fundamental na ´area da f´ısica molecular. Baseia-se, fundamentalmente, numa abordagem experimental `a car-acteriza¸c˜ao de algumas azidas orgˆanicas e tetraz´ois, com vasto recurso a m´etodos com-putacionais. Parte do trabalho consiste no dimensionamento e constru¸c˜ao de equipa-mento cient´ıfico que melhora substancialmente o equipaequipa-mento existente e amplia os limites da experiˆencia.
A estrutura electr´onica e a decomposi¸c˜ao t´ermica em fase gasosa do metil 2-azido-propionato (M2AP, N3CH3CHCO2CH3), benzil azida (BA, C6H5CH2N3), 2-, 3- e 4-metil benzil azida (2-, 3- and 4-MBA, CH3C6H4CH2N3), 5-aminotetrazol (5ATZ, NH2CN4H) e 5-metiltetrazol (5MTZ, CH3CN4H), s˜ao investigados atrav´es da espec-troscopia de fotoelectr˜oes, recorrendo a radia¸c˜ao He(I) (21.22 eV) ou de sincrotr˜ao na gama dos raios-X. As t´ecnicas de espectrometria de massa e de espectroscopia de infravermelhos em matriz-isolada s˜ao utilizadas como t´ecnicas complementares `a car-acteriza¸c˜ao dos compostos.
Relativamente `a decomposi¸c˜ao t´ermica de cada mol´ecula, s˜ao apresentados trajec-tos de decomposi¸c˜ao que explicam a forma¸c˜ao dos produtos detectados. ´E realizada a an´alise conformacional dos compostos, com especial enfˆase para o tautomerismo anular exibido pelos compostos tetraz´olicos. O processo de pir´olise a alta-temperatura ´e inves-tigado, em colabora¸c˜ao com a Universidade de Southampton. A an´alise das mol´eculas com XPS, utilizando radia¸c˜ao de sincrotr˜ao, ´e tamb´em levada a cabo no laborat´orio multidisciplinar Elettra, em Trieste, It´alia.
Os resultados experimentais s˜ao racionalizados usando diferentes m´etodos computa-cionais, baseados em aproxima¸c˜oes p´os-Hartree-Fock: teoria da perturba¸c˜ao a v´arios corpos (MPn), interac¸c˜ao de configura¸c˜ao (CI), m´etodos baseados na fun¸c˜ao de Green (OVGF, P3) e teoria do funcional de densidade (DFT) s˜ao utilizados recorrentemente com o intuito de obter geometrias moleculares optimizadas, energias de ioniza¸c˜ao, con-tornos das orbitais moleculares, energias relativas e frequˆencias vibracionais, e com o objectivo de averiguar poss´ıveis trajectos de fragmenta¸c˜ao t´ermica e de dissocia¸c˜ao por impacto electr´onico. O balan¸co de energia entre os reagentes, estruturas de transi¸c˜ao e produtos envolvidos no processo de decomposi¸c˜ao ´e estimado com uma precis˜ao de kcal mol−1 recorrendo a m´etodos computacionais compostos (Gnand CBS).
Palavras-chave: azidas; tetraz´ois; f´ısica molecular; estrutura electr´onica; UVPES;
Page
Acknowledgements iii
Abstract / Resumo v
Contents ix
List of Figures xv
List of Tables xxiii
List of Acronyms xxvii
Part I – Introduction and Methods 1
1 Introduction 3
1.1 Gas-phase study of nitrogen containing molecules . . . 3
1.1.1 Azides . . . 4
1.1.2 Tetrazoles . . . 5
1.1.3 Applications . . . 7
1.1.4 Safety measurements . . . 8
1.2 Objectives . . . 9
1.3 Thesis outline . . . 10
2 Experimental Methods 13 2.1 Ultraviolet photoelectron spectroscopy . . . 13
2.1.1 Principles . . . 13
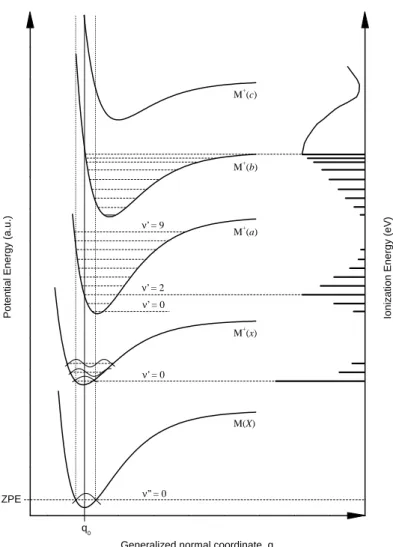
2.1.1.1 Direct photoionisation and autoionisation processes . 14 2.1.1.2 Franck–Condon principle and the origin of vibrational structure . . . 15
2.1.1.3 Overview of a general purpose UV photoelectron spec-trometer apparatus . . . 18
2.1.2 Experimental details . . . 20
2.1.2.1 Radiation source – A . . . 20
2.1.2.2 Sample introduction system – B . . . 24
2.1.2.3 Electron energy analyser – C . . . 25
2.1.2.4 Detector system – D . . . 27
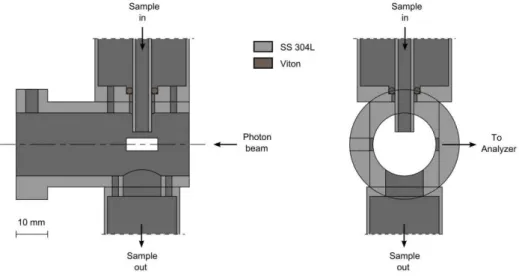
2.1.2.6 Interaction region and reaction cell . . . 29
2.1.2.7 Magnetic field compensation . . . 30
2.1.2.8 Electronics and acquisition system . . . 31
2.1.2.9 Resolution and calibration . . . 33
2.1.3 Gas-phase thermal decomposition studies . . . 35
2.1.3.1 Standard pyrolysis system . . . 35
2.1.3.2 Oven for organic molecules . . . 37
2.1.3.3 Furnace/oven power supply and temperature control . 38 2.1.3.4 Thermal distribution: numerical simulations . . . 40
2.1.3.5 High-temperature pyrolysis system . . . 42
2.2 X-ray photoelectron spectroscopy . . . 44
2.2.1 Principles . . . 44
2.2.1.1 Decay of core-holes: Auger effect and X-ray fluorescence 45 2.2.1.2 Chemical shifts . . . 45
2.2.2 Experimental details . . . 46
2.2.2.1 Synchrotron radiation source – A . . . 46
2.2.2.2 Oven for solid samples – B . . . 50
2.2.2.3 Energy analyser and lens system – C . . . 50
2.2.2.4 Detector system – D . . . 51
2.2.2.5 Vacuum system – E . . . 51
2.3 Complementary techniques . . . 52
2.3.1 Mass spectrometry . . . 52
2.3.2 Matrix-isolation IR spectroscopy . . . 53
3 Theoretical Framework and Methods 55 3.1 Electronic structure calculations in a nutshell . . . 55
3.1.1 The many-electron conundrum in Schr¨odinger’s equation . . . . 55
3.1.2 The Born-Oppenheimer approximation . . . 56
3.1.3 Molecular wave function requirements . . . 58
3.1.4 The Hartree-Fock method . . . 60
3.1.4.1 Restricted and unrestricted spin-orbitals . . . 63
3.1.4.2 Roothaan-Hall and Pople-Nesbet equations . . . 65
3.1.4.3 The self-consistent-field procedure . . . 67
3.1.5 Koopmans’ theorem: making ends meet . . . 68
3.1.6 Electron correlation and post-Hartree-Fock methods . . . 69
3.1.6.1 Configuration interaction method . . . 69
3.1.6.2 Møller-Plesset perturbation theory . . . 72
3.1.6.3 Electron propagator theory: OVGF and P3 methods . 73 3.1.6.4 Density functional theory . . . 77
3.1.7 Basis sets . . . 79
3.1.7.1 Pople basis sets . . . 80
3.1.7.2 Dunning’s correlation consistent basis sets . . . 80
3.1.7.3 Ahlrichs basis sets . . . 81
3.1.8 Computational resources . . . 81
3.2 Application techniques . . . 81
3.2.1 Outer-valence photoelectron spectra . . . 82
3.2.2 Core photoelectron spectra . . . 82
3.2.3 Thermal decomposition reactions . . . 83
Part II – Case Studies 87
4 Methyl 2-Azidopropionate: UVPES and Matrix-Isolation IR 89
4.1 Introduction . . . 89
4.2 Experimental and computational methods . . . 91
4.2.1 Sample preparation and characterization . . . 91
4.2.2 UV photoelectron spectroscopy . . . 92
4.2.3 Matrix isolation IR spectroscopy . . . 93
4.2.4 Computational methods . . . 93
4.3 Results and discussion . . . 94
4.3.1 Electronic structure and vibrational analysis of M2AP . . . 94
4.3.2 Thermal decomposition of M2AP - UVPES studies . . . 98
4.3.3 Thermal decomposition of M2AP - Matrix isolation IR studies 99 4.3.4 Mechanism of gas-phase thermal decomposition of M2AP . . . 102
4.3.4.1 Imine formation through a 1,2-H shift synchronous with N2 elimination (a Type 1 mechanism) . . . 102
4.3.4.2 Heterocyclic formation synchronous with N2 elimina-tion (a Type 2 mechanism) . . . 103
4.4 Conclusion . . . 106
5 BA and 2-, 3-, 4-MBA: Computational Study on VIEs 109 5.1 Introduction . . . 109
5.2 Computational details . . . 110
5.3 Results and discussion . . . 111
5.3.1 Molecular structures . . . 111
5.3.2 Molecular orbitals and ionization energies . . . 112
5.3.2.1 HF method . . . 114
5.3.2.2 MP2 method . . . 116
5.4 Conclusions . . . 119
6 BA and 2-, 3-, 4-MBA: UVPES and Mass Spectrometry 121 6.1 Introduction . . . 121
6.2 Experimental and theoretical methods . . . 122
6.2.1 General procedure for sample preparation and characterization 122 6.2.2 Mass spectrometry . . . 123
6.2.3 Photoelectron spectroscopy . . . 123
6.2.4 Computational details . . . 123
6.3 Results and discussion . . . 124
6.3.1 Mass spectrometry . . . 124
6.3.1.1 Benzyl azide . . . 124
6.3.1.2 Methylbenzyl azides . . . 127
6.3.2 Photoelectron spectroscopy . . . 132
6.3.2.1 Benzyl and methylbenzyl azides . . . 134
6.4 Conclusions . . . 136
7 BA and 2-, 3-, 4-MBA: Gas-Phase Thermal Decomposition 137 7.1 Introduction . . . 137
7.2 Experimental details . . . 138
7.3.1 Benzyl azide . . . 139
7.3.2 2-methyl benzyl azide . . . 145
7.3.3 3-methyl benzyl azide . . . 151
7.3.4 4-methyl benzyl azide . . . 156
7.4 Conclusions . . . 161
8 Electronic Structure and Thermal Decomposition of 5ATZ 165 8.1 Introduction . . . 165
8.2 Experimental method . . . 167
8.3 Computational details . . . 168
8.4 Results and discussion . . . 169
8.4.1 Structures and molecular orbitals of 5ATZ . . . 169
8.4.2 Total energies and thermochemistry . . . 171
8.4.3 Photoelectron spectrum of 5ATZ . . . 172
8.4.4 Thermal Decomposition of 5ATZ . . . 175
8.5 Conclusions . . . 184
9 Electronic Structure and Thermal Decomposition of 5MTZ 185 9.1 Introduction . . . 185
9.2 Experimental method . . . 186
9.3 Computational details . . . 187
9.4 Results and discussion . . . 188
9.4.1 Structures and molecular orbitals of 5MTZ . . . 188
9.4.2 Total energies and thermochemistry . . . 190
9.4.3 Photoelectron spectrum of 5MTZ . . . 191
9.4.4 Thermal decomposition of 5MTZ: UVPES results . . . 195
9.4.5 Thermal decomposition of 5MTZ: calculations results . . . 195
9.4.5.1 Decomposition of the 1H-tautomer . . . 198
9.4.5.2 Decomposition of the 2H-tautomer . . . 198
9.4.5.3 Formation of HCN . . . 199
9.5 Conclusions . . . 199
10 Tautomerism in 5MTZ Studied by XPS and∆SCF Calculations 203 10.1 Introduction . . . 203
10.2 Experimental details . . . 204
10.3 Computational methods . . . 204
10.4 Results and discussion . . . 205
10.4.1 Thermochemistry of 5MTZ . . . 205
10.4.2 Valence photoelectron spectrum . . . 206
10.4.3 C 1s photoelectron spectrum . . . 207
10.4.4 N 1s photoelectron spectrum . . . 209
10.5 Conclusions . . . 212
11 Tautomerism in 5ATZ Studied by XPS and∆SCF Calculations 213 11.1 Introduction . . . 213
11.2 Experimental details . . . 214
11.3 Computational methods . . . 214
11.4 Results and discussion . . . 215
11.4.2 Valence photoelectron spectrum . . . 216
11.4.3 C 1s photoelectron spectrum . . . 217
11.4.4 N 1s photoelectron spectrum . . . 217
11.5 Conclusions . . . 221
12 Conclusions and Future Work 223
Page
Figure 1.1 Structure of N2(a), generic azide R-N3(b), and tetrazole R-CN4-R’ (c). 3
Figure 1.2 General “type 1” (a) and “type 2” (b) thermal decomposition
mecha-nisms of organic azides. . . 5
Figure 1.3 Annular tautomerism between 1H- and 2H- tautomers of generic
5-substituted tetrazoles (a⇋b). Tetrazole-azide ring-chain isomerism (b⇋c). . 6
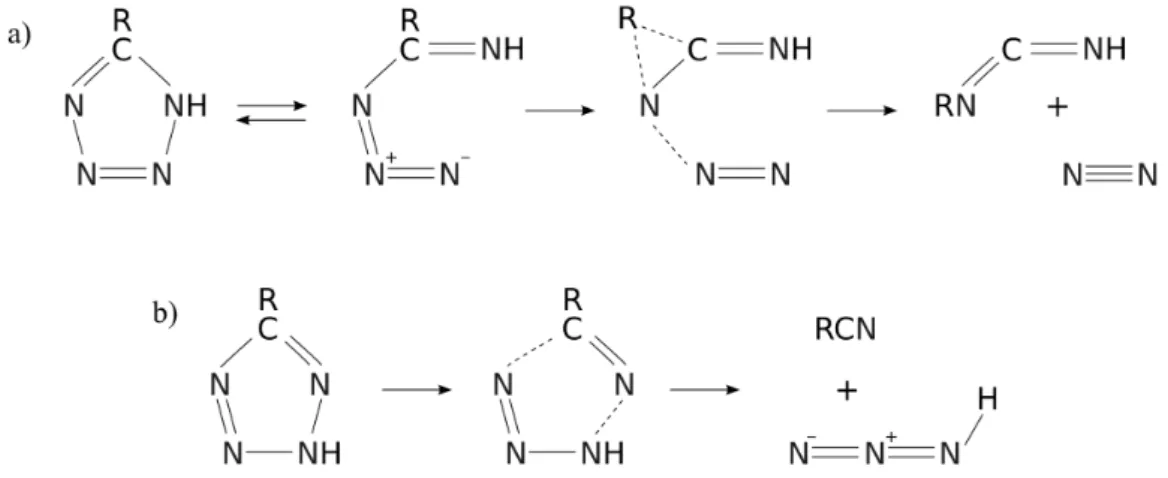
Figure 1.4 General thermal decomposition pathways for 1H-5-substituted tetrazoles
leading to N2 (a), and 2H-5-substituted tetrazoles leading to HN3 (b).. . . . 7
Figure 1.5 Azides and tetrazoles under study: methyl 2-azidopropionate (M2AP)
(a), benzylazide and 2-, 3- and 4-methyl-benzylazide (BA and 2-,3-,4-MBA) (b), 5-methyltetrazole (1H-5MTZ and 2H-5MTZ tautomers) (c), and 5-aminotetrazole
(1H-5ATZ and 2H-5ATZ tautomers) (d). . . 10
Figure 2.1 Potential energy curves for the molecule M in its ground-state and the
corresponding cation M+ in several ionic states. . . . . 16
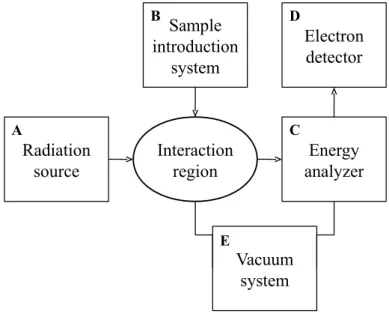
Figure 2.2 Diagram of the main components of a general purpose photoelectron
spectrometer. . . 19
Figure 2.3 Illustration of the main components of the UV photoelectron
spectrom-eter located in Lisbon. A - radiation source, B - sample introduction system, B1 pyrolysis system, B2 over for organic samples, C energy analyser, D
-electron detector, E - vacuum system, F - reaction cell. . . 20
Figure 2.4 Schematic diagram of the water-cooled discharge lamp, for producing
resonance radiation of rare gases. The gas pumping port and the water-cooled
serpentine tip were omitted for the sake of clarity. . . 21
Figure 2.5 Thermal Doppler broadening as a function of temperature, for the
prin-cipal resonance lines of the helium, neon and hydrogen rare gases. . . 23
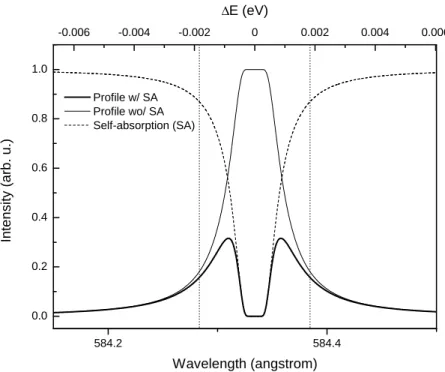
Figure 2.6 Example intensity profile of the ionizing radiation, with and without the
effect of self-absorption. . . 23
Figure 2.7 Conductance of the inlet tube of the sample introduction system, as a
function of temperature, evaluated for samples with M = 84 (5-methyltetrazole) and 133 (benzyl azide). The Clausing transmission probability is 0.0258,
esti-mated forL/r≈100 . . . 24
Figure 2.8 Schematic diagram of the 150◦ electrostatic analyser, and exit and
en-trance slits. A close-up view of the interaction region and analyser enen-trance is
shown at the left-hand side. αis the angle done by the initial trajectory with
the normal to the entrance plane. Definitions regardingR1, R2, R0, O and F
Figure 2.9 Energy dispersion of the analyser ∆EA (FWHM, in eV), as a function
of the pass energy E0. Results forα= 0 (thin), 0.6 (thick) and 1.2◦ (dashed)
are presented. . . 27
Figure 2.10 Schematics of the vacuum system used with the photoelectron spectrom-eter: R1, R2, R3 – rotary pumps; D1, D2 – diffusion pumps; V1,..., V9 – valves;
P1, P2, P3 – Pirani gauges; I1, I2 – ion gauges; T1, T2 – absorption traps. . 28
Figure 2.11 Schematic diagram of the reaction cell (front and side view), showing the (perpendicular) axis for the propagation of the photon, molecular and
pho-toelectron beams.. . . 29
Figure 2.12 Thermal broadening as a function of photoelectron kinetic energy, due
to the motion of target molecules. Curves obtained forT = 300 K, and M=84
(5-methyltetrazole) and 133 (benzylazide). . . 30
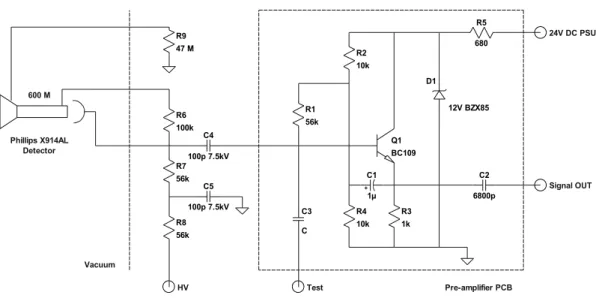
Figure 2.13 Detector high-voltage decoupler and preamplifier circuit used to convert
and filter the incoming pulses from the electron detector. . . 32
Figure 2.14 Representative electronic circuit of the acquisition system. . . 32
Figure 2.15 Screenshot of thePhotoelectron Spectrometer Acquisition System(PSAS). 32
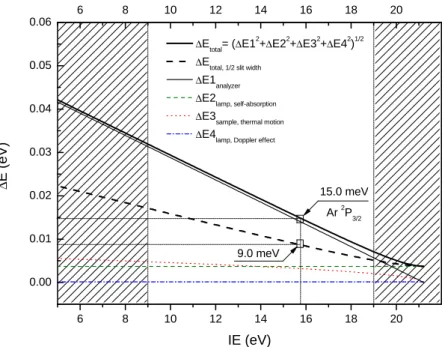
Figure 2.16 Total and partial contributions for the experimental broadening (FWHM) in a photoelectron spectrum, acquired with our spectrometer in a set of well-defined experimental conditions (see text for details). For reference purposes,
the predicted experimental broadening for the Ar 2P
3/2 (3p)−1 ionization line
is presented. . . 33
Figure 2.17 Schematic diagram of the pyrolysis furnace coupled to the reaction cell (front and side view). Some details regarding the top support were omitted for
clarity. . . 36
Figure 2.18 Mean residence time (m.r.t.) in the pyrolysis zone, as a function of
temperature, for M=84 (5-methyltetrazole) and 133 (benzylazide). . . 37
Figure 2.19 Schematic diagram of the evaporation oven coupled to the reaction cell (front and side view). Some details regarding the bottom support were omitted
for clarity. . . 38
Figure 2.20 Representative electronic circuit of the heating system power supply and
temperature control. . . 40
Figure 2.21 Screenshot of the PyroControl interface, written in LabView, running
in Windows environment. . . 40
Figure 2.22 Triangular mesh created with the Gmsh program (a) and simulated
thermal distribution of the pyrolysis system at 1000 K heating temperature (b). 41
Figure 2.23 Triangular mesh created with the Gmsh program (a) and oven’s simu-lated thermal distribution at 773 K heating temperature, with copper (b) and
stainless steel (c) tips. . . 41
Figure 2.24 Schematic diagram of the inductively heated pyrolysis system, used in
Southampton’s photoelectron spectrometer. . . 42
Figure 2.25 Illustration of the main components of the XPS spectrometer, located in the Gas Phase beamline, Elettra. A - synchrotron light, B - sample introduction system, C energy analyser and lens system, D electron detector, and E
-vacuum system. . . 47
Figure 2.26 The overall structure of a synchrotron facility. BM - bending magnets;
LINAC - linear accelerator; BL - beamline; ES - experimental station. . . 48
Figure 2.27 Light intensity over time, radiating from an electron passing through three different insertion devices: a bending magnet (a), an undulator (b) and
a wiggler (c). . . 49
Figure 2.28 Schematic illustration of the optical devices installed in the Gas-Phase
Figure 2.29 Schematic diagram of the matrix-isolation apparatus for analysis of gas-phase samples with IR spectroscopy, maintained by the PES group of the
Uni-versity of Southampton. . . 54
Figure 3.1 General coordinate system for a molecule with N-electrons and M-nuclei. 56
Figure 4.1 Example of Type 1 mechanism . . . 90
Figure 4.2 Example of Type 2 mechanism . . . 90
Figure 4.3 The four lowest energy conformations of M2AP: GG’ (gauche-gauche),
GA (gauche-anticlinal), G’A’ and G’S (gauche-synperiplanar). . . 91
Figure 4.4 Schematics of the experimental setup, with an expanded view of the
resistively heated furnace: A UV source, B reaction cell, C furnace, D entrance slits, E energy analyser, F exit slits, G electron detector and H
-liquid sample. . . 92
Figure 4.5 Molecular orbitals contours (isovalue = 0.05) of the GG’ conformer of
M2AP, from MP2/6-311++G(d,p) results. . . 94
Figure 4.6 He(I) photoelectron spectrum of M2AP, recorded at room temperature
(a), and simulated outer-valence photoelectron spectrum, based on
OVGF/6-311++G(d,p) results (b).. . . 96
Figure 4.7 N2 matrix IR spectrum (3500-500 cm−1 spectral range) of M2AP (a),
and simulated IR spectrum, based on scaled B3LYP/6-311++G(d,p) results (b). . . 98
Figure 4.8 N2 matrix IR spectrum (1500-900 cm−1 spectral range) of M2AP (a),
and simulated IR spectrum, based on scaled B3LYP/6-311++G(d,p) results (b). . . 99
Figure 4.9 He(I) photoelectron spectrum of the thermal decomposition of M2AP,
taken at 650 ◦C. The asterisk marks the characteristic ionization line of H
2O. 100
Figure 4.10 Detail of the He(I) photoelectron spectrum of the thermal
decomposi-tion of M2AP (gray), taken at 650◦C, with estimated contributions from the
decomposition species CH3CN (cross-hatched), CH3OH (hatched), MF (dark
gray), N2 (black), CO (light gray) and CO2 (white). The asterisk marks the
characteristic ionization line of H2O. . . 100
Figure 4.11 N2 matrix IR spectrum (3500-700 cm−1 spectral range) of M2AP after
partial pyrolysis at 250◦C (a), 320◦C (b), and after complete pyrolysis at 470
◦C (c). . . . . 101
Figure 4.12 Potential energy diagram (in kJ/mol) for the thermal decomposition of M2AP, calculated with the G3 method. Pathways derived from a Type 1 mechanism are shown at the left hand side and pathways derived from a Type 2 mechanism are shown at the right hand side of the diagram. The G3 energy barriers associated with the decomposition of MF (left side) were taken from
the work of Metcalfe. All other results are from these study. . . 103
Figure 4.13 Geometry of all the transition structures, calculated with the G3 method, involved in the thermal decomposition of M2AP, originated by either a Type 1
or a Type 2 mechanism. . . 104
Figure 5.1 Molecular structure of benzyl azide and 1–, 2–, 3– and 4–methyl benzyl
azide. 3–MBA has the same labelling/numbering as BA, except for the atoms that are explicitly labelled differently on the figure. 1–, 2– and 4–MBA share
the same labelling/numbering as the 3– isomer. . . 111
Figure 5.2 Selected molecular orbitals of benzyl azide and 1–, 2–, 3– and 4–methyl
Figure 5.3 Energy diagram of BA and its methyl derivatives, based on MP2/6-311++G(d,p) results. On the right, the states from benzene and methyl azide
that resemble the most to the MOs in study. . . 113
Figure 5.4 IE differences between the theoretical and experimental values, ∆E, for
the first 5 bands of BA, calculated with HF and several basis. . . 115
Figure 5.5 IE differences between the theoretical and experimental values, ∆E, for
the first 5 bands of 2–MBA, calculated with HF and several basis. . . 115
Figure 5.6 IE differences between the theoretical and experimental values, ∆E, for
the first 5 bands of 3–MBA, calculated with HF and several basis. . . 116
Figure 5.7 IE differences between the theoretical and experimental values, ∆E, for
the first 5 bands of 4–MBA, calculated with HF and several basis. . . 117
Figure 5.8 IE differences between the theoretical and experimental values, ∆E, for
the first 5 bands of BA, calculated with MP2 and several basis. . . 117
Figure 5.9 IE differences between the theoretical and experimental values, ∆E, for
the first 5 bands of 2–MBA, calculated with MP2 and several basis. . . 118
Figure 5.10 IE differences between the theoretical and experimental values, ∆E, for
the first 5 bands of 3–MBA, calculated with MP2 and several basis. . . 118
Figure 5.11 IE differences between the theoretical and experimental values, ∆E, for
the first 5 bands of 4–MBA, calculated with MP2 and several basis. . . 119
Figure 6.1 Optimized structures of 2-, 3- and 4-MBA and corresponding radical
cations, obtained with restricted and unrestricted HF/6-311++G(d,p),
respec-tively. Bond lengths are in angstroms (˚A). . . 127
Figure 6.2 Mass spectrum for deuterated benzyl azide and its linked scan at
con-stant B/E for the main peaks. . . 128
Figure 6.3 Main fragmentation pathways, for benzyl azide and deuterated benzyl
azide, based on metastable transitions and accurate mass measurements. . . 128
Figure 6.4 Main fragmentation pathways, for para-methylbenzyl azide, based on
metastable transitions and accurate mass measurements. . . 130
Figure 6.5 Possible mechanism for formation of ions atm/z104 inortho-methylbenzyl
azide. . . 130
Figure 6.6 IRC calculation results for the fragmentation pathway leading to the
formation ofpara-methylbenzylidene imine radical cation + N2from 4-MBA+•,
determined with UHF/6-31G(d). . . 131
Figure 6.7 IRC calculation results for the fragmentation pathway leading to the
formation ofpara-methylbenzyl cation + N3radical from 4-MBA+•, determined
with UHF/6-31G(d). . . 131
Figure 6.8 Optimized structures of TS1 and TS2, connecting 4-MBA+• and the
products from the first two fragmentation channels of Fig. 6.4, obtained with
UHF/6-311++G(d,p). Bond lengths and distances are in angstroms (˚A). . . 132
Figure 6.9 He(I) photoelectron spectrum of benzyl azide. The labeled bands are
listed in Table 6.7. . . 133
Figure 6.10 Selected molecular orbitals (HOMO-MO 30) from benzyl azide, based
on HF/6-311++G(d,p) results. . . 133
Figure 6.11 He(I) photoelectron spectra obtained for: (a)ortho-methylbenzyl azide;
(b) metha-methylbenzyl azide; and (c)para-methylbenzyl azide. The labeled
bands are listed in Table 6.8. . . 135
Figure 7.1 Molecular structures of BA, 2-, 3- and 4-MBA . . . 138
Figure 7.2 Benzyl azide He(I) photoelectron spectra recorded at increasing furnace
Figure 7.3 Proposed thermal decomposition pathways for benzyl azide, associated with the formation of the main intermediate products N–methyleneaniline (1), N–phenylmethanimine (2), benzonitrile (3), benzene (4) and the phenyl radical (5). . . 142
Figure 7.4 He(I) PE spectrum of BA, taken at 920◦C (left) and 1035◦C (right), and
superimposed spectra of benzenonitrile, N-methyleneaniline and N-phenylmethanimine (simulated spectra, based on P3/6-311++G(d,p)//B3LYP/6-31+G(d,p) results,
see text for details). At 1035 ◦C, the contribution of N-methyleneaniline has
been augmented. . . 143
Figure 7.5 He(I) PE spectrum of BA (left), taken at 1150 ◦C and superimposed
spectra of benzene, benzenonitrile, N-methyleneaniline and N-phenylmethanimine (simulated spectra, based on P3/6-311++G(d,p)//B3LYP/6-31+G(d,p) results, see text for details). At the right, a close-up view of the first band (VIEs in
eV). The addition of benzene is explained by the formation of HCN. . . 143
Figure 7.6 Simulated outer-valence PE spectrum of N-phenylmethanimine and
as-sociated stick bar graph, based on P3/6-311++G(d,p)//B3LYP/6-31+G(d,p)
results. . . 144
Figure 7.7 2-Methyl benzyl azide He(I) photoelectron spectra recorded at increasing
furnace temperature. . . 146
Figure 7.8 Proposed thermal decomposition pathways for 2-methyl benzyl azide,
associated with the formation of the main intermediate products toluene (6), benzene (7), o-tolunitrile (8), N-methylbenzaldimine (9), o-methyl benzylidene
imine (10), isoindoline (11a) and indoline (11b). . . 148
Figure 7.9 He(I) PE spectrum of 2-MBA, taken at 920◦C, and superimposed
spec-tra of toluene, o-tolunitrile and isoindoline (simulated specspec-tra, based on
P3/6-311++G(d,p)//B3LYP/6-31+G(d,p) results). . . 149
Figure 7.10 Close-up detail of the first band in Fig. 7.9 (VIEs in eV). The
contribu-tion of o-tolunitrile (light gray) has been augmented. . . 149
Figure 7.11 Simulated outer-valence PE spectrum of isoindoline and associated stick
bar graph, based on P3/6-311++G(d,p)//B3LYP/6-31+G(d,p) results. . . . 150
Figure 7.12 3-Methyl benzyl azide He(I) photoelectron spectra recorded at increasing
furnace temperature. . . 152
Figure 7.13 Proposed thermal decomposition pathways for 3-methyl benzyl azide, associated with the formation of the main intermediate products toluene (12),
m-tolunitrile (13), m-methyl benzylidene imine (14) and benzene (15). . . . 154
Figure 7.14 He(I) PE spectrum of 3-MBA, taken at 800 ◦C, and superimposed
spectra of acetonitrile, benzene, m-tolunitrile and m-methyl benzylidene imine
(P3/6-311++G(d,p)//B3LYP/6-31+G(d,p) results) . . . 154
Figure 7.15 He(I) PE spectrum of 3-MBA, taken at 1035 ◦C (left) and 1150 ◦C
(right), and superimposed spectra of toluene, m-tolunitrile and m-methyl ben-zylidene imine (simulated spectra, based on
P3/6-311++G(d,p)//B3LYP/6-31+G(d,p) results). At 1150◦C, the contribution of m-tolunitrile and
benzyli-dene has been decreased. . . 155
Figure 7.16 Simulated outer-valence PE spectrum of m-benzylidene imine and as-sociated stick bar graph, based on P3/6-311++G(d,p)//B3LYP/6-31+G(d,p)
results. . . 155
Figure 7.17 4-Methyl benzyl azide He(I) photoelectron spectra recorded at increasing
furnace temperature. . . 156
Figure 7.18 Proposed thermal decomposition pathways for 4-methyl benzyl azide, associated with the formation of the main intermediate products toluene (16),
Figure 7.19 He(I) PE spectrum of 4-MBA, taken at 690◦C, and superimposed
spec-tra of acetonitrile, benzene, p-tolunitrile and p-methyl benzylidene imine
(sim-ulated spectra, based on P3/6-311++G(d,p)//B3LYP/6-31+G(d,p) results). 159
Figure 7.20 He(I) PE spectrum of 4-MBA, taken at 975◦C (left) and 1265◦C (right),
and superimposed spectra of toluene, p-tolunitrile and p-methyl benzylidene imine (simulated spectra, based on P3/6-311++G(d,p)//B3LYP/6-31+G(d,p)
results). At 1265◦C, benzene and acetonitrile contributions were eliminated. 160
Figure 7.21 Simulated outer-valence PE spectrum of p-methyl benzylidene imine and associated stick bar graph, based on P3/6-311++G(d,p)//B3LYP/6-31+G(d,p)
results. . . 160
Figure 8.1 1H-form and 2H-form of 5ATZ (1and2, respectively). . . 166
Figure 8.2 Schematics of the experimental setup, with an expanded view of the
resistively heated oven: A - UV source, B - reaction cell, C - oven, D - entrance
slits, E - energy analyser, F - exit slits and G - electron detector. . . 168
Figure 8.3 Molecular orbitals contours (isovalue = 0.07) of 1H- and 2H-5ATZ, from
MP2/6-311++G(d,p) results. . . 171
Figure 8.4 He(I) PE spectrum of 5ATZ, taken at 190 ◦C (a). The asterisk marks
the N2peak from a controlled leak. Simulated PE spectrum of 2H-5ATZ, based
on P3 (b) and OVGF B (c) results. VIEs of tetrazole 2H-5ATZ, using the MP2,
P3 and OVGF B methods (d). . . 174
Figure 8.5 He(I) PE spectrum of 5ATZ, taken at 190◦C (a), and simulated
outer-valence PE spectrum, based on P3/6-311++G(d,p) results (b). The asterisk
marks the N2 peak from a controlled leak. . . 176
Figure 8.6 He(I) PE spectrum of the thermal decomposition of 5ATZ, taken at 245
◦C. . . . . 177
Figure 8.7 Detail of the He(I) PE spectrum of the thermal decomposition of 5ATZ
(gray), taken at 245 ◦C, with estimated contributions from the decomposition
species HCN (black), HN3 (light gray), NH2CN (lighter gray) and N2 (dark
gray). . . 178
Figure 8.8 IRC calculations connecting 1H-5ATZ and the stable azide compound,
obtained with MP2(Full)/6-31G(d). The relative energies of the TS and
prod-ucts, obtained with G2(MP2), are given in parentheses (in kJ/mol). . . 179
Figure 8.9 IRC calculations connecting the azide and N2plus the metastable CH3N3
compound, obtained with MP2(Full)/6-31G(d). The relative energies of the TS
and products, obtained with G2(MP2), are given in parentheses (in kJ/mol). 179
Figure 8.10 IRC calculations connecting 1H-5ATZ and HN3 plus NH2CN, obtained
with MP2(Full) /6-31G(d). The relative energies of the TS and products,
ob-tained with G2(MP2), are given in parentheses (in kJ/mol). . . 180
Figure 8.11 IRC calculations connecting 2H-5ATZ and N2 plus amino(diazenyl)
methylidene, obtained with MP2(Full)/6-31G(d). The relative energies of the
TS and products, obtained with G2(MP2), are given in parentheses (in kJ/mol). 181
Figure 8.12 IRC calculations connecting 2H-5ATZ and HN3 plus NH2CN, obtained
with MP2(Full) /6-31G(d). The relative energies of the TS and products,
ob-tained with G2(MP2), are given in parentheses (in kJ/mol). . . 181
Figure 8.13 Proposed scheme for the thermal decomposition of gas-phase 5ATZ. G2(MP2) energies (in kJ/mol) relatively to the 2H-tautomer are given above each structure (in boldface type font). ∆E represents the G2(MP2) energy
Figure 8.14 IRC calculations connecting the CH3N3carbene (from 2H-5ATZ
decom-position) and its isomer N-imino-methanimidamide, obtained with MP2(Full)/6-31G(d). The relative energies of the TS and products, obtained with G2(MP2),
are given in parentheses (in kJ/mol). . . 183
Figure 8.15 IRC calculations connecting N-imino-methanimidamide and HCN plus HNNH, obtained with MP2(Full)/6-31G(d). The relative energies of the TS
and products, obtained with G2(MP2), are given in parentheses (in kJ/mol). 183
Figure 8.16 Proposed scheme for the thermal decomposition of the CH3N3carbene.
G2(MP2) energies (in kJ/mol) relatively to the carbene are given above each structure (in boldface type font). ∆E represents the G2(MP2) energy barriers
(in kJ/mol) between the product(s) and the preceding reactant. . . 184
Figure 9.1 1H-form and 2H-form of 5MTZ (1and2, respectively). . . 186
Figure 9.2 Molecular orbital contours (isovalue = 0.07) of 1H- and 2H-5MTZ, based
on MP2/6-311++G(d,p) calculations. . . 190
Figure 9.3 He(I) PE spectrum of 5MTZ, taken at 140◦C (a). The asterisk marks
the H2O characteristic ionization line. Simulated PE spectra of 2H-5MTZ,
based on P3 (b) and OVGF B (c) results. VIEs of the 2H-5ATZ molecule, from
MP2, P3 and OVGF B methods (d). . . 192
Figure 9.4 He(I) PE spectrum of 5MTZ, taken at 140◦C (a), and simulated
outer-valence PE spectrum, based on P3/6-311++G(d,p) results (b). The asterisk
marks the H2O characteristic ionization line. . . 194
Figure 9.5 He(I) PE spectra of the thermal decomposition of 5MTZ, taken at 195,
250 and 450◦C (low heating rate). The asterisk marks the H2O ionization line. 196
Figure 9.6 He(I) PE spectrum of the thermal decomposition of 5MTZ, taken at ca.
195 ◦C (high heating rate). The asterisk marks the H
2O ionization line. . . . 196
Figure 9.7 Detail of the He(I) PE spectra of the thermal decomposition (at high
heating rate) of 5MTZ (grey), taken at ca. 195◦C, with estimated contributions
from the decomposition products HCN (black), CH3CN (lighter grey) and N2
(dark grey). The contribution from 5MTZ at 140◦C is included (light grey). 197
Figure 9.8 Potential energy diagram (in kJ/mol) for the thermal decomposition
of 5MTZ, calculated with the G2(MP2) method. Decomposition pathways re-garding the 1H-tautomer are shown at the right-hand side, whereas pathways relative to the 2H-tautomer are shown at the left-hand side. The results
involv-ing TSa and the decomposition of HN3are taken from the work of Besora and
Harvey, calculated at the CCSD(T)/cc-pV∞Z level of theory. All other results
are from these study. . . 197
Figure 9.9 IRC calculations connecting the HN=C=NCH3(from 1H-5MTZ
decom-position) and HNC plus CH2CN, obtained at the MP2(Full)/6-31G(d) level of
theory. The relative energies of the TS and the final dissociated products,
obtained with the G2(MP2) method, are given in parentheses (kJ/mol). . . . 200
Figure 10.1 Valence photoelectron spectra of 5MTZ, recorded with synchrotron ra-diation at 99.0 (a), 40.8 (b) and 21.2 eV (c) photon energy values, at ca. 313 K, and reference He(I) photoelectron spectrum (d). The asterisk marks the
ionization line of H2O. . . 206
Figure 10.2 Experimental (a) and simulated C 1s photoelectron spectra of 5MTZ, based on ∆SCF calculations with cc-pVTZ (b), 6-311++G(d,p) (c) and Ahlrichs-pVDZ (d) basis sets. Simulated spectra include contributions from both tau-tomers and result from the convolution of the CEBEs with gaussian profiles (fwhm=0.5 eV). Simulations at different 1H/2H population ratios are also
Figure 10.3 Experimental (a) and simulated N 1s photoelectron spectra of 5MTZ, based on ∆SCF calculations and cc-pVTZ (b), 6-311++G(d,p) (c) and Ahlrichs-pVDZ (d) basis sets. Simulated spectra include contributions from both tau-tomers and result from the convolution of the CEBEs with gaussian profiles (fwhm=0.5 eV). Simulations at different 1H/2H population ratios are also
shown: 0.07/0.93 (dashed), 0.2/0.8 (thick, stick spectrum) and 0.3/0.7 (thin). 211
Figure 11.1 Valence photoelectron spectra of 5ATZ, recorded with synchrotron ra-diation at 99.0 (a), 40.8 (b) and 21.2 eV (c) photon energy values, at ca. 313 K, and reference He(I) photoelectron spectrum (d). The asterisk marks the
ionization line due to a controlled N2 leak. . . 216
Figure 11.2 Experimental (a) and simulated C 1s photoelectron spectra of 5ATZ, based on ∆SCF calculations with cc-pVTZ (b), 6-311++G(d,p) (c) and Ahlrichs-pVDZ (d) basis sets. Simulated spectra include contributions from both tau-tomers and result from the convolution of the CEBEs with gaussian profiles (fwhm=0.5 eV). Simulations at different 1H/2H population ratios are also
shown: 0.02/0.98 (dashed), 0.1/0.9 (thick, stick spectrum) and 0.2/0.8 (thin). 218
Figure 11.3 Experimental (a) and simulated N 1s photoelectron spectra of 5ATZ, based on ∆SCF calculations and cc-pVTZ (b), 6-311++G(d,p) (c) and Ahlrichs-pVDZ (d) basis sets. Simulated spectra include contributions from both tau-tomers and result from the convolution of the CEBEs with gaussian profiles (fwhm=0.5 eV). Simulations at different 1H/2H population ratios are also
Page
Table 2.1 Principal resonance lines (wavelength in ˚A, energy in eV) for the rare
gases helium, neon, argon and xenon. . . 21
Table 2.2 Common vertical ionization lines used in the internal calibration process
of UV photoelectron spectra, using radiation from a He(I) source. . . 34
Table 2.3 Geometrical parameters of the five spherical gratings of the Gas-Phase
beamline, at Elettra. . . 50
Table 2.4 Flux and resolving power at different photon energies . . . 50
Table 4.1 Calculated vertical ionization energies (VIEs, in eV) of the GG’, G’A’,
G’S and GA conformers of M2AP, obtained with the OVGF B method and the
6-311++G(d,p) basis, on optimized MP2/6-311++G(d,p) geometries. . . 95
Table 4.2 Relative energies (∆G, kJ/mol) calculated with the G3 method (see text
for details) and Boltzmann population ratios (BPR, %) of the GG’, G’A’, GA
and G’S confomers of M2AP. . . 95
Table 4.3 Experimental and calculated vertical ionization energies (VIEs, eV) for
M2AP. MO stands for molecular orbital. . . 97
Table 4.4 Observed IR bands of M2AP isolated in a N2 matrix (12 K), and
corre-sponding calculated wavenumbers (cm−1) and intensities (km mol−1).. . . . 98
Table 5.1 Selected optimized parameters of BA and 1–, 2–, 3– and 4–MBA. . . . 112
Table 5.2 Experimental VIEs of BA and its methyl derivatives, and theoretical
results from MP2/aug-cc-pVTZ computations. . . 114
Table 6.1 Structures of the studied benzyl azides . . . 122
Table 6.2 EI (70 eV) mass spectra of compounds 1-5. Relative ionic abundances in
%. . . 125
Table 6.3 Linked scans data for compounds 1-5. . . 126
Table 6.4 Accurate mass data for benzyl azide. . . 126
Table 6.5 Accurate mass data for para-methylbenzyl azide. . . 129
Table 6.6 Total (hartree) and relative energies (kJ/mol) of benzyl and
methylben-zyl azide ions, selected transition structures and corresponding fragmentation
products. . . 132
Table 6.7 Experimental (VIE) and calculated (-ǫi) ionization energies (eV) of benzyl
azide. . . 133
Table 6.8 Experimental (VIE) and calculated (-ǫi) ionization energies (eV) ofortho
Table 7.1 Experimental VIEs of BA, detected pyrolysis products and possible
ther-mal decomposition species. . . 142
Table 7.2 Vertical ionization energies (VIEs, in eV) of N-phenylmethanimine, based
on P3/6-311++G(d,p) results, calculated at B3LYP/6-31+G(d,p) fully
opti-mized geometry. . . 144
Table 7.3 Experimental VIEs of 2-MBA, detected pyrolysis products and possible
thermal decomposition species. . . 147
Table 7.4 Vertical ionization energies (VIEs, in eV) of isoindoline, based on
P3/6-311++G(d,p) results, calculated at B3LYP/6-31+G(d,p) fully optimized
geom-etry. . . 150
Table 7.5 Experimental VIEs of 3-MBA, detected pyrolysis products and possible
thermal decomposition species. . . 153
Table 7.6 Vertical ionization energies (VIEs, in eV) of m-methyl benzylidene imine,
based on P3/6-311++G(d,p) results, calculated at B3LYP/6-31+G(d,p) fully
optimized geometry. . . 153
Table 7.7 Experimental VIEs of 4-MBA, detected pyrolysis products and possible
thermal decomposition species. . . 158
Table 7.8 Vertical ionization energies (VIEs, in eV) of p-methyl benzylidene imine,
based on P3/6-311++G(d,p) results, calculated at B3LYP/6-31+G(d,p) fully
optimized geometry. . . 158
Table 8.1 Calculated geometric parameters (˚A, deg) for the 1H- and 2H-tautomer
of 5ATZ, with two different methods and the 6-311++G(d,p) basis. . . 170
Table 8.2 Differences between selected geometric parameters (˚A) of the tautomers of
5ATZ in cationic and neutral ground states, obtained with B3LYP/6-311++G(d,p).
R = NH2. . . 170
Table 8.3 Total (hartree) and relative (kJ/mol) electronic energies of 1H- and
2H-5ATZ, calculated at different levels of theory. . . 171
Table 8.4 Gibbs free energies (GG2(M P2), a.u.), relative energies (∆G, kJ/mol) and
Boltzmann population ratios (BPR, %) of 1H- and 2H-5ATZ. . . 172
Table 8.5 Calculated vertical ionization energies (VIE, in eV) of 1H-5ATZ . . . 173
Table 8.6 Calculated vertical ionization energies (VIE, in eV) of 2H-5ATZ . . . 173
Table 8.7 Experimental vertical ionization energies (VIE, eV) and theoretical IE
values (eV) for 5ATZ. MO stands for molecular orbital and ∆E for energy
uncertainty (in eV). . . 175
Table 9.1 Calculated geometric parameters (˚A, deg) for the 1H- and 2H-tautomer
of 5MTZ, with two different methods and the 6-311++G(d,p) basis. The
con-formers A, B1 and B2 (see text for details) are indicated below each method. 189
Table 9.2 Differences between selected geometric parameters (˚A) of the tautomers of
5MTZ in cationic and neutral ground states, obtained with B3LYP/6-311++G(d,p).
R = CH3. . . 189
Table 9.3 Total (hartree) and relative (kJ/mol) electronic energies of 1H- and
2H-5MTZ, calculated at different levels of theory. . . 190
Table 9.4 Relative Gibbs free energies (∆G, kJ/mol) and Boltzmann population
ratios (BPR, %) of 1H- and 2H-5MTZ, based on G2(MP2) results. . . 191
Table 9.5 Calculated vertical ionization energies (VIE, in eV) of 1H-5MTZ . . . 191
Table 9.6 Calculated vertical ionization energies (VIE, in eV) of 2H-5MTZ . . . 193
Table 9.7 Experimental and calculated vertical ionization energies (VIE, eV) for
Table 10.1 Relative Gibbs free energy (kJ/mol) and Boltzmann population ratios
(BPRs, %) of 1H-5MTZ and 2H-5MTZ, calculated with the Gaussian-n and
Complete Basis Set methods. . . 205
Table 10.2 Experimental vertical ionization energies (VIE, eV) of the outer-valence
ionization region (10-16 eV) of 5MTZ. . . 207
Table 10.3 C 1s and N 1s calculated and measured CEBEs (eV) of 5MTZ. Calculated values are based on the ∆SCF approach with the cc-pVTZ (I), 6-311++G(d,p) (II) and Ahlrichs-pVDZ (III) basis set. Koopmans’ theorem (KT) and
relax-ation energies (Erelax) regarding ∆SCF/cc-pVTZ are given in eV. Population
ratios in %. . . 210
Table 11.1 Relative Gibbs free energy (kJ/mol) and Boltzmann population ratios
(BPRs, %) of 1H-5ATZ and 2H-5ATZ, calculated with the Gaussian-n and
Complete Basis Set methods. . . 215
Table 11.2 Experimental vertical ionization energies (VIE, eV) in the outer-valence
ionization region (10-16 eV) of 5ATZ. . . 216
Table 11.3 C 1s and N 1s calculated and measured CEBEs (eV) of 5ATZ. Calculated values are based on the ∆SCF approach with the cc-pVTZ (I), 6-311++G(d,p) (II) and Ahlrichs-pVDZ (III) basis set. Koopmans’ theorem (KT) and
relax-ation energies (Erelax) regarding ∆SCF/cc-pVTZ are given in eV. Population
ratios in %. . . 219
Table 12.1 Selected results obtained in the study of nitrogen containing molecules of biological and industrial interest. Experimental VIEs are in eV, and
calcu-lated activation energies (Ea) and reaction enthalpies (∆rH) for exothermic N2
2MBA 2-Methyl benzyl azide.
3MBA 3-Methyl benzyl azide.
3MBA 4-Methyl benzyl azide.
5ATZ 5-Aminotetrazole.
5MTZ 5-Methyltetrazole.
AES Auger electron spectroscopy.
AIE Adiabatic ionization energy.
AO Atomic orbital.
B3LYP Becke’s three-parameter functional coupled to the Lee-Yang-Parr functional
BA Benzyl azide
BE Binding energy
BL Beamline
BM Bending magnet
BO Born-Oppenheimer
BPR Boltzmann population ratio
CBS Complete basis set
CEBE Core-electron binding energy
CGTO Contracted Gaussian-type orbital
cc correlation-consistent
CI Configuration interaction
CIS Configuration interaction including single excitations
CISD Configuration interaction including single and double excitations
CSV Comma separated values
DFT Density functional theory
DIIS Direct inversion in the iterative subspace
EIMS Electron impact mass spectrometry
EPT Electron propagator theory
ES Experimental station
ESCA Electron spectroscopy for chemical analysis
FAT Fixed analyser transmission
FTIR Fourier-transform infrared
FWHM Full-width at half-maximum
GF Green’s function
Gn Gaussian-n methods
GTO Gaussian-type orbital
HF Hartree-Fock
HFGF Hartree-Fock Green’s function
HLC Higher-level correction
IE Ionization energy
IR Infrared
IRC Intrinsic reaction coordinate
KS Kohn-Sham
KT Koopmans’ theorem
LINAC Linear accelerator
M2AP Methyl 2-azidopropionate
MAD Mean absolute deviation
MBGF Many-body Green’s function
MBPT Many-body perturbation theory
MEP Minimum-energy path
MO Molecular orbital
MPn Møller-Plesset perturbation theory up ton-order
MPPT Møller-Plesset perturbation theory
m.r.t. Mean residence time
MS Mass spectrometry
NEXAFS Near-edge X-ray absorption fine-structure spectroscopy
NIM Nuclear instrumentation module
NIST National Institute of Standards and Technology
NMR Nuclear magnetic resonance
OVGF Outer-valence Green’s function
P3 Partial third-order approximation
PE Photoelectron
PES Photoelectron spectroscopy
PGTO Primitive Gaussian-type orbital
PID Proportional-integral-differential
PIMS Photoionization mass spectrometry
PSU Power supply unit
PTFE Polytetrafluoroethylene
QCSCF Quadratically convergent self-consistent-field
QM Quantum chemistry
RF Radio-frequency
RHF Restricted Hartree-Fock
SCEM Single-channel electron multiplier
SCF Self-consistent-field
SD Slater determinant
SO Spin-orbit
SSR Solid state relay
STO Slater-type orbital
TC Thermocouple
TOF Time-of-flight analyzer
TS Transition structure
TST Transition state theory
TTL Transistor-transistor logic
UHF Unrestricted Hartree-Fock
UHV Ultra-high vacuumm
UV Ultraviolet
VIE Vertical ionization energy
XPS X-ray photoelectron spectroscopy
Chapter
1
Introduction
1.1
Gas-phase study of nitrogen containing molecules
Nitrogen (N) constitutes the majority of Earth’s atmosphere, with approximately 78% of the atmospheric mixture being nitrogen. This element is essential in so many different ways that life on Earth would not be possible without it.
A simple but definitive example regarding the presence of this element in natural occurring biological structures are the porphyrins macrocycles. The nitrogen atoms in these heterocyclic structures functionalize the compound to a degree that trapping magnesium (Mg) or iron (Fe) leads to the formation of two essential biological molecules: chlorophyll and haem. Hence, photosynthesis and oxygen transport through blood – two essential processes in life – are only possible due to the unique electronic structure of nitrogen.
The ground-state electronic configuration of the N atom is 1s22s22p3, with five
outer-shell electrons. The triple bond established between two nitrogen atoms to form molecular nitrogen (Fig. 1.1 (a), N≡N) is one of the strongest chemical bonds known
(∆Hdiss. = 944.7 kJ mol−1). This makes N2 practically non-reactive. Energetically
speaking, however, it is extremely advantageous for molecular systems containing N atoms to fragment and form N2. Throughout the centuries, the high energy release
ac-companying this fragmentation process constituted the fundamental interest in nitrogen containing molecules. An interest which has not faded with time...
Figure 1.1: Structure of N2 (a), generic azide R-N3 (b), and tetrazole R-CN4-R’ (c).
Two classes of synthetic nitrogen based molecules have been continuously studied over time: compounds of the form R–N3, termed azides1,2, and heterocyclics of the
form R–CN4–R′, termed tetrazoles3–5 (see Fig. 1.1 (b) and (c) respectively). These
compounds are widely spread among distinct areas of research and development: py-rotechnics, drug synthesis, automobile industry, propellants, and explosives are just a hand-full of examples from several available applications.
the electronic structure and thermal stability of selected azides and tetrazoles.
A concise general description and up-to-date review of the existing literature con-cerning gas-phase studies on molecules containing the azido group and the tetrazole moiety will be given in the following sections. Specific literature data regarding each analysed molecule will not be given in this Chapter; instead, updated information con-cerning what is already known about the compounds will be followed in each chapter dealing with the specified compound.
1.1.1 Azides
The synthesis of the first azide recalls to 1858, with the experiments of Griess7 on aromatic diazonium salts. The azo-compounds were latter explored by Curtius8, who
managed to successfully synthesise benzoyl (C7H5N3O) and sodium (NaN3) azides. The
well-known –N=N+=N−resonance description of the R-N
3 group was only established
in 1931, by Sutton9, who confirmed the open-chain formula of azides.
Azides participate in several ubiquitous reactions, like the Curtius rearrangement8 or the Schmidt reaction10. A very extensive and useful review on azide’s synthetic
use was written by Scriven and Turnbull11, and before them by L’Abbe12. The book by Patai1, in the 1970’s, and the more recent review and book by Br¨ase et al.13, and Br¨ase and Banert2, respectively, written in the first decade of the new millennium,
accumulate an extensive amount of information regarding azido compounds synthesis, properties and applications. More recently, azides gained a renewed interest among worldwide chemistry R&D labs due to the emerging concept of “click-chemistry”14and
its banner reaction: the copper catalyzed 1,3-dipolar cycloaddition of azides to alkynes, to yield 1,2,3-triazoles15,16.
Even at early times, the explosive character of azides was not overlooked2:
Cur-tius described a sample of aqueous hydrogen azide on local heating giving rise to a “formidable detonation and disintegration of the thick-walled glass tube to dust”.
However, the consistent study of photodegradation and thermal decomposition of azides only began in the 1960’s, with the work of Reiser17–20 on the photolysis of aromatic azides and with the work of Smolinsky21 on the pyrolysis of vinyl azide.
The possibility of forming a nitrene intermediate through either light sensitisation or controlled heating was launched.
The fate of alkyl azides when subject to controlled heating, in the gas-phase, under vacuum, was further studied by Bock and Dammel22–24, in the 1980’s, using real-time gas analysis and photoelectron spectroscopy. For the first real-time, the unimolecular thermal decomposition of alkyl azides was unveiled: N2 extrusion was showed to occur
synchronously with the imine formation via 1,2-H or 1,2-CH3 shifts.
In the mid-1990’s, following the basis laid by Costa and co-workers on aliphatic azides25–27, the photoelectron spectroscopy group in the University of Southampton, started to work on the thermal decomposition of organic azides, together with the photoionisation group from Universidade Nova de Lisboa.
Using matrix-isolation infrared (IR) spectroscopy28as a complementary technique, Dyke and co-workers successfully characterised both the electronic structure and gas-phase thermal decomposition of an extensive set of newly synthesised azido compounds: 2-azidoacetic acid29, azidoacetone30, 2-azidoethanol and 2-azidoethyl acetate31, 2-azidoacetamide32, and methyl/ethyl-azidoformate and 2-azido-N, N-dimethylacetamide33.
The experiments were accompanied by studies performed with high-resolution mass spectrometry, trying to cross-link the decomposition patterns obtained via pyrolysis and the fragmentation arising from electron ionization34–37.
Bock and Dammel of N2 extrusion synchronous with the 1,2-H shift onto the electron
deficient N atom. In azides where the central C atom was not bound to any H or alkyl donor i.e. in azides where the carbon atom was incapable of liberating any atom or group to stabilize the electron-deficient nitrogen, a cyclic intermediate was formed rather than an 1,2-H shift imine. Bock’s mechanism was termed “type 1” and the mech-anism discovered by Dyke and co-workers was termed “type 2”. The general schemes for the two mechanisms are shown in Fig. 1.2.
Figure 1.2: General “type 1” (a) and “type 2” (b) thermal decomposition mechanisms of organic azides.
An enormous research potential collates to the thermal decomposition of azides and its gas-phase study: new intramolecular mechanisms can be discovered, mediated by unknown reactive intermediates which can be used as building blocks in high yield syn-thetic applications. This makes fundamental study of organic azides a very interesting research subject.
A question is utterly launched: will potentially interesting physico-chemical prop-erties appear if an extra nitrogen and carbon atoms are added to the N3 chain, closing
it in a stable pentagonal structure?
1.1.2 Tetrazoles
Tetrazoles are characterized by a five-membered, doubly unsaturated ring consisting of one carbon and four nitrogen atoms. The first tetrazole was synthesized in 1885 by Bladin38, at the University of Upsala during his experiments with dicyanophenylhy-drazine3. Bladin managed to prepare the simplest form of tetrazole (HCN
4H) a few
years later39, before retiring completely from the field.
Since Bladin’s original experiments, several other researchers continued to work on tetrazoles. Among them, Thiele40 was successful in synthesizing 5-aminotetrazole (NH2-CN4H) for the first time. In 1910, the simplest synthesis of tetrazole was achieved
by Dimroth41 by the direct combination of hydrogen cyanide and hydrogen azide. The review of Benson3, in 1947, compiles most extensively the information regarding the first fifty years of prolific research on tetrazoles. As with azides, the tetrazoles potential as high-energy materials was soon recognized, with the majority of the new compounds either decomposing or exploding when heated above their melting point.
and Herbst42 on the 5-substituted tetrazoles synthesized according to the primordial
HCN + HN3 reaction41 strongly pointed to the existence of an intermediate azide,
clearly indicating some sort of tetrazole-azide equilibrium, also known as ring-chain isomerism (Fig. 1.3, (b)⇋(c)).
The recent analysis of Raczy´nska43 relating π electron delocalization and
tau-tomerism in a series of organic molecules, devotes part of its attention to tetrazoles: tautomeric forms of tetrazoles are related to an aromaticity index44forπelectron delo-calization in the ring system, connecting ground-state electronic structure and chemical properties.
Figure 1.3: Annular tautomerism between 1H- and 2H- tautomers of generic 5-substituted tetrazoles (a⇋b). Tetrazole-azide ring-chain isomerism (b⇋c).
Since Benson’s review, tetrazoles only appeared in comprehensive heterocyclic chem-istry compendiums45,46. No major periodic revisions referring to the physico-chemical properties of tetrazoles were put on before the continuity analysis of Koldobskii, Os-trovskii and co-workers4,47,48. In 1994, a major revision by Wittenberger5 covering synthesis and applications of tetrazoles and derivatives, emphasized the role of the tetrazole moiety in several medicinal applications.
More recently, the “click chemistry” concept was also applied to tetrazoles by the team of K. B. Sharpless49: several 5-substituted 1H-tetrazoles were prepared from the addition of NaN3to nitriles, in a water reflux with zinc salts as catalysts. The presence
of water obviously mitigates the risk of explosion hazards from groups such as aromatic azides and nitro compounds49, and eases the industrial scale production of tetrazoles. Experiments with the decomposition of organic tetrazoles via photolysis or pyrolysis started as early as the first synthetic preparations. However, the study of gas-phase photofragmentation of the simple tetrazole molecule was only achieved in the 1990’s, by Maier et al.50, using matrix-isolation IR spectroscopy. In addition, flash vacuum pyrolysis of tetrazole was performed.
In recent years, the research group of Fausto, in Coimbra, studied the vibrational behaviour and gas-phase photochemistry of an extensive set of fundamental tetrazoles, using matrix-isolation IR techniques and UV-irradiation of the samples. Their stud-ies included molecules like tetrazole51, 5-chlorotetrazole52 and 1-phenyltetrazole53. A
complete description of all the tetrazoles analysed by this group and an up-to-date anal-ysis of the photochemical transformations of tetrazole derivatives and its applications in organic synthesis can be found in the review by Frija et al.54.
Photoelectron spectroscopy was used recurrently by Palmer and co-workers55–57to study the electronic structure of the azoles, and further utilized by Guimon58to monitor the gas-phase flash pyrolysis of tetrazole. A thorough analysis of the thermal decom-position of the tetrazole molecule was also performed in the 1990’s, by Lesnikovich and co-workers59–61, using several approaches, including modern calorimetry techniques. Years later, the same approach was again used by Lesnikovich62 to characterize the
thermal decomposition of other ubiquitous tetrazole: the 5-aminotetrazole.
are not consistent. Fig. 1.4 accounts for already proposed pathways, involving the general gas-phase thermal decomposition of tetrazole and 5-substituted derivatives.
Figure 1.4: General thermal decomposition pathways for 1H-5-substituted tetrazoles leading to N2 (a), and 2H-5-substituted tetrazoles leading to HN3 (b).
Most studies of gas-phase thermal decomposition of tetrazoles deal with the ques-tion of tautomerism because the initial tautomeric ratio governs which decomposiques-tion pathways will be preferentially followed, in the initial stages of a pyrolysis process. It is also a matter of common agreement that the nature of the 5-substituents affects the gas-phase tautomeric ratio, and hence the pyrolysis process. It is clear by now that the 2H-form governs almost all tetrazoles in the gas-phase65,66, but is deprecated over the
1H-tautomer in the solid state.
In summary, the thermal decomposition of tetrazoles (and azides) acts as a powerful source of the almost inert N2 gas, which can be employed in a myriad of interesting
applications. In addition, the degradation of tetrazole (and azides) can also act as a rich source of intermediates and radical species, useful in the development of new and promising drugs. What are then the main areas of application of these two nitrogen containing compounds?
1.1.3 Applications
Azido compounds find their use sparsely disseminated from the industrial need of foam-ing gas for plastic modellfoam-ing to the synthesis of drugs for AIDS treatment67.
They can act as isosteric substituents of other functional groups of biological in-terest, such as methylsulfonyl and aminosulfonyl. The smaller azide group is slightly more lipophilic than these two groups, hence it can interact more efficiently with some biological units (as arginine). The azide group can also be used in photoaffinity la-belling of proteins: photolysis liberates N2, leaving the remaining N atom free to form
a nitrene with the protein, marking the latter for detection68.
They are widely used in the synthesis of 1,2,3-triazoles, through copper-catalysed 1,3-dipolar cycloaddition reactions with alkynes, and in the synthesis of tetrazoles, through zinc-catalysed [3+2] dipolar cycloaddition reactions with nitriles, under water reflux14–16,49. Extensive information regarding fundamental characteristics of organic
azides chemistry with its “explosive” diversity in modern synthetic chemistry can be found in the review by Br¨ase et al.13.
Azides are potential high-energy density materials69 and are also used in the