Matthew Simon Bieniek
DOCTORATE IN PHYSICSModelling Self-Organization
on Electrodes of DC Glow Discharges
DOCTORAL THESIS
DM
TD
i
Acknowledgements
I thank supervisors for the contribution they have made to my academic, professional, and personal development. Also for inviting me into the environment they have helped to carve out in Madeira Island, where great science can be done, and new scientists can be trained.
I acknowledge Diego Santos for his e¤orts and talents in modelling that contributed to the work on identifying bifurcations.
I thank Helena Kaufman for her compnay during lunch, and for helping me to write the abstract for this thesis in Portuguese.
Also, I wish to thank my other colleagues for pleasant interactions and stimulating discussion.
Preamble
The work leading to this thesis was performed within activities of:
FCT - Fundacão para a Ciência e a Tecnologia of Portugal through the project Pest-OE/UID/FIS/50010/2013.
Most of the results presented in this thesis are published in the following articles: M. S. Bieniek, P. G. C. Almeida, and M. S. Benilov, Modelling cathode spots in glow discharges in the cathode boundary layer geometry (2016), J. Phys. D: Appl. Phys. No. 49 105201
M. S. Bieniek, D. Santos, P. G. C. Almeida, and M. S. Benilov, Bifurcations in the theory of current transfer to cathodes of dc discharges and observations of transitions between di¤erent modes
Submitted in Feb 2018 to Phys. Plasmas
M. S. Bieniek, P. G. C. Almeida, and M. S. Benilov, Self-consistent modelling of self-organized patterns of spots on anodes of DC glow discharges
Submitted in Feb 2018 to Plasma Sources Sci. Technol
Results presented in this thesis were reported at the following conferences:
M. S. Bieniek, P. G. C. Almeida, and M. S. Benilov, Modelling anode spots of DC glow discharges, in Proc. XXXIII ICPIG (9-14 July 2017, Estoril, Portugal) M. S. Bieniek, P. G. C. Almeida, and M. S. Benilov, Modelling cathode spots in glow discharges in the cathode boundary layer geometry with COMSOL Multi-physics , in Proc. XXXII (26-31 July 2015, Iasi, Romania)
Resumo
O trabalho apresentado nesta dissertação refere-se à modelação de padrões de auto-organização de densidade de corrente em elétrodos de descargas DC luminescentes.
Padrões de manchas anódicas foram modelados de forma auto-consistente pela primeira vez e os fenómenos nas manchas foram investigados. As soluções que de-screvem as manchas foram encontradas num intervalo de correntes com múltiplas soluções. Foi descoberta uma inversão da densidade de corrente local do ânodo no cen-tro de cada uma das manchas, isto é, mini-cátodos são formados dencen-tro das manchas; poder-se-ia dizer, as manchas do ânodo funcionam como uma descarga luminescente unipolar. As soluções não se enquadram no padrão convencional de auto-organização em sistemas dissipativos não-lineares biestáveis; por exemplo, as transições de um modo para outro não se realizam através de bifurcações.
Padrões auto-organizados de manchas catódicas em descargas luminescentes foram modelados na camada de plasma junto ao cátodo, numa geometria igual à utilizada na maioria das experiências descritas na literatura. O efeito da geometria da câmara de descarga nas manchas foi investigado. Os padrões de manchas modelados são idênticos aos observados nas experiências e similares aos calculados na con…guração de elétrodos planos em paralelo.
Uma tentativa foi feita para modelar quantitativamente a descarga DC lumines-cente com manchas catódicas. Uma descrição detalhada desta modelação, a mais precisa deste fenómeno até à data, é apresentada. Em geral, os padrões calculados são semelhantes aos observados nas experiências, mas as CVC são qualitativamente diferentes.
Cenários de transições entre modos com diferentes padrões de manchas em elétro-dos de descargas DC luminescentes e em cátoelétro-dos de descargas de arco são investigaelétro-dos. No caso de transições entre padrões em cátodos de descargas DC luminescentes, foram encontradas as transições observadas nas experiências que podem estar diretamente relacionados a bifurcações de soluções estacionárias, e as bifurcações correspondentes foram modeladas. Os padrões encontrados na modelação numérica estão em conformi-dade com os observados no decurso das transições nas experiências. No caso dos cáto-dos de descargas de arco, mostra-se que qualquer transição entre diferentes mocáto-dos de transferência de corrente está relacionada a uma bifurcação de soluções estacionárias.
Palavras chave: Interacção plasma-cátodo, Auto-organização, Descargas
Abstract
In this work self-organized patterns of current density on electrodes of dc glow dis-charges were modelled.
Patterns of anodic spots were modelled self-consistently for the …rst time and their physics was investigated. The solutions describing the spots were found to exist in a region of current with multiple solutions. A reversal of the local anode current density in the middle of each of the spots was discovered, i.e. mini-cathodes are formed inside the spots or, as one could say, the anode spots operate as a unipolar glow discharge. The solutions do not …t into the conventional pattern of self-organization in bistable nonlinear dissipative systems e.g. the modes are not joined by bifurcations.
Self-organized patterns of cathodic spots in glow discharges were computed in the cathode boundary layer geometry, which is the one employed in most of the experi-ments reported in the literature. The e¤ect that the geometry of the vessel has on the spots was investigated. The computed spot patterns are the same as the ones observed in the experiment and similar to the ones computed in the parallel plane electrode con…guration.
An unsuccessful attempt was made to quantitatively model DC glow discharge with cathodic spots, an account of this, the most accurate modelling of the phenomenon yet performed, is given. In general, the computed patterns are observed in the experiment but the CVC are qualitatively di¤erent.
Scenarios of transitions between modes with di¤erent patterns of spots on elec-trodes of dc glow discharges and cathodes of arc discharges are investigated. In the case of transitions between patterns on dc glow cathodes, those transitions reported in the experiments that may be directly related to bifurcations of steady-state solutions are found and the corresponding bifurcations are computed. Patterns found in the numerical modelling conform to those observed in the course of the transitions in the experiment. In the case of cathodes of arc discharges, it is shown that any transition between di¤erent modes of current transfer is related to a bifurcation of steady-state solutions.
Keywords: Plasma-electrode interaction, Self-organization, Glow discharges,
Ca-thodic spots, Anodic spots
Contents
1 Introduction 1
1.1 Direct current glow discharge . . . 1
1.1.1 Modelling and theory during the 20th century. . . 1
1.2 Self organization . . . 3
1.2.1 Thermodynamics of self organization . . . 4
1.2.2 An introduction to stability . . . 5
1.2.3 An introduction to bifurcations . . . 6
1.3 Self organization of spots on electrodes of glow discharges . . . 6
1.3.1 Observations of spots on cathodes of glow discharges . . . 6
1.3.2 Theory and modelling of cathode spots . . . 7
1.3.3 Observations of spots on anodes of glow discharges . . . 9
1.3.4 Theory and modelling of anode spots. . . 9
1.4 This work . . . 11
2 Anode spots 12 2.1 Introduction . . . 12
2.2 The model . . . 13
2.3 Results and discussion . . . 15
2.3.1 Current-voltage characteristics of the anode region . . . 16
2.3.2 Anode spot structure. . . 18
2.3.3 Near-anode physics . . . 21
2.3.4 Additional comments . . . 22
2.4 Conclusions . . . 23
3 Modelling cathode spots in glow discharges in the cathode boundary layer geometry 24 3.1 Introduction . . . 24
3.2 Model and Numerics . . . 26
3.3 Results. . . 28
3.3.1 Fundamental mode . . . 28
3.3.2 3D modes . . . 31
3.4 Conclusions . . . 36
CONTENTS vii
4 Bifurcations in the theory of current transfer to cathodes of DC discharges and observations of transitions between di¤erent modes 37
4.1 Introduction . . . 37
4.2 Scenarios of transitions between di¤erent modes of current transfer to electrodes of dc discharges and their relation to bifurcations . . . 38
4.3 Mode transitions on cathodes of arc discharges . . . 41
4.4 Mode transitions on cathodes of dc glow discharges . . . 42
4.4.1 State-of-the-art of the theory . . . 42
4.4.2 Analyzing experimental observations . . . 43
4.4.3 Numerical modelling . . . 46
4.4.4 Comparing the modelling and the experiment . . . 55
4.5 Summary and the work ahead . . . 59
5 Conclusions of the thesis 64
List of Figures
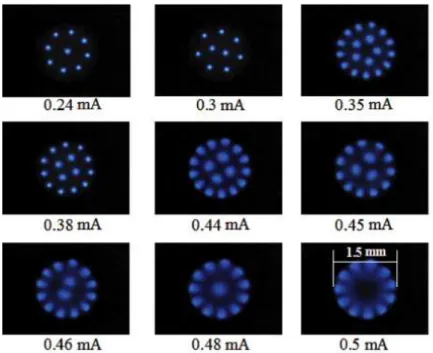
1.1 Patterns of lumous spots of current density on a cathode of a DC glow microdischarge, for di¤erent values of discharge current. Xenon under a pressure of 75 torr. Reprinted from [46]. . . 7
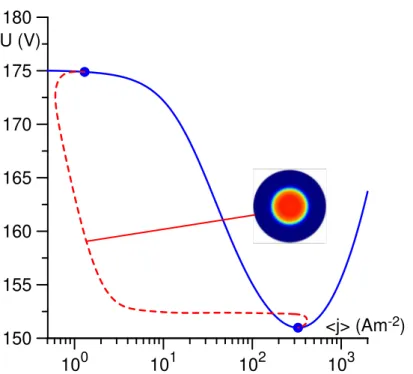
1.2 Computed CVC of DC glow discharge. Solid line: 1D mode. Dashed line: 2D modes. Circles: bifurcation points. Xe plasma. Pressure of 30 Torr. Adapted from [56].. . . 9
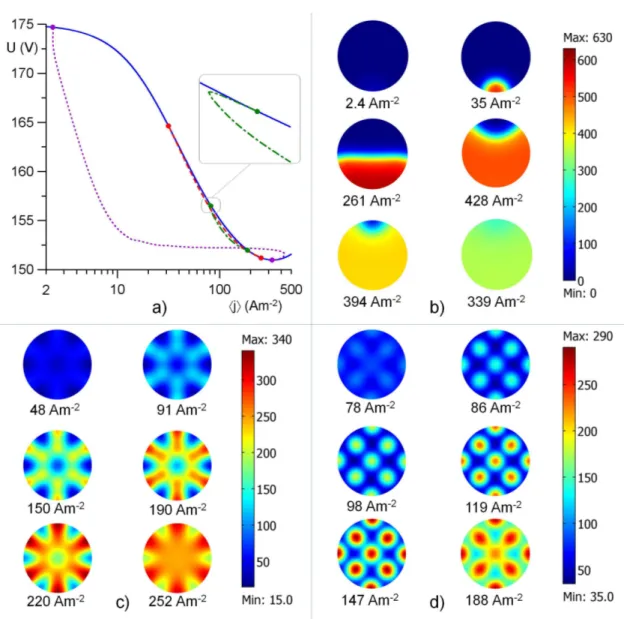
1.3 a) CVC of 1D and 3D modes. b-d) distributions of current density over the cathode surface. Solid line: 1-D mode. Dotted line: 1st (in order of decreasing current) 3D mode. Dashed line: 8th 3D mode. Dashed-dotted line: 12th 3D modes. Circles: Bifurcation points. (b).(d) Dis-tributions of current density for (b) 1st 3D mode (c) 8th 3D mode (d) 12th 3D mode. Reprinted from [42]. . . 10
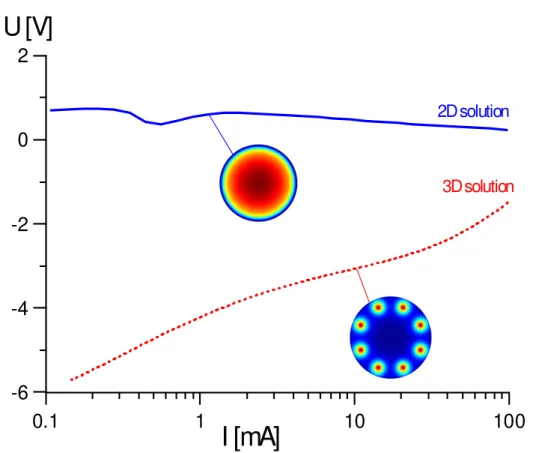
2.1 Near-anode voltage drop for a wide range of currents. Solid line: 2D mode. Dotted line: 3D mode. 2D and 3D solutions are with schematics that indicate a characteristic distribution of electron number density on the anode. . . 17
2.2 Electron number density on the surface of the anode. 3D solution, I=10 mA. . . 18
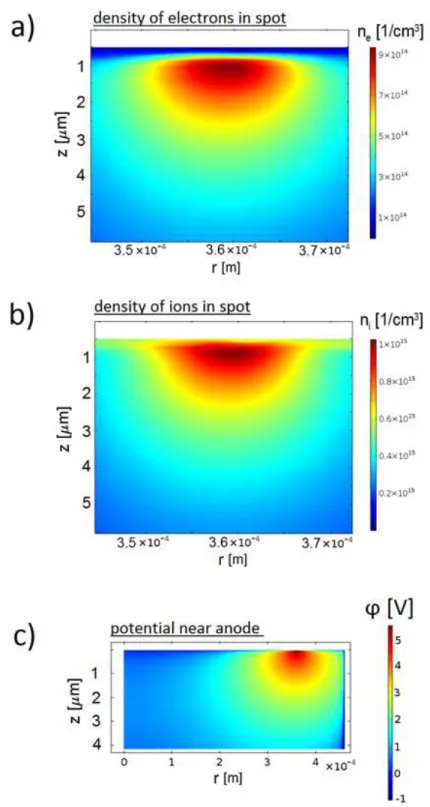
2.3 a) Electron number density in the spot. b) Ion number density in the spot. c) Electric potential in the near-anode region. Distributions in the plane of symmetry passing through the spot center. I = 1 mA. . . 19
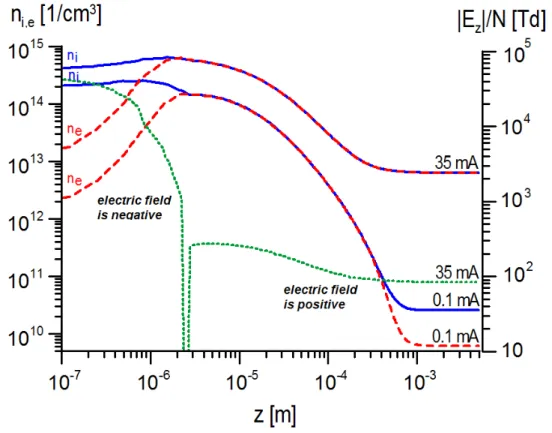
2.4 Number density of ions (solid line), number density of electrons (dashed line), for I= 35 mA, and I=1A. Reduced electric …eld (dotted line) for I= 35 mA. Plot made from centre of spot, along axial direction, to end of calculation domain. . . 20
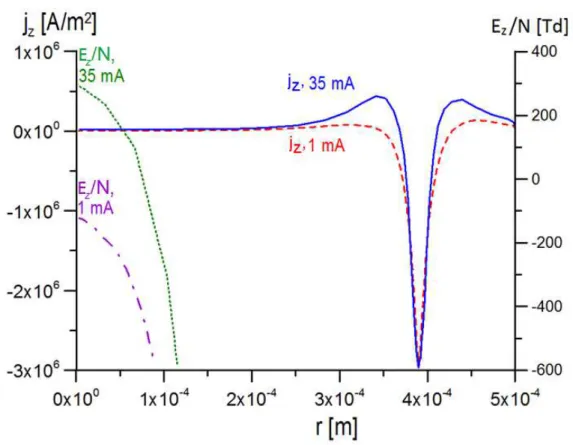
2.5 Distribution of axial current density and axial electric …eld on the sur-face of the anode in the plane of symmetry passing through the spot center. Large negative values of electric …eld are not shown. . . 21
2.6 Distribution of the number density of ions in the plane of symmetry passing through the spot center. Arrows: unit vector of current density. I=1 mA. . . 22
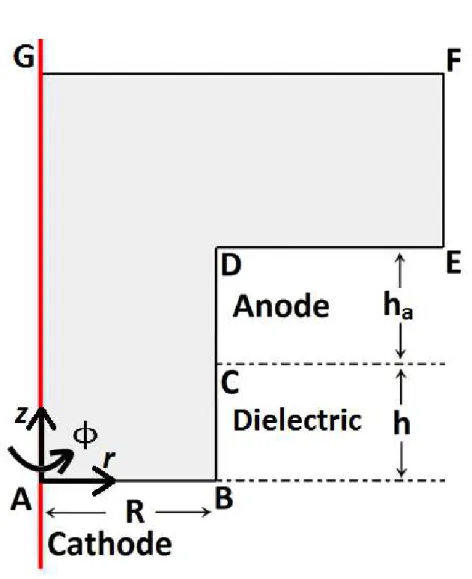
3.1 Con…guration of a cathode boundary layer vessel. AG is the axis of symmetry of the vessel. . . 25
LIST OF FIGURES ix
3.2 Fundamental mode. 1: baseline conditions. 2: h = 0.5mm, ha= 0.1mm,
R = 1.5mm. 3: baseline geomentry, re‡ecting dielectric surface. 4: h =0.25mm, ha = 0.25mm, R = 0.375mm. . . 29
3.3 Solid: fundamental mode (mode 1 of …gure 2). Dashed: mode a3b3.
Circles: points of bifurcation. . . 30
3.4 Bifurcation diagram. Solid: fundamental mode (mode 1 of …gure 2). Dashed: modes a3b3, a4b4, a5b5. Dotted: mode a6b6. Circles: points
of bifurcation. ‘+’ on the image representing the mode a4b4 indicates
the point on cathode surface where the value jc is taken. . . 32
3.5 Evolution of patterns of current density on the cathode associated with 3D modes of …gure 4: (a) mode a3b3, (b) mode a4b4, (c) mode a5b5and
(d) mode a6b6. . . 33
3.6 Cross section view of a 3D hot spot associated with the mode a4b4 at
di¤erent currents. The cross section plane passes through the centre of the spot. (a), (d): Ion density. (b), (e): Election density. (c), (f): Potential.
. . . 35
4.1 Schematic of current-voltage characteristics (CVCs) of the di¤use mode of current transfer to rod cathodes of high-pressure arc discharges and of the mode with a spot at the edge of the cathode. The sections shown by the solid lines and the transitions shown by the arrows are observed in the experiment. . . 44
4.2 CVCs. Solid: the 1D (fundamental) mode. Dashed-dotted: 2D mode a3b3. Other lines: di¤erent 3D modes. Circles: bifurcation points. Top:
General view. Bottom: Details near the point of minimum of the CVC of the 1D mode. . . 48
4.3 Evolution of distributions of current on the surface of the cathode as-sociated with di¤erent modes. a): mode a2b2. b): a4b4. c): a5b5. . . . 50
4.4 Bifurcation diagram. Solid: the 1D (fundamental) mode. Dashed, dot-ted: 3D second generation modes a4b4 and a5b5. Circles: bifurcation
points. . . 51
4.5 Bifurcation diagram. Solid: the 1D (fundamental) mode. Dashed: 2D mode a3b3. Other lines: 3D modes. Circles: bifurcation points. . . 52
4.6 Evolution of distribution of current on the surface of the cathode asso-ciated with the mode a3;2b3;2. . . 53
4.7 Bifurcation diagram. Solid: the 1D (fundamental) mode. Dashed: 3D second-generation mode a10b10. Dotted: 3D third-generation mode
a10;1b10;1. Circles: bifurcation points. . . 54
4.8 Experimentally observed and computed transitions between di¤erent modes in xenon. . . 56
Chapter 1
Introduction
1.1
Direct current glow discharge
In 1838 Michael Faraday produced the …rst report of a direct current (DC) glow dis-charge [1]. Faraday, who used a voltaic pile as a power source, passed current through di¤erent gases, at various pressures, via electrodes in a glass bell jar. At low pressures, he observed a phosphorescent continuous glow around one of his electrodes, which he described as "exceedingly beautiful". The main features of a DC glow discharge can be read about in the textbook by Raizer [2]. The discharge has been signi…cant in both fundamental plasma science and in applied plasma science. DC glow discharges have been used in spectroscopy [3], allowing research on the elements of materials in the gas, liquid, and solid state; laser technology [4], with laser gain medium being electrically pumped by DC glow discharge; surface property modi…cation [5], that atmospheric pressure glow discharge may adapt the wetting properties of a surface; cancer inhi-bition research [6], glows with liquid anodes have been demonstrated to suppress the activity of at least two types of cancer cell, in vitro; sources of ultraviolet radiation [7], that DC glow microdischarges, when con…gured to yield high energy electrons in a high pressure gas, result in excimer production; to name just a few examples of DC glow discharge being utilized in science.
1.1.1 Modelling and theory during the 20th century
A well-known one-dimensional description of the cathode fall was formulated in 1934 by von Engel and Steenbeck [2]. The description reveals a U-shaped current density voltage characteristic (CDVC). However, the transition from the Townsend discharge to the abnormal discharge, as revealed by the von Engel and Steenbeck solution, is particularly di¤erent to what is observed in experiments. Instead of the normal dis-charge observed in the experiments, the solution by von Engel and Steenbeck has a
1. Introduction 2
one-dimensional distribution of charged particles, and reveals a falling CDVC section. While von Engel comments that the causes of the di¤erences are basically not un-derstood [8], Steenbeck proposes arguments to describe the observed physics of the normal discharge on the basis that the axial electric …eld ought to be minimized [9] (the so-called ’Steenbeck’s principle of minimum power’, which became more widely accepted as it was reported that this principle is a corollary of the principle of minimum entropy production [10]). The rising section of the CDVC associated with the von En-gel and Steenbeck solution corresponds with the abnormal discharge in a qualitatively accurate way.
Circa 1960, glow discharge modelling results started to be found with the aid of electronic computers [11, 12]. The authors aimed to solve the relevant, coupled, physical equations: in [12], equations of conservation of number density of electrons and ions (considering only drift ‡uxes), and Poisson’s equation, were solved. An e¤ective Townsend ionization coe¢cient was used (recombination was neglected). The results essentially duplicated von Engel and Steenbeck’s solution. In particular, there was agreement, whereby under particular conditions1, the CDVC was U-shaped.
In the 1980s, two-dimensional modelling of glow discharges started to emerge (e.g. [14–16]) which, based on similar underlying physics as the one-dimensional models, revealed the structure of the normal spot. In 1988 [17] Boeuf solved a two-dimensional model, and found the structure of the normal spot, the normal current density e¤ect, and the current-voltage characteristic (CVC) plateau associated with the normal spot. The basic mechanisms of the model are drift and di¤usion for the ions and the electrons, volume ionization, recombination, and secondary electron emission. The model yielded an accurate qualitative description of the transverse behavior of the transition from the abnormal mode to the normal model.
The aforementioned modelling used a ‡uid description of the plasma. This ap-proach is based on the taking of moments of the Boltzmann equation (BE) (e.g. [18,19]), for each of the species considered, coupled with the Poisson equation (or the relevant set of Maxwell’s equations). For that sake of practicality, it is normally the case that the electron energy distribution function is assumed to be either Maxwellian or a two term spherical harmonic expansion with the second term accounting for an anisotropic perturbation [20]. The set of equations generated from the taking of the moments of the BE are closed, in the case of the electrons, typically at the level of either momentum, or energy. In the case of momentum, one typically employs the drift-di¤usion approximation, with the transport and kinetic coe¢cients related to
1If a discharge, by way of its product of pressure and the distance of electrode separation, would
1. Introduction 3
space and time by functions (built using the solution to the BE) with the reduced electric …eld as their argument: the so-called local-…eld approximation (LFA). The LFA is suitable when the characteristic length of electron energy relaxation is small compared to a characteristic discharge length. When one includes in the set of equa-tions to be solved an equation for electron energy, the transport and kinetic coe¢cients for the charged species may be related to space and time by a function (built using the solution to the BE) with the average of electron energy as the argument: the so-called local mean energy approximation. The latter approximation is more accurate and allows for the study e¤ects such as striations [21].
Strictly speaking, one should only use the ‡uid-based approach to the modelling of a plasma when that plasma has an energy distribution function for the charged species that are Maxwellian (although, ‡uid approaches may perform ’better than they should’, e.g. [22] p. 35). When a ‡uid-based approach is not appropriate, one may employ a kinetic-based approach to modelling [23] e.g. when the species are in a strongly non-uniform …eld (as may be the case in the cathode fall [24]), and regions with few collisions. In general, the kinetic based approach requires a greater computational e¤ort, but fewer a priori assumptions.
By the end of the 21st century, the main features of the discharge, e.g. those dis-cussed in chapter 8 of [2], had been, quite faithfully, reproduced by computer models.
1.2
Self organization
The term self-organisation is used in various disparate academic disciplines. In social science [25], it is used in connection with phenomena such as city formation; in com-puter science [26], in connection with methods of utilizing idle system components; in biology [27], used in the context of morphogenesis, whereby identical cells may di¤er-entiate into, for example, an organism with eyes. Broadly, the term self organization is used to describe the spontaneous occurrence of order among multiple subunits, from a source other than the direct motivation of an external in‡uence.
In this thesis, the term self-organisation is used to refer to the occurrence of dissipa-tive structures. Prigogine coins the term ‘dissipadissipa-tive structure’ [28] in 1967, referring to structures, or patterns of structures, with a clear degree of spatial regularity, which form in conditions far from thermodynamic equilibrium, and are maintained by ‡uxes of matter and energy. The emergence of spatiotemporal structures (e.g. the Belousov– Zhabotinsky reaction [29]), are neglected in this thesis.
1. Introduction 4
1.2.1 Thermodynamics of self organization
Prigogine’s textbook [30] on self-organization introduces dissipative structures in the same way as in this section.
It is well known that the second law of thermodynamics prevents the spontaneous formation of order in isolated systems. Also, that in such systems there is a coupling between the degree of order in the system and its evolution, and ultimately its stability. In closed systems, whereby exchanges of heat with outside reservoirs are permitted, ordered structures may arise: Helmholtz free energy is minimized at thermodynamic equilibrium and for low temperatures the probability that a particle in the system is at a state of a low energy level (by Boltzmann’s ordering principle [31]) is high, hence solid crystals or phase transitions occur. At moderate temperatures (e.g. the temperature of animal cells), however, the probability of the formation low entropy structures, via the former ordering principle, is prohibitively small, and yet, order in cells exist. Apparently a di¤erent source of order is also available to nature.
A class of thermodynamic system termed ‘open’ was studied at the de Donder school in Brussels (see e.g. books by von Bertalan¤y [32] and E. Schrodinger [33] on the physics of life), i.e. a thermodynamic system was studied that takes into account exchanges of matter and heat with its surroundings. Prigogine in 1945, working from the school, makes the contribution of extending the second law of thermodynamics to such open systems. Entropy change is considered in a time interval, and decomposed into two contributions: entropy ‡ux due to exchanges with the environment, and entropy production due to irreversible processes inside the system. The change in entropy in time can therefore be negative, as exchanges of negative entropy from outside system may be dominant (change in entropy would regularly be seen as being only positive, if one only considered isolated systems). Thus in principle, ordered structures may arise in open systems as long they are being maintained by ‡uxes of matter and energy with ’negative entropy’. Such structures are termed ’dissipative structures’. Many apparent examples of such structures are listed in [34]. An early example of which, observed by Lehmann in 1902 [35], is a localized solitary luminous spot found on an anode of a DC glow discharge.
Prigogine’s textbook points to un…nished thinking on a criterion based on thermo-dynamic state functions (e.g. entropy, entropy production), for the onset of dissipative structures. A comment is made that such structures may coincide with a minimum of entropy production. Contemporary academics are still debating the possibility of …nding such a general thermodynamic criterion [36].
1. Introduction 5
follows. Within the framework of a model of nonlinear surface heating of a cathode of an arc discharge, a computed solution associated with the lowest discharge voltage was selected, from among several other solutions existing for the same discharge current, as the one that is stable [37] based on Steenbeck’s principle of minimum power. However, numerical results presented in [38] and the analytical theory [39] indicate that the low-voltage branch is unstable, and the high-low-voltage branch is stable. Further, even if it was found that the principle of minimum entropy production was valid for gas discharges, Steenbeck’s principle of minimum power is shown [40] to not be a corollary of the principle of minimum entropy production. Hence, an understanding of the general theory of stability is important in situations with multiple solutions.
1.2.2 An introduction to stability
The literature on stability is well developed (see e.g. the textbook [41]). The con-cept and some common approaches to studying stability are brie‡y introduced in this section.
A system of di¤erential equations governing the evolution of variables in a space, such as phase space, may be constructed using …rst principles such as classical physics and potential …elds. A solution to those equations is said to be stable if the time evolution of an initial state plus a perturbation will remain close to the initial state at all subsequent moments. Otherwise, the solution is unstable. One may describe a solution as locally stable, globally stable, or stable against a particular perturbation. A solution is globally stable if any perturbation on an initial state would result in an evolution of the solution that would have it return to the initial state. A solution is locally stable, or metastable, if any small perturbation on the solution would result in an evolution of the solution that would have the solution return to the initial state.
1. Introduction 6
1.2.3 An introduction to bifurcations
A concise summary of the information from bifurcation theory relevant to this thesis can be found in the Appendix of [43]; a more detailed discussion of the theory can be found in, e.g., the review [44]. A brief introduction to bifurcations follows.
A bifurcation is a splitting of a solution occurring when one varies a system control parameter past a certain critical point (the bifurcation point). The splitting corre-sponds with a qualitative or topological change to the solution(s) past the bifurcation point. An example is the pitchfork bifurcation: consider a two-dimensional (axially symmetric) solution describing, for instance, the spatial distribution of the number density of some particles in a three-dimensional space, that varies with a control pa-rameterp. Atp=p0 there exists a bifurcation point, before and after the bifurcation
point the stability of the solution changes2 (for de…niteness, the solution is stable for p > p0 and unstable for p < p0). At p0 a three-dimensional solution also exists, that
branches o¤ away from the two-dimensional solution. If the three-dimensional solution branches o¤ into the rangep < p0, where the two-dimensional solution is unstable, then
the pitchfork bifurcation is supercritical. One would observe, as one varies from high to lowp, along the solutions that are stable, a smooth transition from the two-dimensional distribution of the number density to a three-dimensional distribution. The e¤ect of symmetry breaking leads to an ordering of the solution (e.g. a bifurcation point on an axially symmetric two-dimensional solution may lead to a three-dimensional solution with azimuthal periodicity; from e.g. a torus like distribution to a distribution in the form of a ring of equidistant spheres).
1.3
Self organization of spots on electrodes of glow
dis-charges
1.3.1 Observations of spots on cathodes of glow discharges
The earliest examples of observations of luminous spots of current density on cathodes of glow discharges were of the solitary normal spot e.g. as in Figure 16 of [45].
In 2004, during a study of DC glow microdischarges as sources of excimer emis-sion [46], organized patterns of luminous spots of current density on the cathode, as in Figure 1.1, were observed. During the last decade many accounts were made of such spots [7, 46–54]. The patterns have been observed for di¤erent gases [55] (in-fact, the experiments on self-organization on cathodes of DC glow microdischarges in gases other than xenon were motivated by the prediction, generated from modelling
2In the context of linear stability analysis, a bifurcation coincides with the switching of the sign of
1. Introduction 7
Figure 1.1: Patterns of lumous spots of current density on a cathode of a DC glow microdischarge, for di¤erent values of discharge current. Xenon under a pressure of 75 torr. Reprinted from [46].
results, that the patterns can occur in alternative plasma-producing gases). In terms of discharge geometry, the vast majority of the experiments have been performed in the so-called cathode boundary layer con…guration, a device comprising a ‡at cathode and a ring-shaped anode, separated by a dielectric (cf., e.g., Figure 1 of [54]). Note that the modelling had only been performed for discharges with parallel-plane electrodes [42,43, 53, 56–58]. Experiments that were performed in the parallel-plane electrode con…guration show [49] self-organized patterns that are similar to the ones found in the cathode boundary layer con…guration.
Spot patterns on cathodes of DC glow discharges have so far only been directly observed in microdischarges. There is currently no explanation why the patterns have not been observed in larger devices. Indications that the patterns also occur in larger atmospheric pressure glow discharges exist in the form of unexplained erosion patterns on cathodes [59], and observations of ring and cog-like structures [60].
1.3.2 Theory and modelling of cathode spots
1. Introduction 8
discharge (the trivial solution), of0 Afrom0 Vto the breakdown voltage, then instead of a U-shaped CDVC one …nds an N-shaped CDVC. The left-hand branch belonging to the stable unlit discharge, the right hand branch belonging to the stable abnormal discharge, and the central branch belonging to the unstable region with a negative di¤erential resistance. That the system is N-shaped and bistable is an indication that phase coexistence will manifest [61]. The falling section of the ’N’ is unstable and, in order for a discharge to be found in an experiment at those values of current, a stable solution ought to exist in that region of current too. One may attempt to employ a Maxwell construction3 to …nd a stable branch [62]. The new stable branch would
correspond with a solution describing a coexistence of the stable states on either side of the N-shaped system (see e.g. Figure 5. of [63]).
In 1988 Benilov [64] proves that within a basic model used to describe a glow discharge (one similar to [12]) there exists multiple solutions in the same range of cur-rents: a one dimensional solution, and multidimensional solutions bifurcating from the one dimensional solution near the beginning and end of the CVC region with negative di¤erential resistance. Benilov proposes that the multidimensional solution(s) may describe the behavior of the normal discharge. In 2010 Almeida proves this hypothesis [56] by means of numerical simulation: a two-dimensional solution is computed that indeed reproduces the behavior of the normal mode (a solution similar to the one found by Boeuf [24]) which bifurcates from the one-dimensional solution: CVC in Figure 1.2. The description of the normal discharge as a coexistence of the abnormal discharge and the unlit discharge is very convincing. It (apparently, alone) explains the normal current density e¤ect: for a decreasing current, less plasma is in the stable state of the abnormal discharge (the abnormal discharge at a particular voltage), and with the system being bistable, the plasma converts to, the only other stable con…guration, the unlit discharge.
In 2011 Almeida [42], using the theoretical description of multiple solutions devel-oped to describe the normal mode, computed three-dimensional patterns of spots on the cathodes of microdischarges (see Figure 1.3).
Modelling has since provided a wealth of modes and the comparison between the spots found in these modes and the spots observed in the experiment (those from section1.3.1) is convincing.
3A classical example of a Maxwell’s construction is performed on van der Waals equation of state
1. Introduction 9
100 101 102 103 150
155 160 165 170 175 180 U (V)
<j> (Am-2)
Figure 1.2: Computed CVC of DC glow discharge. Solid line: 1D mode. Dashed line: 2D modes. Circles: bifurcation points. Xe plasma. Pressure of 30 Torr. Adapted from [56].
1.3.3 Observations of spots on anodes of glow discharges
Luminous spots on anodes of DC glow discharges have been observed for over a century now e.g., [35,65–71]. The spots have been observed in a wide range of pressures [65,71], and in di¤erent gases [66]. At low pressures, a connection has been observed with the various types of double layer structures (e.g.[72–77]). Single spots have been studied in some depth and are being utilized as ion sources (which can produce a stable and high-current ion beam) [78].
1.3.4 Theory and modelling of anode spots
The current theoretical framework for the patterns of luminous spots of current density on anodes is not well developed. For instance, no self-consistent modelling has been performed (modelling had been performed that revealed current density structures e.g. [79], but these, apparently, treated the column as a cathode). A detailed description of the spots is absent.
1. Introduction 10
1. Introduction 11
double layers, a theoretical analysis by [76] also indicates precursors for the onset of spots (a positive anode bias above a threshold value).
Patterns of spots have been calculated by means of a phenomenological theory, based on the general trends of self-organization by [69].
1.4
This work
The questions that will be addressed in this thesis are discussed in this section. Can the well developed theoretical interpretation of cathodic spots be applied to the spots found on anodes of DC glow discharges? What is the behavior of the anode spots? In chapter2a report is given of self-consistent modelling of patterns of anodic spots, the physics of the spots is investigated. The solutions describing the anode spots are compared to the cathode spots and the conventional pattern of self-organization in bistable nonlinear dissipative systems.
To what extent does the vessel geometry e¤ect the patterns of the spots found on cathodes of DC glow microdischarges? In the chapter3 a report is given of modelling of self-organized patterns of cathodic spots in the cathode boundary layer geometry, which is the one employed in most of the experiments reported in the literature. The modelling is compared to prior modelling done in the plane parallel geometry and to the spots observed in the experiment.
Can modelling of cathode spots on glow microdischarges be quantitatively accu-rate? In the chapter4a report of 3D ‡uid modelling of the cathodic spots is performed for the experimental conditions, using the local mean energy approximation, an ac-count of several plasma and gas species, and a fairly detailed acac-count of their reactions. The modelling results are compared to the experimental accounts.
Chapter 2
Anode spots
2.1
Introduction
For more than a century now beautiful patterns on anodes of DC glow discharges have been observed [35,65–71]. The patterns are of signi…cant theoretical interest in themselves, and also because of their connection with various types of double layer structures, which have been studied at low gas pressures [72,73,75–77]. The patterns are interesting also from the point of view of their technological applications. As examples, we note that single spots have been utilized as ion sources with a stable and high-current ion beam extraction [78], and recently it has been shown that self-organized patterns on liquid anodes of atmospheric pressure glow microdischarges can reveal a nontrivial cancer-inhibiting capability [81].
A theoretical analysis, and experimental investigation, of the anode layer region performed in [80] indicates that instabilities found in the regions’ so-called subnormal regime are a precursor for the formation of anode spots. Also in [80], the in‡uence that the spots have on the homogeneity of the plasma column is investigated. A theoretical analysis of anode spots in relation to double layers is given by [76], which predicts an onset of spots for a anode biases below a threshold value. Numerical simulations have been performed which revealed current density stripes on anodes [79], a circular spot [82], and a circular spot surrounded by a ring [82]. Patterns of spots have been calculated by means of a phenomenological approach based on the general trends of self-organization in [69].
Self-organized arrangements of spots and patterns on cathodes of DC arc and glow discharges have been understood and systematically described in terms of multiple steady-state solutions, which exist in conventional models of glow discharge over the same range of discharge current and describe modes associated with di¤erent cathode spots and cathode spot patterns; e.g., [83] and references therein. We hypothesize
2. Anode spots 13
that the same approach is applicable to spots and spot patterns on anodes of DC glow discharges. In other words, we postulate that spots and spot patterns on anodes of DC glow discharges can be described by a new class of solutions, that exist in conventional models of glow discharges, alongside the solution associated with the spotless mode of current transfer. In this work we prove this hypothesis. Two solutions, as exam-ples, are computed over the same, wide, range of current. One solution describes an axially symmetric di¤use, or spotless, mode, and the other solution describes a three-dimensional mode with azimuthal periodicity comprising a self-organized pattern of 8 anode spots.
The outline of the chapter is as follows. The model is described in section 2.2. In section 2.3, results of the modelling are given and discussed. Conclusions are drawn in section 2.4.
2.2
The model
Consider a cylindrical DC glow discharge tube that is long enough that the e¤ect of the electrodes become obviated in the column. In the column the density of charged species and electric …eld are independent of the axial coordinate. This invariance allows us to choose an asymptotically accurate set of boundary conditions on a domain that contains only the region from the anode to the column. The computation domain is adequate for an investigation of anode spots, or patterns of spots, appearing as a result of processes of plasma-anode interaction only.
The simplest model of a glow discharge is used, which is well-known but brie‡y summarized here for completeness. It comprises equations for conservation of elec-trons and a single ion species, the transport equations, written in the drift-di¤usion approximation, and Poisson’s equation:
@ni
@t +r Ji = ne eE neni; Ji = Dirni ni ir'; @ne
@t +r Je = ne eE neni; Je= Derne+ne er';
"0r2' = e(ni ne): (2.1)
Here ni, ne, Ji, Je, Di, De, i, and e are number densities, densities of transport
‡uxes, di¤usion coe¢cients, and mobilities of the ions and electrons, respectively; is Townsend’s ionization coe¢cient; is coe¢cient of dissociative recombination; '
is electrostatic potential, E =jr'j is electric …eld strength;"0 is permittivity of free
2. Anode spots 14
electron transport and kinetic coe¢cients are assumed to depend on the local electric …eld only.
Let us introduce cylindrical coordinates (r; ; z) with the longitudinal axis in line with the axis of the discharge tube. The computation domain is a cylinder
f0 r Rg,f0 2 g,f0 z hgwhereRis the tube radius and the boundary
z=h is positioned in the discharge column.
Standard boundary conditions are used for the lateral dielectric wall, r =R, de-scribing absorption of ions and electrons, and electrical insulation:
Jin= r
8kBTi
mi
ni
4; Jen=
r
8kBTe
me
ne
2 ; Jin Jen= 0: (2.2)
Here subscript n represents the projection of the corresponding vector along n the normal directed outside the computation domain,kB is Boltzmann’s constant,Ti and
Te are ion and electron temperatures (known parameters),mi andmeare the ion and
electron masses. When a time-dependent solver is used, the last condition in equation (2.2) is replaced by the following boundary condition
"0
@' @n = s,
@ s
@t =e(Jin Jen), (2.3)
which describes surface charge accumulation; here "0 is permittivity of free space and
s is surface charge density. If a steady-state has been reached, these conditions are
equivalent to the last condition in equation (2.2).
Boundary conditions at the anode surface (z= 0) are
Jin = r
8kBTi
mi
ni
4 ; Jen=
r
8kBTe
me
ne
2 Jin; '= 0: (2.4)
The conditions for the ions and the electrons are similar to the ones for the dielectric wall (2.2), except for the second term on the rhs of the boundary condition for the elec-trons (the second equation in (2.4)). This term describes secondary electron emission, which may become relevant if the local electric …eld is directed from the plasma to the anode. A parameter is introduced which is1 if the local electric …eld is directed to the anode, and0otherwise. Note that the choice of which secondary electron emission coe¢cient, , to use was not clear as the anode sheath voltage and, consequently, the energy of incident ions are small. In any case, this term produces a small e¤ect even for of order unity, since its magnitude for comparable ni and ne is of the order of
p
meTi=(miTe) with respect to the …rst term on the rhs of the second equation in
(2.4). The third condition in (2.4) de…nes the zero of potential.
2. Anode spots 15
@ni
@n = 0; @ne
@n = 0; @'
@n =Ez. (2.5)
Here Ez is the axial electric …eld; a given parameter which may be chosen to ensure
desired values of the discharge current I. The parameterh has to be large enough so the conditions (2.5) are satis…ed not just at the boundaryz=h, but also in a region adjacent to the boundary; in other words,hhas to be larger than the thickness of the near-anode region.
We hypothesize that the problem (2.1)-(2.5) admits an axially symmetric (2D) steady-state solution, describing a spotless, or di¤use, mode of current transfer to the anode, and three-dimensional steady-state solutions, presumably describing modes with patterns of spots. By analogy with computed spot patterns on cathodes of DC glow discharges, and in qualitative agreement with experimental results on anode spot patterns, we assume that the 3D solutions are periodic in with the period 2 =n, where n= 1;2;3; : : :, then it is su¢cient to limit the computation domain to a half-period of the desired 3D solution: 0 =n. Boundary conditions at = 0 and
= =n are zero normal derivatives,
@ni
@n = 0; @ne
@n = 0; @'
@n = 0; (2.6)
so that = 0 and = =nrepresent planes of symmetry of the solution considered. Results reported in this work refer to a discharge in helium under the pressure of 5 Torr. The (only) ionic species considered is He+2. The transport and kinetic
coe¢cients are the same as in [84]. The discharge tube radius is R= 0:5 mm and the height of the computation domain ish= 5 mm. It is set that = 0:03,Te = 1 eV, and
Ti = 300 K.
The modelling was performed in COMSOL Multiphysics. Both the steady-state and time-dependent forms of problem (2.1)-(2.6) have been solved. The Plasma Mod-ule with a stationary solver, and a time-dependent solver, have been employed. The Plasma Module was adapted so that it could be used in combination with a stationary solver and supplemented with a residual-based stabilization method.
2.3
Results and discussion
One of the computed solutions reported in this chapter is 2D and describes the spotless mode. As an example, a 3D mode withn= 8is also reported, and it describes a mode with eight spots. Note that the relatively high value of n permits a relatively small computation domain and thus reduces the required RAM and computation time.
2. Anode spots 16
in contrast to solutions describing cathodic spots and patterns of cathodic spots in arc and glow discharges, which do bifurcate from a fundamental (generally 2D) solution. Therefore the approach developed for the systematic computation of multiple solutions describing spots and patterns on cathodes of arc and DC glow discharges [83] could not be used. To …nd the 3D solution reported in this work, we …rst solved the 1D axially symmetric and steady-state form of the problem (2.1)-(2.2), describing the discharge column. (Analytical solutions of this 1D problem for the limiting cases corresponding to free-fall and ambipolar di¤usion [22] and a recombination-dominated discharge were used to validate the code.) In order to obtain the 3D solution, a solution of the 1D problem governing the column for the discharge currentI = 10 mA
was introduced as an initial condition for the time-dependent solver, the one solving the time-dependent form of the problem (2.1)-(2.6) including surface charge accumulation at the dielectric wall, equation (2.3). The computations have been performed with the value of Ez, the input parameter describing the axial electric …eld at the column
boundary, corresponding to the I = 30 mA, and not to 10 mA. The time-dependent solver was ran; the mismatch in Ez introduced a perturbation to the system that
resulted in an evolution to a 3D time-independent solution to the problem. The stationary solver was then used to compute the 3D solution in a wide range of current.
2.3.1 Current-voltage characteristics of the anode region
Consider the potential distribution in the discharge column, 'c, (which is axially
symmetric),
'c(r; z) = (z h)Ez+'h(r); (2.7)
where 'h(r) is the distribution of potential at the computational boundary, z = h. We de…ne the near-anode voltage drop as the di¤erence between the potential at the anode (equal to zero), and the potential that is obtained by extrapolation of the column solution (2.7) to the anode (z= 0):
U = hEz 'h(r): (2.8)
2. Anode spots 17
0.1
1
10
100
-6
-4
-2
0
2
I [mA]
U [V]
2Dsolution
3Dsolution
Figure 2.1: Near-anode voltage drop for a wide range of currents. Solid line: 2D mode. Dotted line: 3D mode. 2D and 3D solutions are with schematics that indicate a characteristic distribution of electron number density on the anode.
inU between the di¤erent solutions will be equal. We indicate for de…niteness that in this work the rhs of equation (2.8) is evaluated on the axis.
The near-anode current-voltage characteristics (CVCs) of the two solutions, exist-ing in the same range of current, are shown in Figure 2.1. One solution describes a 3D mode that is azimuthally periodic, the other a 2D mode that is axially symmetric. The 3D mode has a negative value of near-anode voltage in the range of the computed current, while the 2D mode has a positive value of near-anode voltage in the range of the computed current.
2. Anode spots 18
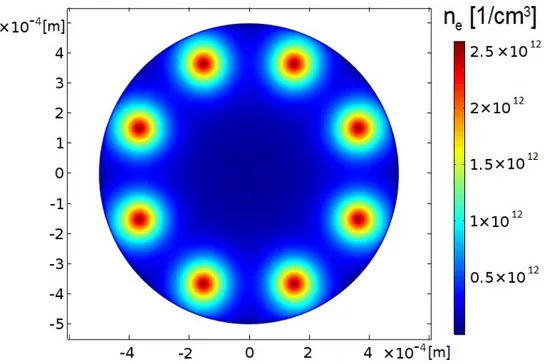
Figure 2.2: Electron number density on the surface of the anode. 3D solution, I=10 mA.
2D solution, and no bifurcations were found in a wide current range.
2.3.2 Anode spot structure
The electron number density on the surface of the anode for the 3D mode at10 mAis shown in Figure 2.2. Electron density is organized in an azimuthally periodic pattern of spots. The pattern is similar to that observed experimentally in Figure 1 of [65].
Densities of ions and electrons are shown in Figure 2.3 in the plane of symmetry plane = 0 (a longitudinal cross section passing through the tube axis and the centre of a spot) forI = 1 mA. One can see that the electron and ion densities are distributed in a similar way to the so-called …reballs observed experimentally in [76].
Distribution of the charged particle densities along the axial direction from the centre of a spot to the end of the calculation domain (a 1D plot with constant ; r), for the 3D mode at I = 0:1 mA and 35 mA, are shown in Figure 2.4. There is a region withni > ne, i.e., an ion sheath, adjacent to the electrode. The ion densities
2. Anode spots 19
2. Anode spots 20
Figure 2.4: Number density of ions (solid line), number density of electrons (dashed line), for I= 35 mA, and I=1A. Reduced electric …eld (dotted line) for I= 35 mA. Plot made from centre of spot, along axial direction, to end of calculation domain.
to ambipolar di¤usion coming into play near the (absorbing) lateral wall.
Distribution of the electric …eld in Figure 2.4 is shown for35 mA. The electric …eld in the ion sheath is two orders of magnitude greater than that in the quasi-neutral region. The former points towards the anode, while the latter points away from the anode.
An investigation into the type of sheath that forms on a small electrode in contact with plasma, based on 2D particle-in-cell simulations, was carried out in [86]. It was shown that an electrode biased between0andkTe=2ebelow the plasma potential had
2. Anode spots 21
Figure 2.5: Distribution of axial current density and axial electric …eld on the surface of the anode in the plane of symmetry passing through the spot center. Large negative values of electric …eld are not shown.
the adjacent plasma large distances from the spot; skipping for brevity results on the charge particle distribution, we only note that there is an electron sheath adjacent to the electrode.
2.3.3 Near-anode physics
The distribution of current density and electric …eld along the anode surface in the plane of symmetry = 0(the longitudinal cross section that passes through the centre of a spot) is shown in Figure 2.5. Plots are included for two di¤erent discharge currents. The current density has a large magnitude and is negative inside the spot, and turns positive outside. The spot behaves like a mini-cathode or, as one could say, operates as a unipolar glow discharge.
The direction of current density in the plane of symmetry is shown in Figure 2.6. For reference the distribution of the ions number density is shown as well. The unipolar glow discharge is clearly seen.
2. Anode spots 22
Figure 2.6: Distribution of the number density of ions in the plane of symmetry passing through the spot center. Arrows: unit vector of current density. I=1 mA.
spot and positive outside for35 mA; it is negative everywhere for 1 mA. Directions of the electric …eld at the anode and of current density from the anode inside and outside the spot are summarized in Table 2.1. For the 2D spotless mode,Ez >0, jz >0 for
all values of current.
Current 3D, within the spot 3D, outside the spot
1 mA Ez <0,jz <0 (cathode) Ez <0,jz >0 (…eld-reversal anode)
35 mA Ez <0,jz <0 (cathode) Ez >0,jz >0 (regular anode)
Table 2.1. Physics of the near-anode region for the 3D solution.
2.3.4 Additional comments
No double layers were found during this modelling. However, this modelling was per-formed at a higher pressure than the pressure of the experiments that revealed double layers. An interesting question is whether the self-organised anode spots reported here would contain double layers at lower pressure, or if they are distinct phenomena.
2. Anode spots 23
multiple solutions existing in the same range of discharge currents, which was achieved. The model may be used for qualitative analysis, and certainly some interesting trends have emerged. Nevertheless it is well known that a detailed account of the complex plasma chemistry of a helium discharge, and the nonlocality of electron energy ought to be included. Another aspect that needs to be improved is a description of the near-electrode sheath, which is collisionless inside the spot.
Bombardment on the anode by low-kinetic energy ions occurs inside the spots. An interesting hypothesis is that the ions incident on the anode contribute to or are responsible for the cancer-inhibiting e¤ect reported in [81].
2.4
Conclusions
For the …rst time, a self-organized pattern of spots of plasma on an anode was computed self-consistently. A new class of stationary solutions, describing anode spots, was found in the conventional DC glow discharge model. The 3D solution was found to exist in the same range of currents as a 2D solution describing a spotless mode of current transfer.
On the one hand, there are similarities between the computed anode spots and the spots on cathodes of arc and DC glow discharge: both are described by multiple steady state solutions and reveal azimuthal periodicity. On the other hand, the spots on the anode are di¤erent to the spots on the cathode in following ways: the solution describing the spotless mode does not contain a pronounced N-shaped current-voltage characteristic; no bifurcations were found in a wide range of currents, i.e., the anode spots were found to exist isolated from the 2D spotless mode. The anode spots are apparently related to the change in the sign of the near anode voltage.
Chapter 3
Modelling cathode spots in glow
discharges in the cathode
boundary layer geometry
3.1
Introduction
Self-organized patterns of cathode spots in DC glow microdischarges were observed for the …rst time in 2004 [46] and represent an important and interesting phenomenon. A range of experimental reports have since been published [7, 46–54]. Modelling of the phenomenon [42,43,53,56–58] has revealed, in agreement with the general theory of cathode spots and patterns in arc and DC glow discharges [63], the existence of multiple steady-state solutions for a given value of discharge current, which comprise modes of current transfer associated with di¤erent cathode spot patterns. Predictions concerning the existence of self-organized patterns in gases other than xenon, generated from the modelling, have been con…rmed experimentally [53].
The vast majority of the experiments [7,46–54] have been performed in a discharge device comprising a ‡at cathode and a ring-shaped anode, separated by a dielectric (cf., e.g., Figure 1 of [54]); this discharge con…guration is called cathode boundary layer discharge (CBLD) by the authors of the experiment. However, the modelling has been performed up to date for discharges with parallel-plane electrodes only [42,43,53,56–
58]. The question of how the shape of the anode a¤ects the pattern of self-organization has so far not been addressed. Furthermore, the e¤ect over 3D spots of absorption of the charged particles by a dielectric surface has not been investigated in full due to computational di¢culties [57].
In this work, 3D modelling of cathode spots is reported for the …rst time in CBLD, and the self-organization is computed with a full account of absorption of charged
3. Modelling cathode spots in glow discharges in the cathode boundary
layer geometry 25
3. Modelling cathode spots in glow discharges in the cathode boundary
layer geometry 26
particles at the dielectric surface. The outline of the chapter is as follows. The model is described in section3.2. In section3.3.1the e¤ect over the fundamental mode of the discharge radius, the thickness of the cathode and dielectric, and of a dielectric surface that re‡ects charged particles is investigated. In section3.3.2 examples of computed 3D modes are given and compared to their experimental counterparts, the e¤ect on 3D modes of a dielectric surface that re‡ects charged species is also analyzed. In section
3.4conclusions are drawn.
3.2
Model and Numerics
The model employed in this work is the most basic self-consistent model of glow discharge. Although the model is very well-known, it is described here for the sake of completeness. The model comprises equations for conservation of electrons and a single ion species, written in the drift-di¤usion transport approximation, and Poisson’s equation:
r Ji = ne
eE neni; Ji= Dirni ni ir';
r Je = ne
eE neni; Je= Derne+ne er';
"0r2' = e(ni ne): (3.1)
Hereni,ne,Ji,Je,Di,De, i, and eare number densities, charged species transport
‡uxes, di¤usion coe¢cients, and mobilities of the ions and electrons, respectively; is Townsend’s ionization coe¢cient; is coe¢cient of dissociative recombination; '
is electrostatic potential, E =jr'j is electric …eld strength;"0 is permittivity of free
space; and e is elementary charge. The local-…eld approximation is employed (i.e. electron transport and kinetic coe¢cients are assumed to depend on the local electric …eld only).
Boundary conditions at the cathode and anode are written in the conventional form. Di¤usion ‡uxes of the attracted particles are neglected as compared to drift; the normal ‡ux of the electrons emitted by the cathode is related to the ‡ux of inci-dent ions in terms of the e¤ective secondary emission coe¢cient , which is assumed to characterize all mechanisms of electron emission (due to ion, photon, and excited atom bombardment) [2]; density of ions vanishes at the anode; electrostatic potentials of both electrodes are given. The dielectric surface is electrically insulating, and absorbs the charged particles (i.e. case i) ni = ne = 0); for comparison, some solutions were
computed for the case of a re‡ecting dielectric surface (i.e. case ii) @ni
@r = @ne
@r = 0).
3. Modelling cathode spots in glow discharges in the cathode boundary
layer geometry 27
cathode (AB): @ni
@z = 0; Jez = Jiz; '= 0 ;
anode (CDE): ni= 0; @n@ne = 0; '=U;
dielectric (BC): i) ni=ne= 0 ii) @ni
@r = @ne
@r = 0
; Jer Jir= 0;
numerical boundary (EFG): ni =ne= 0 ; @'@n = 0:
(3.2)
HereU is the discharge voltage, the subscriptsr andzdenote radial and axial projec-tions of corresponding vectors, and@=@n means a normal derivative. The lengthsDE
and AG are large enough so that boundaries EF and F Gdo not a¤ect the solution;
simulations were run also with a smaller calculation domain (lengths DE and AG were reduced) and no signi…cant di¤erences in the solutions were observed. The results reported in this work refer to h = 0:5 mm, ha = 0:1 mm, and R = 0:5 mm unless
indicated otherwise.
The control parameter can be either discharge voltage U or discharge currentI, depending on the slope of the current voltage-characteristics (CVC)U(I). In the …rst case, the valueU of potential on the anode is set as the input parameter. In the second case, the problem is supplemented by a requirement that the discharge current takes a prescribed value and U is treated as an unknown that has to be found as a part of the solution; the calculation in this case is performed using a weak formulation in COMSOL Multiphysics.
Results reported in this work refer to a discharge in xenon under the pressure of
30 Torr. The (only) ionic species considered is Xe+2. The transport and kinetic
coe¢-cients are the same as in [57]. Note that a more detailed model (one that also took into account both atomic and molecular ions, excited atoms, excimers, stepwise ionization, ionization of excimers and non-locality of electron energy) was used for investigation of axially symmetric self-organized patterns in the parallel-plane con…guration [57] and gave patterns qualitatively similar to those predicted by the relatively simple model described in this section. On the other hand, the simple model results in signi…cantly reduced computation time, which was essential when performing 3D modelling. There-fore, the simple model was seen as adequate for the purpose of investigating the e¤ect of CBL discharge con…guration.
The problem (3.1) to (3.2) admits multiple solutions describing di¤erent discharge modes. One such mode exists for all ranges of current, it is 2D (axially symmetric) and termed fundamental, this is routine to calculate. 3D modes bifurcate from (and rejoin) the fundamental mode and are termed non-fundamental modes.
sta-3. Modelling cathode spots in glow discharges in the cathode boundary
layer geometry 28
tionary solutions are found for the problem (3.1)-(3.2) for a wide range of currents. Azimuthally periodic perturbations with an exponential time dependence are intro-duced. The time-dependent form of problem (3.1)-(3.2) is then linearized and assumes the form of an eigenvalue problem for a set of linear homogeneous di¤erential equa-tions, the perturbation increment being the eigenparameter. For each current and each azimuthal period, the problem is solved by means of the eigenvalue solver of COMSOL Multiphysics. Bifurcations are found at currents where vanishes.
Next a 3D calculation domain is created by rotating the 2D domain ABCDEF G
from Figure 3.1 about the axis AG of symmetry of the discharge vessel, by an angle equal to half of the azimuthal period of the 3D mode being sought. The beginning of the non-fundamental mode is then searched for on the fundamental mode, with the 3D calculation domain, in the vicinity of the bifurcation point predicted by the linear stability analysis. Small azimuthally periodic perturbations are introduced to the den-sities of charged species at the bifurcation point; the stationary solver’s iterations will eventually converge to the 3D mode. The remainder of the 3D mode is straightforward to calculate.
The above procedure was realized using stationary and eigenvalue solvers from the commercial product COMSOL Multiphysics. The meshes used were considered appropriate when after increasing their re…nement the solutions were not signi…cantly a¤ected. The time taken by the stationary solver to …nd convergence to one of the most computationally intensive 3D solutions is around1 hour, with a computer with a Intel Core i7-4770 CPU at 3:4 GHzand 32 GBof RAM.
3.3
Results
3.3.1 Fundamental mode
In Figure 3.2, the CVC of the fundamental mode is displayed in four sets of conditions, labeled 1 to 4 in the Figure. Surprisingly, two turning points and a loop are present on the CVC corresponding to the baseline conditions (h= 0:5 mm,ha= 0:1 mm, and
R= 0:5 mm, absorbing dielectric surface), line 1.
3. Modelling cathode spots in glow discharges in the cathode boundary
layer geometry 29
Figure 3.2: Fundamental mode. 1: baseline conditions. 2: h = 0.5mm, ha = 0.1mm,
R = 1.5mm. 3: baseline geomentry, re‡ecting dielectric surface. 4: h =0.25mm, ha =
3. Modelling cathode spots in glow discharges in the cathode boundary
layer geometry 30
Figure 3.3: Solid: fundamental mode (mode 1 of …gure 2). Dashed: mode a3b3.
Circles: points of bifurcation.
III, corresponding to the abnormal discharge, the discharge …lls most of the cathode surface.
3. Modelling cathode spots in glow discharges in the cathode boundary
layer geometry 31
3.3.2 3D modes
Figure 3.3 displays the CVC of the fundamental mode for the baseline conditions, points of bifurcation of 3D modes, and an example 3D mode. Each pair of points ai
andbi designates from where a 3D mode branches o¤ from and rejoins the fundamental
mode. Modeaibipossesses period2 =i, meaning thata1b1 possesses azimuthal period 2 , mode a2b2 possesses azimuthal period , and so on. Bifurcation points b1 to b4
virtually coincide. Pointsb5 andb6 are positioned on the section between the turning
points. The 3D modes branch o¤ and rejoin the fundamental mode in a palindromic order along current, which conforms to previous modelling of discharges with parallel-plane electrodes.
As an example, the CVC of mode a3b3 is shown in Figure 3.3. (The schematic
in the …gure illustrates the pattern of spots associated with this mode.) The CVC manifests a plateau between60 A m 2 and
300 A m 2, which is a manifestation of the
normal current density e¤ect. Note that the plateau also is present in the computed mode of the same azimuthal period for a vessel with parallel-plane electrodes and re‡ecting dielectric surface [58].
CVCs of several di¤erent modes would be di¢cult to distinguish in Figure 3.3. A more convenient representation is shown in Figure 3.4: the fundamental and four non-fundamental modes are mapped in the plane (hji; jc), where jc is the value of
current density at the position r= 0:4 mmon the upper vertical radius as marked by a cross on one of the images in Figure 3.4. Note that the valuer = 0:4 mmcoincides with the radius of the ring associated with the fundamental mode in the Townsend regime; it was found that such a choice ensures maximum distinction between the modes. Following the fundamental mode from low to high currents, it is seen thatjc
decreases while the central spot is forming, then it increases as the ring mode forms, thus yielding a limp Z-shape on the bifurcation diagram. Modes a5b5, a6b6 possess
turning points.
In Figure 3.5 the evolution is shown of patterns of current density on the cathode associated with modes a3b3; a4b4; a5b5; a6b6 from Figure 3.4 as discharge current is
changed. Let us consider …rst the evolution of the patterns for mode a3b3 which is
shown in Figure 3.5a). The state a)i) is positioned in the vicinity of the bifurcation point b3, the pattern is of three di¤use elongated spots, slightly deforming into a 3D
3. Modelling cathode spots in glow discharges in the cathode boundary
layer geometry 32
Figure 3.4: Bifurcation diagram. Solid: fundamental mode (mode 1 of …gure 2). Dashed: modes a3b3, a4b4, a5b5. Dotted: mode a6b6. Circles: points of bifurcation.
‘+’ on the image representing the mode a4b4 indicates the point on cathode surface
3. Modelling cathode spots in glow discharges in the cathode boundary
layer geometry 33
3. Modelling cathode spots in glow discharges in the cathode boundary
layer geometry 34
with decreasing current, the triangle shaped region becomes less sharp, and the whole pattern becomes more like the ring-shaped distribution present ata3.
The evolution of the patterns associated with modesa4b4,a5b5, anda6b6, is shown
in Figures 3.5b-d, respectively, follows the same trend as mode a3b3: …rst the ring
is transformed into elongated bean-shaped spots and then circular spots, then they migrate to a di¤erent radius, and there, from circular spots they turn into bean-shaped spots and then merge into a di¤erent ring. No 3D modes with central hot spots were found in the present work, while in previous modelling they were; e.g. [58]. The images in Figure 3.5 can be compared to experimentally observed patterns of spots, Figure 3.2 of [54]. The computed evolution from the abnormal mode into modea4b4,
comprising four spots (Figure 3.5b), is in good agreement with the experimentally observed transition between the abnormal mode into a mode comprising four spots.
In Figure 2 of [54], it can be seen how the modes appear in the experiment: starting from the abnormal mode and reducing discharge current, a mode comprising four spots appears. As current is further reduced, modes comprising …ve and six spots appear. Further reducing current from the mode with six spots, the discharge goes back to modes with …ve, four, three and a ring spot. In the modelling, cf. Figure 3.3, starting from a state in the abnormal mode and following the fundamental mode in the direction of low currents, the bifurcation point b1 of mode a1b1, comprising one spot, appears
…rst. The next bifurcation point to appear is b2 of modea2b2, comprising two spots;
and so on until bifurcation pointb6 of mode a6b6, comprising six spots, following the
same trend observed in the experiment. On further following the fundamental mode in the direction of low currents, eventually the bifurcation pointa5 of modea5b5 appears;
and so on untila1 of modea1b1, again following the same trend as in the experiment.
In Figure 3.6, typical distributions of discharge parameters along a cross section of a hot spot are shown. Figures 3.6 a)-c) refer to state i) in Figure 3.5b) and Figures 3.6 d)-f) refer to state iv). The e¤ect of normal current density is seen in Figure 3.6a) and 3.6c).
3. Modelling cathode spots in glow discharges in the cathode boundary
layer geometry 35
Figure 3.6: Cross section view of a 3D hot spot associated with the mode a4b4 at
3. Modelling cathode spots in glow discharges in the cathode boundary
layer geometry 36
assumption of absorbing dielectric surface, being more realistic by itself, gives results with better agreement with the experiment.
3.4
Conclusions
Self-organized 3D spot modes are reported for a typical con…guration of cathode boundary layer discharge (h = 0:5 mm, ha = 0:1 mm, and R = 0:5 mm) in xenon
at the pressure of 30 Torr. The general form of the computed self-organized patterns is similar to those computed previously in the parallel-plane con…guration and to those observed in the experiment in the sense that all of them comprise axially symmetric ring spots or circular arrangements of 3D spots. This is consistent with experimental evidence [49] that similar self-organized patterns appear in both electrode con…gura-tions.
Chapter 4
Bifurcations in the theory of
current transfer to cathodes of
DC discharges and observations
of transitions between di¤erent
modes
4.1
Introduction
Luminous spots on electrodes of direct current glow and arc discharges and self-organized patterns of spots represent a very interesting phenomenon, which is also important for applications. The presence, or not, of spots on electrodes is a key point for the operation of any arc device. Self-organized patterns appearing on cathodes of dc glow microdischarges are sources of excimer radiation [48,51]. Self-organized pat-terns on liquid anodes of atmospheric pressure glow microdischarges have been shown to produce a nontrivial cancer-inhibiting e¤ect [87].
The theoretical description of spots and spot patterns on electrodes of dc glow and arc discharges is based on the multiplicity of solutions: an adequate theoretical model must in some cases allow multiple steady-state solutions to exist for the same conditions (in particular, for the same discharge current I), with di¤erent solutions describing the spotless (di¤use) mode of current transfer and modes with di¤erent spot con…gurations.
Some of the multiple solutions may merge, or become identical at certain values of the control parameter; a bifurcation, or branching, of solutions. Bifurcations of